Albuquerque, NM, and Tucson, AZ are both vibrant, cultural cities located in the Southwest region of the United States. Each provides a unique living experience with distinct cultures, traditions, and amenities. Understanding the main factors comprising the quality of life, such as crime & safety, economic opportunities, weather conditions, education and healthcare services is essential for those considering to relocate or visit these cities. This comparison focuses on the conditions and opportunities on offer in Albuquerque and Tucson.
Distance between
Albuquerque, NM and
Tucson, AZ : 318.4 miles
Albuquerque's population is larger by 4%. Its population has grown by 113,992 people (25.4%) since 2000. The population of Tucson has grown by 56,543 people (11.6%) during that time.
When it comes to safety, both Albuquerque and Tucson have higher crime rates compared to the national average, largely related to property crimes. Violent crime in Albuquerque is higher than in Tucson. Enhanced safety measures have been implemented across both cities. However, as is typical in any city, crime rates can vary greatly between different neighborhoods.
City-data.com crime index counts serious crimes and violent crime more heavily. It adjusts for the number of visitors and daily workers commuting into cities. (higher means more crime, U.S. average = 301.1)
City-data.com crime index counts serious crimes and violent crime more heavily. It adjusts for the number of visitors and daily workers commuting into cities. (higher means more crime, U.S. average = 301.1)
Sex Offenders
According to our data, there are 848 registered sex offenders living in Albuquerque and 1,383 registered sex offenders living in . The ratio of residents to sex offenders in Albuquerque is 660 to 1; the ratio in Tucson is 384 to 1. The number of registered sex offenders compared to the number of residents is a smaller in Albuquerque than in Tucson.
Cost of Living
As for the cost of living, both cities are relatively affordable compared to other cities in the United States. Tucson is slightly cheaper than Albuquerque overall, especially in terms of housing costs. However, utility costs in Albuquerque tend to be lower than in Tucson.
Income Tax
New Mexico has a progressive income tax system, ranging from 1.7% to 4.9%. Arizona also has a progressive income tax, but it ranges from 3.6% to 8%, depending on income levels and filing status.
Property Tax
Property tax rates are generally lower in Tucson than in Albuquerque. New Mexico's property taxes average around 0.78%, while Arizona's average is about 0.62%.
Sales Tax
Both New Mexico and Arizona have state sales taxes, with Albuquerque at 7.88% and Tucson at 8.7%. However, New Mexico's "gross receipts tax" applies to more types of transactions than Arizona's sales tax.
Income
Type
Albuquerque
Tucson
Estimated median household income
$58,512
$50,306
Estimated per capita income
$35,738
$27,821
Cost of living index (U.S. average is 100)
93.6
90.1
If you make $50,000 in Tucson, you will have to make $51,942 in Albuquerque to maintain the same standard of living.
Geographical Conditions
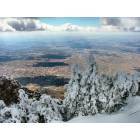
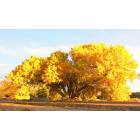
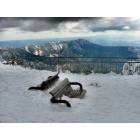
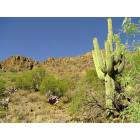
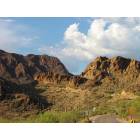
Albuquerque is situated in the Rio Grande Valley and is surrounded by mountains, making it appeal to outdoor enthusiasts with its hiking and biking opportunities. Tucson finds itself amidst the Sonoran Desert landscape and gorgeous mountain ranges, with access to beautiful parks and natural reserves.
Education quality varies significantly across both cities. Albuquerque is home to several reputed institutions, including the University of New Mexico. Tucson boasts the renowned University of Arizona. For K-12 education, Tucson has higher-rated schools, but both cities provide a range of public and private school options.
Economically, both Tucson and Albuquerque are not as robust as some larger metropolitan areas, but they still offer various employment opportunities. In Albuquerque, the economy is driven by sectors like healthcare, education, and professional services. Tucson's economy is significantly bolstered by the presence of the University of Arizona and a strong health care sector.
Biggest Employers
The biggest employers in Albuquerque include the University of New Mexico, Sandia National Laboratories, and Kirtland Air Force Base. In Tucson, the University of Arizona, Banner Health, and Raytheon Missile Systems are some of the top employers.
There were 773 building permits issued in Albuquerque in 2012 (19 more than in 2011) compared to 1,134 building permits issued in Tucson in 2012 (832 more than in 2011).
In Albuquerque (Bernalillo County), 55.8% voted for Democrats and 39.4% for Republicans in 2012 Presidential Election. In Tucson (Pima County), 52.7% voted for Democrats and 45.7% for Republicans.
Elections
Type
Democrats
Republicans
Other
Year
Albuquerque
Tucson
Albuquerque
Tucson
Albuquerque
Tucson
2020
61.3%
58.4%
36.7%
39.8%
2.0%
1.7%
2016
52.4%
53.3%
34.6%
39.7%
13.0%
7.0%
2012
55.8%
52.7%
39.4%
45.7%
4.9%
1.6%
2008
60.2%
52.4%
38.8%
46.3%
1.0%
1.4%
2004
51.6%
52.7%
47.4%
46.7%
0.9%
0.6%
2000
48.8%
51.4%
46.8%
43.3%
4.4%
5.3%
1996
48.3%
52.2%
43.2%
39.4%
8.5%
8.5%
Breakdown of population affiliated with a religious congregation
Type
Adherents
Congregations
Religion
Albuquerque
Tucson
Albuquerque
Tucson
CATHOLIC CHURCH
26.5%
20.8%
10.7%
7.9%
SOUTHERN BAPTIST CONVENTION
2.6%
2.3%
11.4%
10.4%
EPISCOPAL CHURCH
0.7%
0.8%
1.9%
1.4%
CUMBERLAND PRESBYTERIAN CHURCH
0.4%
0.0%
0.2%
0.2%
EVANGELICAL LUTHERAN CHURCH IN AMERICA
0.4%
0.9%
1.9%
2.5%
SEVENTH DAY ADVENTIST CHURCH
0.4%
0.3%
1.9%
1.9%
LUTHERAN CHURCH
0.3%
0.4%
1.7%
1.4%
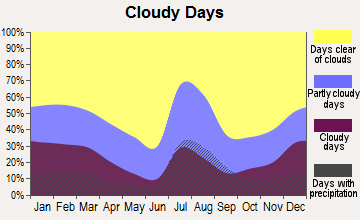
Weather
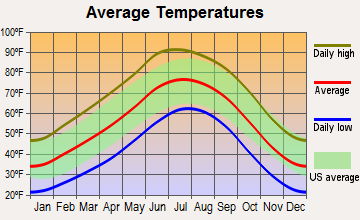
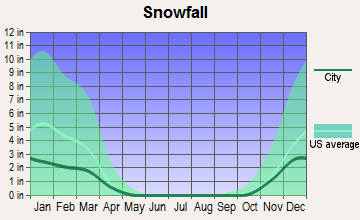
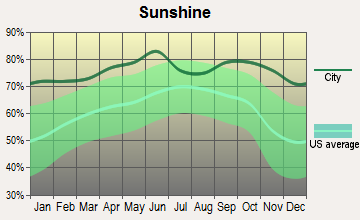
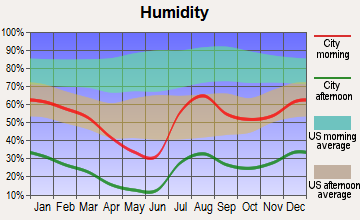
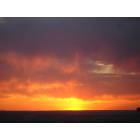
Climate is one of the key advantages of living in Tucson and Albuquerque. Both cities benefit from more than 200 days of sunshine a year. Tucson, located in the Sonoran Desert, gets warmer temperatures in summer, but milder winters compared to Albuquerque. Albuquerque, situated at a higher altitude, has cooler summers and colder winters, but boasts a more diverse weather pattern with an enchanting monsoon season and beautiful snow during winter.
Weather and climate
Type
Albuquerque
Tucson
Temperature - Average
55.6°F
70°F
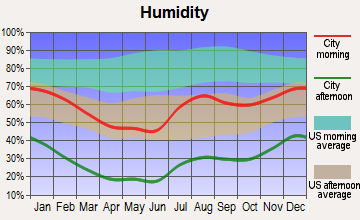
Humidity - Average morning or afternoon humidity
44.3%
38.6%
Humidity - Differences between morning and afternoon humidity
46%
46%
Humidity - Maximum monthly morning or afternoon humidity
63%
58%
Humidity - Minimum monthly morning or afternoon humidity
17%
12%
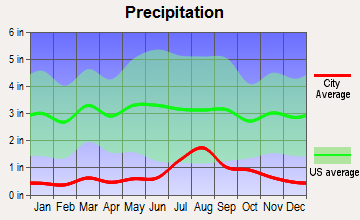
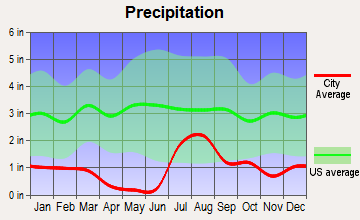
Precipitation - Yearly average
9.4 in
12 in
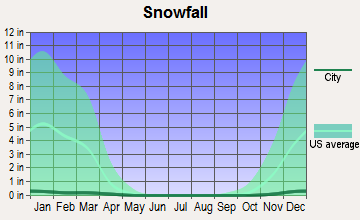
Snowfall - Yearly average
19.2 in
2 in
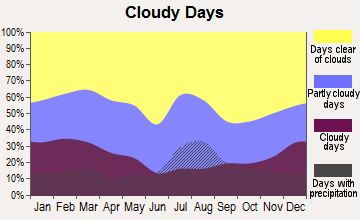
Clouds - Number of days clear of clouds
27.8%
32.3%
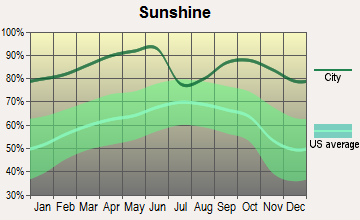
Sunshine amount - Average
82.7%
92.8%
Sunshine amount - Differences during a year
9%
15%
Sunshine amount - Maximum monthly
82%
94%
Sunshine amount - Minimum monthly
73%
79%
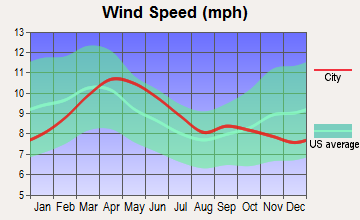
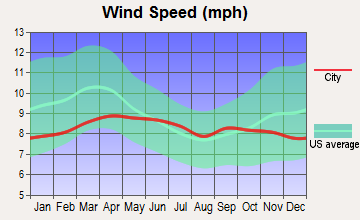
Wind speed - Average
8.9 mph
8.3 mph
Average climate in Albuquerque, New Mexico
Average climate in Tucson, Arizona
Air pollution
Type
AQI
CO
NO2
OZONE
PB
PM10
PM25
SO2
Year
Albuquerque
Tucson
Albuquerque
Tucson
Albuquerque
Tucson
Albuquerque
Tucson
Albuquerque
Albuquerque
Tucson
Albuquerque
Tucson
Albuquerque
Tucson
2018
95
87
0.23
0.19
10.3
8.3
35.3
32.0
N/A
N/A
20.3
29.9
4.3
5.5
0.5
0.1
2017
82
73
0.24
0.18
10.4
8.4
33.5
31.7
N/A
N/A
18.4
32.2
5.7
7.1
0.4
0.1
2016
86
68
0.22
0.21
10.4
7.9
33.2
29.7
N/A
N/A
16.0
25.3
5.3
4.5
0.8
0.1
2015
84
62
0.23
0.21
11.2
8.7
30.8
29.7
N/A
N/A
16.0
25.4
6.1
5.1
0.7
0.2
2014
89
74
0.22
0.19
11.7
10.0
31.8
28.8
N/A
N/A
22.0
28.0
6.1
5.6
0.6
0.2
2013
91
94
0.22
0.17
11.8
10.4
34.1
30.4
N/A
N/A
21.8
30.9
5.7
6.8
0.8
0.2
2012
116
73
0.18
0.20
13.7
11.8
33.6
30.0
N/A
N/A
26.6
31.2
9.3
5.6
0.7
0.2
2011
130
81
0.21
0.22
13.5
11.9
34.0
31.0
N/A
N/A
28.6
29.7
9.9
5.8
0.4
0.3
2010
92
68
0.15
0.29
12.2
10.8
32.1
30.5
N/A
N/A
25.1
25.5
6.8
N/A
N/A
0.5
2009
81
82
0.16
0.25
12.5
11.2
30.4
29.2
N/A
N/A
26.2
31.9
6.9
N/A
N/A
0.5
2008
91
81
0.21
0.29
11.8
12.2
31.5
29.2
N/A
N/A
20.8
32.0
6.5
N/A
N/A
0.9
2007
112
75
0.29
0.37
13.0
13.4
31.4
28.7
N/A
N/A
19.7
27.3
6.7
N/A
N/A
0.9
2006
103
74
0.33
0.41
14.2
15.3
31.8
27.7
N/A
N/A
21.1
17.3
N/A
N/A
N/A
0.6
2005
85
76
0.32
0.43
13.9
15.1
29.7
26.0
N/A
N/A
20.0
17.8
N/A
N/A
N/A
0.7
2004
89
77
0.32
0.49
16.6
15.6
29.8
25.6
0.003
N/A
21.5
14.0
N/A
N/A
N/A
1.2
2003
115
81
0.37
0.57
17.6
17.2
31.9
27.1
0.004
N/A
25.1
19.2
N/A
N/A
N/A
1.2
2002
91
76
0.43
0.56
18.9
16.9
29.1
26.8
0.005
N/A
23.1
19.9
N/A
N/A
N/A
1.0
2001
81
70
0.67
0.55
17.2
16.4
29.4
26.1
N/A
N/A
20.9
23.2
N/A
N/A
N/A
0.8
2000
95
78
0.81
0.50
17.0
16.7
27.9
26.4
N/A
N/A
17.7
N/A
N/A
N/A
N/A
2.3
Natural disasters
Type
Albuquerque
Tucson
Tornado activity compared to U.S. average
6.4%
8.9%
Earthquake activity compared to U.S. average
802.6%
1,584.9%
Natural disasters compared to U.S. average
9%
13%
Transportation
Albuquerque offers more extensive public transit, with its bus and commuter rail networks. Commuting is simpler due to the layout of the city and less traffic. Tucson also provides bus and streetcar options, but overall, both are car-oriented cities.
Transport
Type
Albuquerque
Tucson
Amtrak stations
1
1
Amtrak stations nearby
1
1
FAA registered aircraft
1
983
FAA registered aircraft manufacturers and dealers
17
14
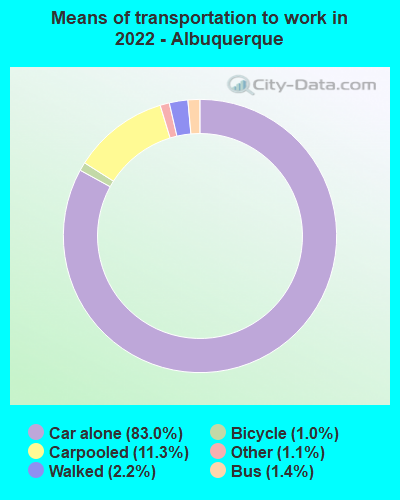
Means of transportation to work
Type
Albuquerque
Tucson
Bicycle
0.9%
1%
Bus
0.8%
1.9%
Carpooled
9.6%
11.5%
Car alone
85.1%
81.9%
Motorcycle
0.2%
0.5%
Walked
2.3%
2.3%
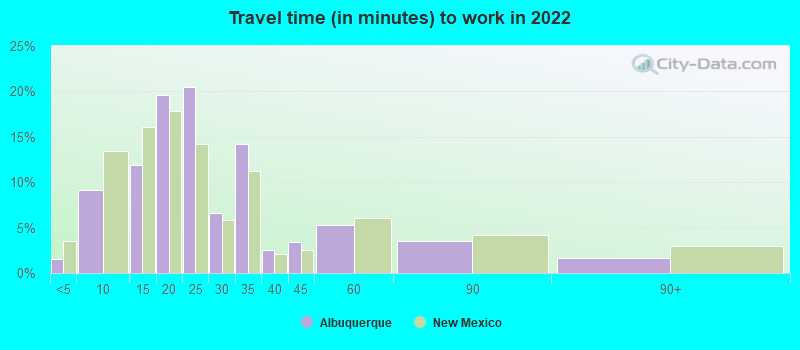
Average travel time to work
Type
Albuquerque
Tucson
Average
24.5 min
26 min
Other means
20.8 min
21.6 min
Public transportation
37.8 min
42.5 min
Private vehicle occupancy
Type
Albuquerque
Tucson
Average
1.1
1.2
Drove alone
91.6%
86.3%
In 2 person carpool
6.6%
10.1%
In 3 person carpool
1.2%
2.5%
In 4 person carpool
0.3%
1%
In 7+ person carpool
0.2%
0.1%
How many people usually rode to work in the car, truck or van.
Real Estate
Real estate in Tucson is generally cheaper than in Albuquerque. However, both cities offer a variety of housing styles and sizes to match different needs. The property market in both towns provides a good blend of urban apartments and suburban homes.
Neighborhoods
Both cities feature distinctive neighborhoods, each bearing a unique character and charm. Albuquerque's most coveted areas include Nob Hill, Taylor Ranch, and North Valley. In Tucson, top neighborhoods encompass the Catalina Foothills, Sam Hughes, and El Conquistador.
Houses and residents
Type
Albuquerque
Tucson
Houses
256,814
242,816
Average household size (people)
2.4
2.4
Median year apartment built
1983
1979
Median year house/condo built
1984
1978
Length of stay in the house since moving in
12.6 years
13.2 years
Houses occupied
243,582 (94.8%)
223,068 (91.9%)
Houses occupied by owners
147,964 (60.7%)
114,708 (51.4%)
Houses occupied by renters
95,618 (39.3%)
108,360 (48.6%)
Median rent asked for vacant for-rent units
$893.82
$801.80
Median monthly housing costs
$1,021
$951
Median price asked for vacant for-sale houses and condos
$171,149
$557,132
Estimated median house or condo value
$251,500
$224,800
Median numbers of rooms
5.3
4.9
Median number of rooms in apartments
3.9
4
Median number of rooms in houses and condos
6.2
5.8
Median house price - detached houses
$290,578
$262,219
Median house price - in 2-unit structures
$636,758
$147,793
Median house price - in 3-to-4-unit structures
$274,794
$125,313
Median house price - in 5 or more unit structures
$224,872
$135,055
Median house price - mobile homes
$52,392
$48,136
Median house price - occupied boats, rvs, vans etc.
$35,209
$53,411
Median house price - Townhouses or other attached units
$209,825
$210,375
Median house price - All housing units
$271,083
$234,849
Median house age
38
43
Renting percentage
39.7%
48.1%
Housing density (houses/condos per square mile)
1,421.7
1,247.3
House value disparities
29.8%
32.8%
Household income disparities
45.9%
44.9%
Median household income for houses/condes with a mortgage
$87,851
$76,356
Median household income for apartments without a mortgage
$63,195
$54,612
Housing units without a mortgage
1,631 (1.6%)
1,087 (1.5%)
Housing units with both a second mortgage and home equity loan
3,560 (3.6%)
2,785 (3.9%)
Housing units with a mortgage
97,744 (98.4%)
70,054 (98.5%)
Housing units with a home equity loan
309 (0.3%)
211 (0.3%)
Housing units with a second mortgage
6,864 (6.9%)
4,051 (5.7%)
House/condo owner moved in on average (years ago)
11
11
House/condo renter moved in on average (years ago)
1
1
Housing units lacking complete kitchen facilities
1.1%
1.2%
Housing units lacking complete plumbing facilities
0.3%
0.8%
Housing units in structures
Housing units in structures
Albuquerque
Tucson
One, detached
61.4%
53.5%
One, attached
6.6%
8.3%
Two
1.0%
2.5%
3 or 4
6.1%
4.3%
5 to 9
4.7%
5.0%
10 to 19
4.7%
5.6%
20 to 49
4.8%
5.8%
50 or more
6.3%
8.6%
Mobile homes
4.2%
6.2%
Boats, RVs, vans, etc.
0.0%
0.2%
Median real estate property taxes paid for housing units
Self-employed workers in own not incorporated business
14,060
14,487
State government workers
20,531
17,981
Unpaid family workers
359
709
Industries and Occupations
Major industries in Albuquerque include healthcare, retail trade, and education. Some of the fastest-growing industries are in technology and filmmaking. Tucson, on the other hand, boasts a significant aerospace and defense industry, along with education, healthcare, and tourism sectors.
Albuquerque and Tucson both provide excellent healthcare services. Albuquerque is home to University of New Mexico Hospital, and Presbyterian Hospital. Tucson has Banner University Medical Center and Tucson Medical Center, both considered among the best in the state.
Health (county statistics)
Type
Albuquerque
Tucson
General health status score of residents in this county from 1 (poor) to 5 (excellent)
Infrastructure in both Tucson and Albuquerque is well established, with community facilities, shopping and entertainment venues, and public parks readily available. Albuquerque has a larger and more sprawling urban area compared to Tucson, meaning infrastructure is more spread out.
Infrastructure
Type
Albuquerque
Tucson
Hospitals
36
24
TV stations
18
20
Arenas or stadiums
1
2
Bank branches located here
137
159
Bank institutions located here
24
17
Main business address for public companies
8
6
Drinking water stations with no reported violations in the past
7
0
Drinking water stations with reported violations in the past
HMDA - Conventional home purchase loans - Applications denied
Year
Albuquerque
Tucson
1999
2,651
3,131
2000
1,303
1,601
2001
752
912
2002
693
778
2003
1,022
1,409
2004
1,729
2,041
2005
2,199
2,872
2006
2,639
2,833
2007
1,575
1,601
2008
654
714
2009
368
386
Culture and Food
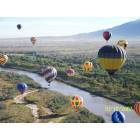
Both cities offer vibrant culture with Southwestern and Native American influences. Albuquerque, being larger, has a diverse cultural scene with numerous events throughout the year, including the International Balloon Fiesta. Tucson is renowned for its food and was designated a UNESCO City of Gastronomy.
Sports Teams
For sports enthusiasts, Albuquerque is home to the New Mexico United soccer team and the Albuquerque Isotopes baseball team. Tucson doesn't have its own major league sports teams, but being home to the University of Arizona means college sports are popular and widely followed.
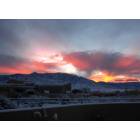


 Albuquerque, NM
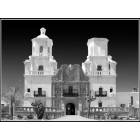
 Tucson, AZ