Anaheim, CA and San Bernardino, CA are two diverse and bustling Californian cities with their own unique sets of advantages and challenges. Proximity to major attractions, regional culinary delights, and varying economic landscapes are apparent in both. This detailed comparison will provide a comprehensive vision of what life and tourism are like in these two cities to aid those considering a move or a visit.
Distance between
Anaheim, CA and
San Bernardino, CA : 39.7 miles
Anaheim's population is larger by 56%. Its population has grown by 17,926 people (5.5%) since 2000. The population of San Bernardino has grown by 36,802 people (19.9%) during that time.
Anaheim has a mixed crime rate, lower than San Bernardino, but higher than the national average. It is crucial, as in any city, to stay alert and be cautious in certain areas. On the flip side, San Bernardino has been grappling with high crime rates for years, notably higher than both the state and national averages. However, concerted efforts by law enforcement and community organizations are showing steady improvements in the city's safety status.
City-data.com crime index counts serious crimes and violent crime more heavily. It adjusts for the number of visitors and daily workers commuting into cities. (higher means more crime, U.S. average = 301.1)
City-data.com crime index counts serious crimes and violent crime more heavily. It adjusts for the number of visitors and daily workers commuting into cities. (higher means more crime, U.S. average = 301.1)
Sex Offenders
According to our data, there are 366 registered sex offenders living in Anaheim and 698 registered sex offenders living in . The ratio of residents to sex offenders in Anaheim is 959 to 1; the ratio in San Bernardino is 310 to 1. The number of registered sex offenders compared to the number of residents is a lot smaller in Anaheim than in San Bernardino.
Cost of Living
The cost of living in Anaheim is higher than in San Bernardino. Housing, health care, transportation, and groceries are generally more expensive in Anaheim. This is partly due to Anaheim's proximity to entertainment hotspots and beaches, which makes it more desirable. San Bernardino offers a more affordable living cost, making it a practical choice for families and retirees on a budget.
Income Tax
Both cities are in California and therefore have the same state income tax rates, which range from 1% to 13.3% depending on income level.
Property Tax
The average property tax in Anaheim is approximately 0.68% of a property's market value, slightly below the state average. In San Bernardino, the average property tax rate is slightly higher at around 0.75% of the market value.
Sales Tax
California's base sales tax is 7.25%. Anaheim has an additional district tax, making the total sales tax 8%. San Bernardino's total sales tax rate is slightly higher at 8.25%.
Income
Type
Anaheim
San Bernardino
Estimated median household income
$81,747
$65,311
Estimated per capita income
$32,827
$22,624
Cost of living index (U.S. average is 100)
88.5
82.2
If you make $50,000 in San Bernardino, you will have to make $53,832 in Anaheim to maintain the same standard of living.
Geographical Conditions
Anaheim's geography is largely flat with some rolling hills, located inland but near the Pacific Ocean, and enjoys mild average temperatures year-round due to its coastal influences. San Bernardino is located further inland with a more varied terrain featuring beautiful mountains and valleys. Its climate is hotter in summer and cooler in winter.
Anaheim boasts numerous esteemed universities and colleges, including Anaheim University and North Orange County Community College District. The city places a strong emphasis on education, with several highly rated schools. San Bernardino is home to California State University, San Bernardino, and San Bernardino Valley College. However, public schools generally rank lower compared to those in Anaheim.
Anaheim's economy is driven primarily by tourism, particularly Disneyland Resort, which attracts millions of visitors annually. Other sectors include manufacturing, retail and health care. San Bernardino's economy, conversely, is driven by logistics, health services, retail and education sectors. Unemployment rates can vary, but they tend to be higher in San Bernardino.
Biggest Employers
Anaheim's biggest employers include Disneyland Resort, Kaiser Permanente, Northgate Gonzalez Market, and Anaheim Regional Medical Center. San Bernardino's major employers are Amazon, Stater Bros, California State University, San Bernardino, and San Bernardino County Superintendent of Schools.
There were 85 building permits issued in Anaheim in 2012 (44 more than in 2011) compared to 143 building permits issued in San Bernardino in 2012 (119 more than in 2011).
In Anaheim (Orange County), 45.8% voted for Democrats and 52.0% for Republicans in 2012 Presidential Election. In San Bernardino (San Bernardino County), 52.3% voted for Democrats and 45.0% for Republicans.
Elections
Type
Democrats
Republicans
Other
Year
Anaheim
San Bernardino
Anaheim
San Bernardino
Anaheim
San Bernardino
2020
53.6%
54.2%
44.6%
43.6%
1.8%
2.2%
2016
50.9%
52.1%
42.4%
41.5%
6.7%
6.4%
2012
45.8%
52.3%
52.0%
45.0%
2.3%
2.6%
2008
47.8%
52.2%
50.3%
45.8%
1.9%
2.0%
2004
39.3%
43.8%
60.2%
55.6%
0.5%
0.6%
2000
40.4%
47.3%
55.9%
48.8%
3.7%
3.9%
1996
37.9%
44.4%
51.7%
43.6%
10.5%
12.1%
Breakdown of population affiliated with a religious congregation
Type
Adherents
Congregations
Religion
Anaheim
San Bernardino
Anaheim
San Bernardino
CATHOLIC CHURCH
26.5%
21.9%
4.4%
4.3%
SOUTHERN BAPTIST CONVENTION
2.3%
2.2%
8.8%
9.6%
MUSLIM ESTIMATE
0.8%
0.6%
1.3%
1.1%
LUTHERAN CHURCH
0.6%
0.3%
2.0%
1.7%
EPISCOPAL CHURCH
0.4%
0.1%
1.4%
1.3%
EVANGELICAL LUTHERAN CHURCH IN AMERICA
0.4%
0.2%
2.3%
1.5%
SEVENTH DAY ADVENTIST CHURCH
0.4%
1.6%
1.3%
4.6%
REFORMED CHURCH IN AMERICA
0.3%
0.0%
0.2%
0.2%
Weather
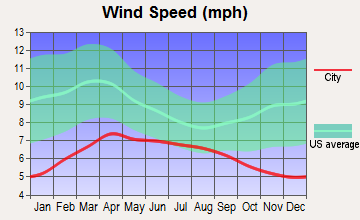
Weather-wise, both cities experience a Mediterranean climate, but Anaheim generally offers cooler summers and less extreme seasonal temperature swings. Anaheim is heavily influenced by a coastal climate, providing humid, warm summers and mild winters. San Bernardino experiences somewhat hotter summers and colder winters due to its inland location.
Weather and climate
Type
Anaheim
San Bernardino
Temperature - Average
64.9°F
64.8°F
Humidity - Average morning or afternoon humidity
69.6%
65.9%
Humidity - Differences between morning and afternoon humidity
25.9%
20.5%
Humidity - Maximum monthly morning or afternoon humidity
77.9%
72.2%
Humidity - Minimum monthly morning or afternoon humidity
52%
51.7%
Precipitation - Yearly average
12 in
17.9 in
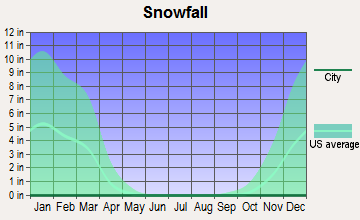
Snowfall - Yearly average
0 in
0 in
Clouds - Number of days clear of clouds
26.6%
27.5%
Sunshine amount - Average
78.4%
78.3%
Sunshine amount - Differences during a year
22%
21.4%
Sunshine amount - Maximum monthly
84.9%
84.2%
Sunshine amount - Minimum monthly
63%
62.7%
Wind speed - Average
5.7 mph
4.1 mph
Average climate in Anaheim, California
Average climate in San Bernardino, California
Air pollution
Type
AQI
CO
NO2
OZONE
PB
PM10
PM25
SO2
Year
Anaheim
San Bernardino
Anaheim
San Bernardino
Anaheim
San Bernardino
Anaheim
San Bernardino
Anaheim
San Bernardino
Anaheim
San Bernardino
Anaheim
San Bernardino
Anaheim
San Bernardino
2018
139
153
0.36
0.33
13.7
15.5
26.8
32.1
0.007
0.006
27.5
29.9
12.1
11.7
0.7
0.4
2017
145
148
0.50
0.40
14.8
15.7
26.7
33.9
0.007
0.004
26.7
32.0
13.5
13.3
0.6
0.3
2016
132
140
0.57
0.52
14.5
15.9
26.3
32.0
0.007
0.006
24.1
33.9
12.9
11.8
0.3
0.3
2015
142
147
0.45
0.49
14.7
15.8
26.0
32.3
0.007
0.004
25.0
31.5
14.8
12.7
0.3
0.3
2014
138
147
0.40
0.47
15.0
16.4
26.7
30.8
0.008
0.006
26.7
35.0
16.2
14.3
0.5
0.3
2013
138
147
0.47
0.42
14.8
17.0
25.3
28.8
0.005
0.006
28.3
32.2
13.9
13.2
0.5
0.3
2012
142
148
0.46
0.44
14.5
18.0
25.0
28.8
0.005
0.007
27.0
31.8
14.7
14.2
0.2
0.4
2011
138
150
0.42
0.35
15.9
18.0
26.7
27.9
0.007
0.006
27.4
30.6
16.0
17.7
0.8
0.4
2010
130
144
0.44
0.36
16.7
18.8
25.8
28.1
0.009
0.008
23.5
28.8
14.9
15.5
0.6
1.1
2009
151
151
0.41
0.35
18.0
20.0
26.0
28.1
0.010
0.011
24.4
31.9
15.4
17.5
1.1
1.2
2008
156
152
0.38
0.39
20.3
20.1
26.7
27.7
0.010
0.012
30.2
36.9
18.9
22.0
1.1
1.2
2007
135
132
0.38
0.49
19.5
22.5
26.2
25.9
0.012
0.016
N/A
N/A
N/A
N/A
0.8
1.7
2006
128
128
0.43
0.53
19.1
24.5
26.3
25.4
0.008
0.010
N/A
N/A
N/A
N/A
1.3
1.6
2005
128
132
0.45
0.58
20.7
26.8
31.3
24.4
0.013
0.011
N/A
N/A
N/A
N/A
1.3
2.7
2004
134
140
0.53
0.64
19.9
22.9
37.1
25.0
0.015
0.013
N/A
N/A
N/A
N/A
1.6
2.2
2003
143
143
0.69
0.97
23.7
26.9
23.8
24.3
0.025
0.032
N/A
N/A
N/A
N/A
1.1
1.5
2002
134
140
0.77
0.92
24.1
29.4
21.8
24.0
0.019
0.018
N/A
N/A
N/A
N/A
2.1
0.6
2001
143
144
0.94
0.81
28.4
30.9
24.5
26.4
0.035
0.039
N/A
N/A
N/A
N/A
1.7
1.1
2000
152
155
0.80
0.86
29.4
30.1
23.0
21.9
0.030
0.040
N/A
N/A
N/A
N/A
1.9
1.6
Natural disasters
Type
Anaheim
San Bernardino
Tornado activity compared to U.S. average
19.3%
15.9%
Earthquake activity compared to U.S. average
7,039.7%
7,481.9%
Natural disasters compared to U.S. average
32%
46%
Transportation
Anaheim's public transit system, including buses and trains, is extensive and reliable. Its convenience is increased by the city's proximity to several major highways. San Bernardino also has reliable public transit, but commuting times can be longer due to its expansive size and traffic.
Transport
Type
Anaheim
San Bernardino
Amtrak stations
1
1
Amtrak stations nearby
3
3
FAA registered aircraft
136
80
FAA registered aircraft manufacturers and dealers
3
3
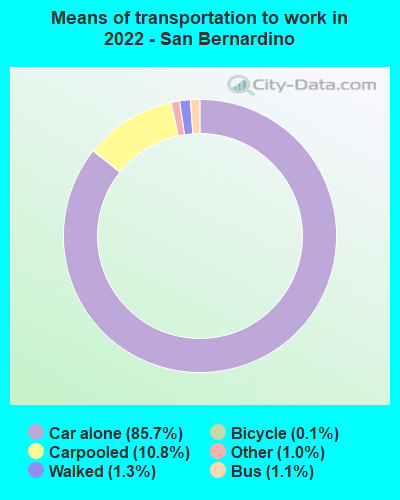
Means of transportation to work
Type
Anaheim
San Bernardino
Bicycle
1%
0.4%
Bus
0.9%
0.7%
Carpooled
10.8%
13.2%
Car alone
83.4%
82.9%
Motorcycle
0.2%
0.2%
Railroad
0.2%
0.2%
Subway
0.3%
0%
Walked
1.6%
1.4%
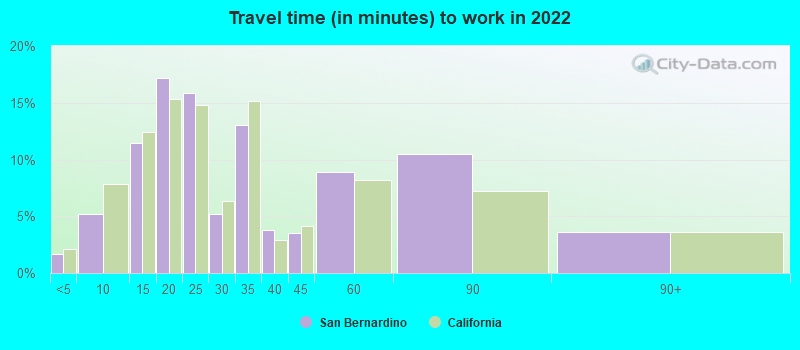
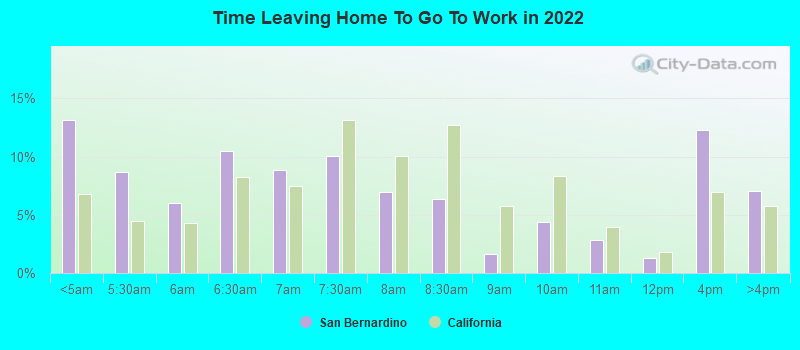
Average travel time to work
Type
Anaheim
San Bernardino
Average
30.8 min
30.8 min
Other means
28.1 min
26.8 min
Public transportation
47.8 min
45.7 min
Private vehicle occupancy
Type
Anaheim
San Bernardino
Average
1.2
1.2
Drove alone
85.3%
85.5%
In 2 person carpool
11.2%
10.7%
In 3 person carpool
1.8%
2.8%
In 4 person carpool
0.8%
0.3%
In 5-6 person carpool
0.9%
0.5%
How many people usually rode to work in the car, truck or van.
Real Estate
Anaheim real estate is pricier than in San Bernardino, reflecting its desirability and proximity to popular attractions and the coast. However, both cities offer a range of housing options, from condos to single-family homes. San Bernardino's real estate market offers excellent affordability, especially for first-time homebuyers or investors.
Neighborhoods
Anaheim neighborhoods such as Anaheim Hills, Southwest Anaheim, and Platinum Triangle are popular for their amenities and comfortable living. San Bernardino offers neighborhoods like Verdemont and Ridgeline that are known for their scenic beauty and quieter residential feel.
Houses and residents
Type
Anaheim
San Bernardino
Houses
110,319
66,188
Average household size (people)
3.4
3.4
Median year apartment built
1975
1978
Median year house/condo built
1970
1969
Length of stay in the house since moving in
14.8 years
13.1 years
Houses occupied
105,608 (95.7%)
63,331 (95.7%)
Houses occupied by owners
51,684 (48.9%)
32,391 (51.1%)
Houses occupied by renters
53,924 (51.1%)
30,940 (48.9%)
Median rent asked for vacant for-rent units
$2,111
$1,123
Median monthly housing costs
$1,910
$1,342
Median price asked for vacant for-sale houses and condos
$1,256,069
$195,043
Estimated median house or condo value
$688,400
$350,000
Median numbers of rooms
4.7
5
Median number of rooms in apartments
3.6
4.1
Median number of rooms in houses and condos
6.1
5.8
Median house price - detached houses
$859,592
$403,627
Median house price - in 3-to-4-unit structures
$546,946
$150,029
Median house price - in 5 or more unit structures
$553,561
$162,515
Median house price - mobile homes
$114,904
$234,640
Median house price - Townhouses or other attached units
$619,623
$280,582
Median house price - All housing units
$782,600
$380,769
Median house age
48
47
Renting percentage
51.5%
49.7%
Housing density (houses/condos per square mile)
2,254.1
1,125.4
House value disparities
20.2%
26.6%
Household income disparities
43.6%
41.1%
Median household income for houses/condes with a mortgage
$125,169
$92,118
Median household income for apartments without a mortgage
$86,779
$67,257
Housing units without a mortgage
374 (1%)
127 (0.6%)
Housing units with both a second mortgage and home equity loan
2,222 (6%)
762 (3.4%)
Housing units with a mortgage
36,875 (99%)
22,340 (99.4%)
Housing units with a home equity loan
0 (0%)
0 (0%)
Housing units with a second mortgage
2,794 (7.5%)
1,041 (4.6%)
House/condo owner moved in on average (years ago)
14
12
House/condo renter moved in on average (years ago)
4
3
Housing units lacking complete kitchen facilities
4.5%
2.8%
Housing units lacking complete plumbing facilities
0.1%
0.6%
Housing units in structures
Housing units in structures
Anaheim
San Bernardino
One, detached
42.7%
62.2%
One, attached
8.3%
4.2%
Two
2.3%
0.9%
3 or 4
7.6%
4.1%
5 to 9
6.8%
4.6%
10 to 19
5.5%
4.5%
20 to 49
6.8%
3.0%
50 or more
17.2%
10.3%
Mobile homes
2.6%
6.1%
Boats, RVs, vans, etc.
0.1%
0.1%
Median real estate property taxes paid for housing units
Self-employed workers in own not incorporated business
11,077
5,389
State government workers
5,046
4,741
Unpaid family workers
65
290
Industries and Occupations
In Anaheim, the major industries include tourism, entertainment, manufacturing, and retail. Health care and educational services are also key employers. San Bernardino's economy is primarily based on the logistics industry due to its strategic location, with retail and health care as other leading industries.
Both cities have accessible health care services with several notable hospitals. Anaheim has renowned facilities like the Children's Hospital of Orange County and Anaheim Regional Medical Center. San Bernardino houses the Community Hospital of San Bernardino and Arrowhead Regional Medical Center among others.
Health (county statistics)
Type
Anaheim
San Bernardino
General health status score of residents in this county from 1 (poor) to 5 (excellent)
Anaheim has robust infrastructure, with multiple freeways providing accessibility. There's an ongoing development of spacious parks, community centers, and upgraded water systems. San Bernardino, while necessary infrastructures are adequate, has experienced economic struggles leading to decreased investments in infrastructure updates and maintenance.
Infrastructure
Type
Anaheim
San Bernardino
Hospitals
22
8
TV stations
6
6
Arenas or stadiums
2
1
Bank branches located here
46
18
Bank institutions located here
19
8
Drinking water stations with no reported violations in the past
1
11
Drinking water stations with reported violations in the past
HMDA - Conventional home purchase loans - Applications denied
Year
Anaheim
San Bernardino
1999
914
586
2000
679
503
2001
632
470
2002
735
707
2003
1,047
1,513
2004
1,456
2,236
2005
1,965
3,147
2006
1,999
3,423
2007
1,230
1,714
2008
599
554
2009
378
285
Culture and Food
Anaheim has a diverse cultural scene, with a rich blend of food, art, music and events. Its food scene is well-known, particularly for its mix of culinary offerings influenced by its diverse population and proximity to LA. In contrast, San Bernardino also has a variety of cultural influences but presents a more relaxed, less urban experience. Its food scene is popular for classic American and Mexican cuisine.
Sports Teams
Anaheim is home to two major sports teams: the Anaheim Ducks of the NHL and the Los Angeles Angels of MLB. San Bernardino lacks major league sports teams but offers minor league baseball with the Inland Empire 66ers and collegiate sports at CSUSB.


 Anaheim, CA
 San Bernardino, CA