This comparison between Anaheim and Westminster, both cities located in the sunny state of California, will provide an in-depth understanding of the differences and similarities in each city. When considering factors like crime/safety, weather, cost of living, education, work and economy, infrastructure, and more, there are distinct qualities that might make one city more appealing than the other. Both cities offer a unique living experience for both residents and tourists showcased in their geographical conditions, health care standards, cultural points and a lot more.
Distance between
Anaheim, CA and
Westminster, CA : 8.4 miles
Anaheim's population is larger by 284%. Its population has grown by 17,926 people (5.5%) since 2000. The population of Westminster has grown by 1,988 people (2.3%) during that time.
Safety is a major aspect for anyone relocating or visiting. Current data shows that Westminster has a lower crime rate compared to Anaheim. While every city has its troubled areas, Westminster is, in general, safer. Anaheim, on the other hand, experiences larger pedestrian crowds especially due to the presence of Disney Land and thus, higher incidences of crime. Regardless of these statistics, it’s important for residents and visitors to take personal safety precautions in both cities.
City-data.com crime index counts serious crimes and violent crime more heavily. It adjusts for the number of visitors and daily workers commuting into cities. (higher means more crime, U.S. average = 301.1)
City-data.com crime index counts serious crimes and violent crime more heavily. It adjusts for the number of visitors and daily workers commuting into cities. (higher means more crime, U.S. average = 301.1)
Sex Offenders
According to our data, there are 366 registered sex offenders living in Anaheim and 83 registered sex offenders living in . The ratio of residents to sex offenders in Anaheim is 959 to 1; the ratio in Westminster is 1,118 to 1. The number of registered sex offenders compared to the number of residents in Anaheim is near to than in Westminster.
Cost of Living
One of the significant contrasts between the two cities is the cost of living. Anaheim is generally more expensive to live in compared to Westminster. The housing cost and general goods & services are higher in Anaheim, largely due to its status as a major tourist city and home to attractions such as Disneyland.
Income Tax
California applies a state income tax, so residents in both Anaheim and Westminster face the same rates, which vary from 1% to 13.3% based on income brackets.
Property Tax
While the property tax rates are similar in both cities, homeowners in Anaheim tend to pay more due to generally higher house prices.
Sales Tax
The base sales tax in both Anaheim and Westminster is the same due to California's statewide tax. However, Anaheim has a higher additional district tax due to the revenue required to facilitate its expansive infrastructure and tourist areas.
Income
Type
Anaheim
Westminster
Estimated median household income
$81,747
$66,862
Estimated per capita income
$32,827
$34,044
Cost of living index (U.S. average is 100)
88.5
90.5
If you make $50,000 in Anaheim, you will have to make $51,130 in Westminster to maintain the same standard of living.
Geographical Conditions
Both cities are situated in Orange County; however, Anaheim is closer to the Santa Ana Mountains, which offers scenic views and hiking trails. Westminster is flatter and located closer to the coastline.
Both cities have access to quality education. Westminster is known for its robust K-12 public school system under the Huntington Beach Union High School District and Westminster School District. Anaheim, on the other hand, offers diverse educational opportunities ranging from public, private, and charter schools, and home to institutions like Anaheim University.
The two cities significantly differ in their economy. Anaheim's economy is driven by tourism, with the city hosting Disney Land, extensive convention centers and sports arenas. In contrast, Westminster leans heavily on public services, retail trade, manufacturing and healthcare sectors for its economy.
Biggest Employers
Dealing with the largest employers, Disneyland Resort reigns supreme in Anaheim, followed by Anaheim Regional Medical Center and Hilton Anaheim. Westminster's biggest employers include Westminster School District, Ito Farms, and Kindred Hospital Westminster.
There were 85 building permits issued in Anaheim in 2012 (44 more than in 2011) compared to 119 building permits issued in Westminster in 2012 (110 more than in 2011).
Weather
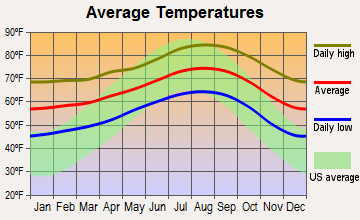
As California cities, Anaheim and Westminster share similar weather patterns. They both enjoy a Mediterranean climate, characterized by hot summers and cool winters. Anaheim tends to be slightly warmer compared to Westminster due to its inland location. In both cities, residents and tourists can enjoy the beautiful California sunshine almost year round.
Weather and climate
Type
Anaheim
Westminster
Temperature - Average
64.9°F
65.3°F
Humidity - Average morning or afternoon humidity
69.6%
70.2%
Humidity - Differences between morning and afternoon humidity
25.9%
26.8%
Humidity - Maximum monthly morning or afternoon humidity
77.9%
78.8%
Humidity - Minimum monthly morning or afternoon humidity
52%
52%
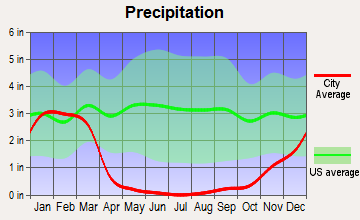
Precipitation - Yearly average
12 in
13 in
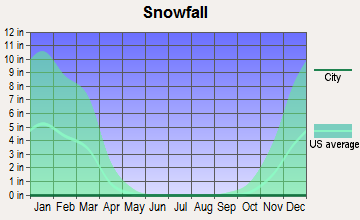
Snowfall - Yearly average
0 in
0 in
Clouds - Number of days clear of clouds
26.6%
26.5%
Sunshine amount - Average
78.4%
78.4%
Sunshine amount - Differences during a year
22%
22%
Sunshine amount - Maximum monthly
84.9%
84.9%
Sunshine amount - Minimum monthly
63%
63%
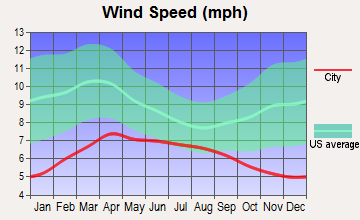
Wind speed - Average
5.7 mph
6 mph
Average climate in Anaheim, California
Average climate in Westminster, California
Air pollution
Type
AQI
CO
NO2
OZONE
PB
PM10
PM25
SO2
Year
Anaheim
Westminster
Anaheim
Westminster
Anaheim
Westminster
Anaheim
Westminster
Anaheim
Westminster
Anaheim
Westminster
Anaheim
Westminster
Anaheim
Westminster
2018
139
119
0.36
0.35
13.7
14.2
26.8
26.2
0.007
N/A
27.5
27.5
12.1
12.5
0.7
0.7
2017
145
116
0.50
0.39
14.8
14.3
26.7
27.8
0.007
N/A
26.7
26.7
13.5
13.7
0.6
0.5
2016
132
102
0.57
0.40
14.5
13.4
26.3
27.9
0.007
N/A
24.1
24.1
12.9
12.6
0.3
0.3
2015
142
106
0.45
0.36
14.7
14.2
26.0
28.2
0.007
N/A
25.0
25.0
14.8
14.6
0.3
0.3
2014
138
110
0.40
0.33
15.0
14.0
26.7
27.5
0.008
N/A
26.7
26.7
16.2
15.7
0.5
0.5
2013
138
107
0.47
0.39
14.8
14.8
25.3
26.7
0.005
0.003
28.3
29.1
13.9
14.1
0.5
0.4
2012
142
103
0.46
0.37
14.5
14.0
25.0
26.0
0.005
0.004
27.0
27.8
14.7
14.4
0.2
0.2
2011
138
109
0.42
0.36
15.9
15.7
26.7
26.4
0.007
0.006
27.4
27.6
16.0
15.9
0.8
0.7
2010
130
102
0.44
0.38
16.7
15.7
25.8
25.5
0.009
0.011
23.5
23.6
14.9
14.3
0.6
0.6
2009
151
118
0.41
0.39
18.0
17.0
26.0
26.6
0.010
0.010
24.4
24.4
15.4
14.7
1.1
1.1
2008
156
124
0.38
0.41
20.3
18.4
26.7
27.0
0.010
0.010
30.2
29.8
18.9
21.6
1.1
1.1
2007
135
100
0.38
0.39
19.5
18.0
26.2
26.1
0.012
0.012
N/A
N/A
N/A
N/A
0.8
0.8
2006
128
114
0.43
0.44
19.1
18.7
26.3
26.0
0.008
0.007
N/A
N/A
N/A
N/A
1.3
1.3
2005
128
95
0.45
0.44
20.7
19.7
31.3
27.5
0.013
0.012
N/A
N/A
N/A
N/A
1.3
1.3
2004
134
119
0.53
0.52
19.9
20.8
37.1
30.8
0.015
0.014
N/A
N/A
N/A
N/A
1.6
1.6
2003
143
122
0.69
0.68
23.7
23.5
23.8
26.2
0.025
0.029
N/A
N/A
N/A
N/A
1.1
1.0
2002
134
107
0.77
0.71
24.1
23.8
21.8
23.8
0.019
0.017
N/A
N/A
N/A
N/A
2.1
1.9
2001
143
118
0.94
0.80
28.4
24.7
24.5
23.9
0.035
0.031
N/A
N/A
N/A
N/A
1.7
1.8
2000
152
125
0.80
0.81
29.4
27.0
23.0
22.9
0.030
0.028
N/A
N/A
N/A
N/A
1.9
1.9
Natural disasters
Type
Anaheim
Westminster
Tornado activity compared to U.S. average
19.3%
18.9%
Earthquake activity compared to U.S. average
7,039.7%
6,892.4%
Natural disasters compared to U.S. average
32%
32%
Transportation
Anaheim has a well-developed public transportation network, including buses, light rail, and shuttles – ideal for navigating tourists and residents alike. Westminster offers reliable public transit; however, with less range due to its smaller size. Commuting by car is popular in both cities.
Transport
Type
Anaheim
Westminster
Amtrak stations
1
0
Amtrak stations nearby
3
3
FAA registered aircraft
136
21
FAA registered aircraft manufacturers and dealers
3
3
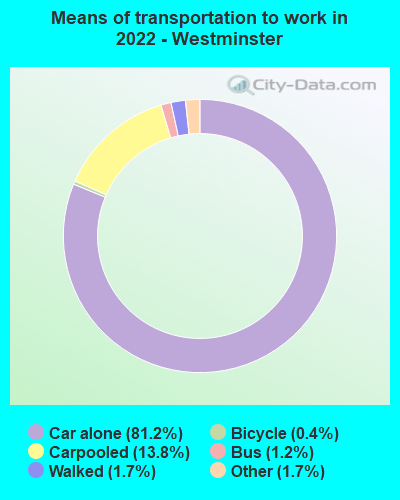
Means of transportation to work
Type
Anaheim
Westminster
Bicycle
1%
0.6%
Bus
0.9%
1.2%
Carpooled
10.8%
12.3%
Car alone
83.4%
82.9%
Motorcycle
0.2%
0.2%
Railroad
0.2%
0%
Subway
0.3%
0%
Walked
1.6%
1.6%
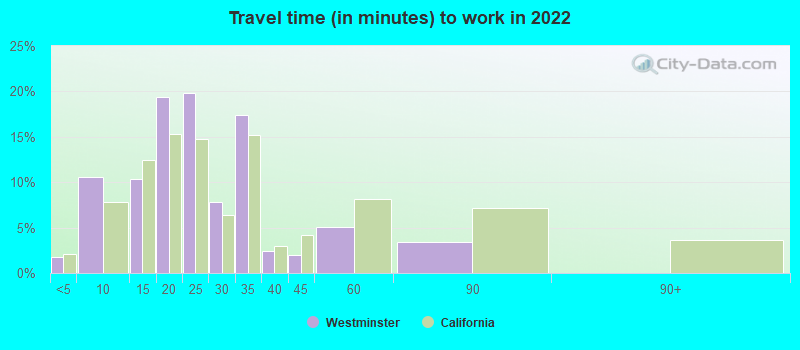
Average travel time to work
Type
Anaheim
Westminster
Average
30.8 min
25.9 min
Other means
28.1 min
28.8 min
Public transportation
47.8 min
40.6 min
Private vehicle occupancy
Type
Anaheim
Westminster
Average
1.2
1.3
Drove alone
85.3%
79.2%
In 2 person carpool
11.2%
14.3%
In 3 person carpool
1.8%
4.1%
In 4 person carpool
0.8%
1.4%
In 5-6 person carpool
0.9%
1%
How many people usually rode to work in the car, truck or van.
Real Estate
Anaheim's real-estate market is more volatile than Westminster's, with higher prices and sales due to its popular location. On the other hand, Westminster's real estate market is more stable and affordable, with steady price appreciation, making it favorable for potential homeowners looking for long-term investment.
Neighborhoods
Anaheim, being larger, provides an array of neighborhoods from urban high-density to more suburban-style options. Tourists and Disneyland visitors often flock to the Anaheim Resort area. Westminster offers a cozier, more residential feel with close-knit, multicultural communities, notably its well-known Little Saigon neighborhood.
Houses and residents
Type
Anaheim
Westminster
Houses
110,319
29,012
Average household size (people)
3.4
3.4
Median year apartment built
1975
1974
Median year house/condo built
1970
1966
Length of stay in the house since moving in
14.8 years
16.8 years
Houses occupied
105,608 (95.7%)
27,935 (96.3%)
Houses occupied by owners
51,684 (48.9%)
13,512 (48.4%)
Houses occupied by renters
53,924 (51.1%)
14,423 (51.6%)
Median rent asked for vacant for-rent units
$2,111
$2,156
Median monthly housing costs
$1,910
$1,726
Median price asked for vacant for-sale houses and condos
$1,256,069
$595,517
Estimated median house or condo value
$688,400
$762,300
Median numbers of rooms
4.7
4.9
Median number of rooms in apartments
3.6
4.1
Median number of rooms in houses and condos
6.1
5.9
Median house price - detached houses
$859,592
$820,163
Median house price - in 2-unit structures
$742,035
Over $1,000,000
Median house price - in 3-to-4-unit structures
$546,946
$642,459
Median house price - in 5 or more unit structures
$553,561
Over $1,000,000
Median house price - mobile homes
$114,904
$107,825
Median house price - Townhouses or other attached units
$619,623
$622,167
Median house price - All housing units
$782,600
$727,246
Median house age
48
51
Renting percentage
51.5%
42.2%
Housing density (houses/condos per square mile)
2,254.1
2,869.5
House value disparities
20.2%
21.9%
Household income disparities
43.6%
50%
Median household income for houses/condes with a mortgage
$125,169
$124,029
Median household income for apartments without a mortgage
$86,779
$79,699
Housing units without a mortgage
374 (1%)
158 (2%)
Housing units with both a second mortgage and home equity loan
2,222 (6%)
559 (6.9%)
Housing units with a mortgage
36,875 (99%)
7,902 (98%)
Housing units with a home equity loan
0 (0%)
91 (1.1%)
Housing units with a second mortgage
2,794 (7.5%)
747 (9.3%)
House/condo owner moved in on average (years ago)
14
18
House/condo renter moved in on average (years ago)
4
4
Housing units lacking complete kitchen facilities
4.5%
3.7%
Housing units lacking complete plumbing facilities
0.1%
0.6%
Housing units in structures
Housing units in structures
Anaheim
Westminster
One, detached
42.7%
55.0%
One, attached
8.3%
6.3%
Two
2.3%
1.7%
3 or 4
7.6%
6.5%
5 to 9
6.8%
4.1%
10 to 19
5.5%
3.0%
20 to 49
6.8%
3.9%
50 or more
17.2%
7.6%
Mobile homes
2.6%
11.9%
Boats, RVs, vans, etc.
0.1%
0.0%
Median real estate property taxes paid for housing units
Self-employed workers in own not incorporated business
11,077
2,842
State government workers
5,046
1,165
Unpaid family workers
65
0
Industries and Occupations
The major industries in Anaheim are the tourism, entertainment and hospitality industry, while in Westminster, it's healthcare, retail trade and public administration. For occupations, Westminster has a high number of sales, office, service, and management roles. Anaheim also offers opportunities in service and sales, but the hospitality and entertainment sectors offer a variety of roles unique to the city.
Health diagnosing and treating practitioners and other technical occupations
4.2%
6.4%
Building and grounds cleaning and maintenance occupations
4.2%
1.4%
Health technologists and technicians
3.6%
1.3%
Community and social service occupations
2.2%
1.6%
Material moving occupations
2.0%
0.4%
Computer and mathematical occupations
1.4%
1.6%
Life, physical, and social science occupations
1.3%
3.4%
Arts, design, entertainment, sports, and media occupations
1.3%
2.7%
Health Care
Anaheim boasts an array of high-quality healthcare facilities including the notable Anaheim Regional Medical Center. Westminster offers reliable medical services and has easy access to other top Orange County healthcare providers due to its location.
Anaheim offers more developed infrastructure due to the large number of tourists it draws annually. It boasts high-quality roads, international airports, convention centers, and arenas. Westminster, while not as flashy, provides a solid infrastructure for a suburb, with reliable utilities, roads, and public spaces.
HMDA - Conventional home purchase loans - Applications denied
Year
Anaheim
Westminster
1999
914
303
2000
679
304
2001
632
240
2002
735
274
2003
1,047
270
2004
1,456
350
2005
1,965
429
2006
1,999
459
2007
1,230
292
2008
599
134
2009
378
91
Culture and Food
Both cities boast diverse cultures. Anaheim has many events, entertainment options, and cuisines thanks to its tourist industry. Westminster revolves around its Vietnamese heritage, meaning you'll find the best Pho outside Vietnam!
Sports Teams
Anaheim is home to major sports teams like the Anaheim Ducks (NHL) and the Los Angeles Angels (MLB). Westminster does not host any professional sports teams but has a vibrant local sports culture.
 Anaheim, CA
 Westminster, CA