When considering relocation or a visit to Southern California, both Anaheim and Whittier offer distinct experiences, influenced by factors ranging from crime rates and cost of living, to cultural offerings and geographical conditions. This comparison will provide comprehensive insight into life in both cities, guiding you to determine which city meets your personal or touristic preferences.
Distance between
Anaheim, CA and
Whittier, CA : 11.8 miles
Anaheim's population is larger by 306%. Its population has grown by 17,926 people (5.5%) since 2000. The population of Whittier has grown by 1,631 people (1.9%) during that time.
Anaheim, being a larger city with a population of approximately 350,000, has a slightly higher crime rate than Whittier, which has a population of around 85,000. However, crime rates in both cities are largely dependent on neighborhood location, with some areas boasting lower crime rates than the national average. It's recommended for potential residents or tourists to research neighborhood crime rates before making housing or accommodation decisions.
City-data.com crime index counts serious crimes and violent crime more heavily. It adjusts for the number of visitors and daily workers commuting into cities. (higher means more crime, U.S. average = 301.1)
City-data.com crime index counts serious crimes and violent crime more heavily. It adjusts for the number of visitors and daily workers commuting into cities. (higher means more crime, U.S. average = 301.1)
Sex Offenders
According to our data, there are 371 registered sex offenders living in Anaheim and 205 registered sex offenders living in . The ratio of residents to sex offenders in Anaheim is 946 to 1; the ratio in Whittier is 424 to 1. The number of registered sex offenders compared to the number of residents is a smaller in Anaheim than in Whittier.
Cost of Living
Generally, the cost of living treads higher in Anaheim compared to Whittier. This can be attributed to Anaheim’s touristic appeal, including Disneyland Resort and a host of sporting facilities. Whittier, being a smaller, more residential city, offers a more laid-back lifestyle with a lower cost of living, making it a more feasible option for families or individuals on a budget.
Income Tax
Both cities follow California's progressive income tax system, which ranges from 1% to 13.3% dependent on income. As state taxes, these rates apply uniformly to all residents regardless of city.
Property Tax
Property taxes in Anaheim and Whittier are also determined by state law, with the current rate for California being 1% of assessed home value. Property taxes can vary based on local municipal and county levies.
Sales Tax
The sales tax rate for both cities is relatively high, reflecting California’s overall sales tax rate. Anaheim imposes a tax rate of 7.75%, while Whittier's is slightly higher at 10.25%.
Income
Type
Anaheim
Whittier
Estimated median household income
$81,747
$84,320
Estimated per capita income
$32,827
$40,248
Cost of living index (U.S. average is 100)
88.5
138.9
If you make $50,000 in Anaheim, you will have to make $78,475 in Whittier to maintain the same standard of living.
Geographical Conditions
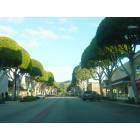
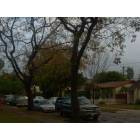
Anaheim is located in the Los Angeles metropolitan area and closer to the coast, characterized by flat lowlands and some hilly sections. Whittier, situated more inland, features more varied terrain with notable areas like the Whittier Hills and Puente Hills.
Both cities provide quality education with numerous public and private schools. Anaheim is home to the North Orange County Community College District, while Whittier boasts Whittier College, a private liberal arts institution. The presence of these institutions expands educational opportunities for residents while also attracting a student population to each city.
Given its size and touristic fame, Anaheim has a diverse economy with industries such as hospitality, entertainment, manufacturing, and retail providing employment. Conversely, Whittier's economy is smaller and more localized, with healthcare, retail, and education sectors dominating the job market. The city is also home to various small businesses, fostering a close-knit community feel.
Biggest Employers
Not surprisingly, Disneyland Resort is the largest employer in Anaheim, followed by companies such as Kaiser Foundation Hospital and Northgate Gonzalez Markets. In Whittier, PIH Health Hospital-Whittier, Whittier Union High School District, and Whittier College lead the list of top employers.
There were 85 building permits issued in Anaheim in 2012 (44 more than in 2011) compared to 189 building permits issued in Whittier in 2012 (178 more than in 2011).
In Anaheim (Orange County), 45.8% voted for Democrats and 52.0% for Republicans in 2012 Presidential Election. In Whittier (Los Angeles County), 69.7% voted for Democrats and 27.8% for Republicans.
Elections
Type
Democrats
Republicans
Other
Year
Anaheim
Whittier
Anaheim
Whittier
Anaheim
Whittier
2020
53.6%
71.0%
44.6%
26.9%
1.8%
2.1%
2016
50.9%
72.0%
42.4%
22.5%
6.7%
5.5%
2012
45.8%
69.7%
52.0%
27.8%
2.3%
2.4%
2008
47.8%
69.2%
50.3%
28.8%
1.9%
1.9%
2004
39.3%
63.3%
60.2%
35.7%
0.5%
1.0%
2000
40.4%
63.6%
55.9%
32.4%
3.7%
4.0%
1996
37.9%
59.3%
51.7%
31.0%
10.5%
9.7%
Breakdown of population affiliated with a religious congregation
Type
Adherents
Congregations
Religion
Anaheim
Whittier
Anaheim
Whittier
CATHOLIC CHURCH
26.5%
36.1%
4.4%
4.7%
SOUTHERN BAPTIST CONVENTION
2.3%
1.0%
8.8%
9.0%
MUSLIM ESTIMATE
0.8%
0.7%
1.3%
1.0%
LUTHERAN CHURCH
0.6%
0.2%
2.0%
1.6%
EPISCOPAL CHURCH
0.4%
0.4%
1.4%
1.4%
EVANGELICAL LUTHERAN CHURCH IN AMERICA
0.4%
0.2%
2.3%
1.9%
SEVENTH DAY ADVENTIST CHURCH
0.4%
0.5%
1.3%
2.4%
REFORMED CHURCH IN AMERICA
0.3%
0.1%
0.2%
0.2%
AMERICAN BAPTIST CHURCHES IN THE USA
0.2%
0.5%
1.7%
3.1%
Weather
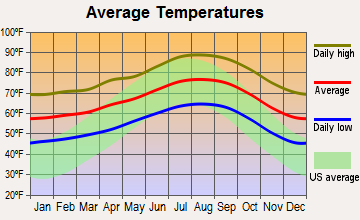
The weather in Anaheim and Whittier is typically Southern Californian - warm summers and mild winters. Anaheim, located closer to the coast, experiences a Mediterranean climate, often cooler in summer and warmer in winter compared to Whittier. However, the differences are relatively minor and both cities boast approximately 280 days of sunshine per year, making either city appealing for sun-seekers.
Weather and climate
Type
Anaheim
Whittier
Temperature - Average
64.9°F
66.8°F
Humidity - Average morning or afternoon humidity
69.6%
65.2%
Humidity - Differences between morning and afternoon humidity
25.9%
20.2%
Humidity - Maximum monthly morning or afternoon humidity
77.9%
71.5%
Humidity - Minimum monthly morning or afternoon humidity
52%
51.3%
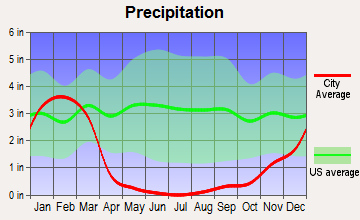
Precipitation - Yearly average
12 in
14.7 in
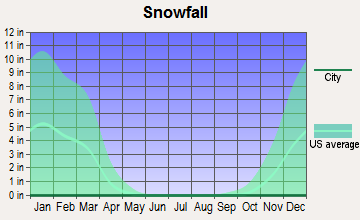
Snowfall - Yearly average
0 in
0 in
Clouds - Number of days clear of clouds
26.6%
28%
Sunshine amount - Average
78.4%
78.4%
Sunshine amount - Differences during a year
22%
22%
Sunshine amount - Maximum monthly
84.9%
85%
Sunshine amount - Minimum monthly
63%
63%
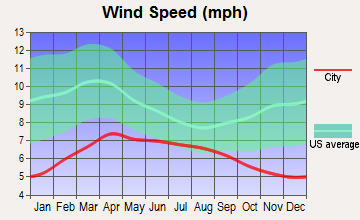
Wind speed - Average
5.7 mph
3.9 mph
Average climate in Anaheim, California
Average climate in Whittier, California
Air pollution
Type
AQI
CO
NO2
OZONE
PB
PM10
PM25
SO2
Year
Anaheim
Whittier
Anaheim
Whittier
Anaheim
Whittier
Anaheim
Whittier
Anaheim
Whittier
Anaheim
Whittier
Anaheim
Whittier
Anaheim
Whittier
2018
139
142
0.36
0.34
13.7
13.8
26.8
26.0
0.007
0.007
27.5
27.8
12.1
13.6
0.7
0.5
2017
145
146
0.50
0.36
14.8
14.9
26.7
26.9
0.007
0.007
26.7
29.1
13.5
14.2
0.6
0.6
2016
132
136
0.57
0.36
14.5
15.0
26.3
26.3
0.007
0.007
24.1
26.0
12.9
13.2
0.3
0.5
2015
142
144
0.45
0.37
14.7
15.4
26.0
26.7
0.007
0.006
25.0
26.5
14.8
15.1
0.3
0.4
2014
138
141
0.40
0.36
15.0
15.9
26.7
25.8
0.008
0.007
26.7
28.7
16.2
15.8
0.5
0.5
2013
138
144
0.47
0.40
14.8
16.7
25.3
24.7
0.005
0.006
28.3
29.4
13.9
14.7
0.5
0.5
2012
142
148
0.46
0.43
14.5
17.3
25.0
24.7
0.005
0.006
27.0
28.5
14.7
15.8
0.2
0.4
2011
138
146
0.42
0.44
15.9
18.0
26.7
24.5
0.007
0.008
27.4
28.6
16.0
16.8
0.8
0.6
2010
130
133
0.44
0.48
16.7
18.9
25.8
23.9
0.009
0.014
23.5
26.2
14.9
15.0
0.6
0.6
2009
151
153
0.41
0.49
18.0
20.5
26.0
24.7
0.010
0.010
24.4
29.7
15.4
16.3
1.1
0.8
2008
156
154
0.38
0.53
20.3
22.0
26.7
23.8
0.010
0.012
30.2
31.8
18.9
17.9
1.1
0.8
2007
135
135
0.38
0.54
19.5
22.6
26.2
23.4
0.012
0.014
N/A
N/A
N/A
N/A
0.8
1.2
2006
128
129
0.43
0.59
19.1
23.4
26.3
24.0
0.008
0.009
N/A
N/A
N/A
N/A
1.3
1.6
2005
128
128
0.45
0.60
20.7
25.4
31.3
20.5
0.013
0.014
N/A
N/A
N/A
N/A
1.3
2.3
2004
134
135
0.53
0.69
19.9
27.3
37.1
22.4
0.015
0.017
N/A
N/A
N/A
N/A
1.6
2.2
2003
143
140
0.69
0.85
23.7
31.0
23.8
21.1
0.025
0.025
N/A
N/A
N/A
N/A
1.1
1.4
2002
134
137
0.77
0.87
24.1
31.0
21.8
19.7
0.019
0.022
N/A
N/A
N/A
N/A
2.1
2.3
2001
143
143
0.94
0.97
28.4
32.2
24.5
18.2
0.035
0.037
N/A
N/A
N/A
N/A
1.7
2.4
2000
152
153
0.80
1.03
29.4
34.2
23.0
18.8
0.030
0.031
N/A
N/A
N/A
N/A
1.9
1.6
Natural disasters
Type
Anaheim
Whittier
Tornado activity compared to U.S. average
19.3%
18.9%
Earthquake activity compared to U.S. average
7,039.7%
7,121.4%
Natural disasters compared to U.S. average
32%
57%
Transportation
Both cities offer a solid public transportation system run by the Metro and Orange County Transportation Authority. Traffic can be considerable in both cities, particularly in Anaheim due to tourist influxes. Both cities are also bike-friendly, and have distinct neighborhood characteristics that lend well to walking.
Transport
Type
Anaheim
Whittier
Amtrak stations
1
0
Amtrak stations nearby
3
3
FAA registered aircraft
136
37
FAA registered aircraft manufacturers and dealers
3
0
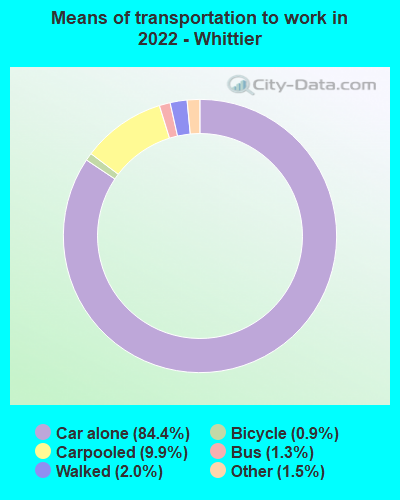
Means of transportation to work
Type
Anaheim
Whittier
Bicycle
1%
1%
Bus
0.9%
1.3%
Carpooled
10.8%
10.3%
Car alone
83.4%
84.3%
Motorcycle
0.2%
0.1%
Railroad
0.2%
0%
Subway
0.3%
0%
Walked
1.6%
2.2%
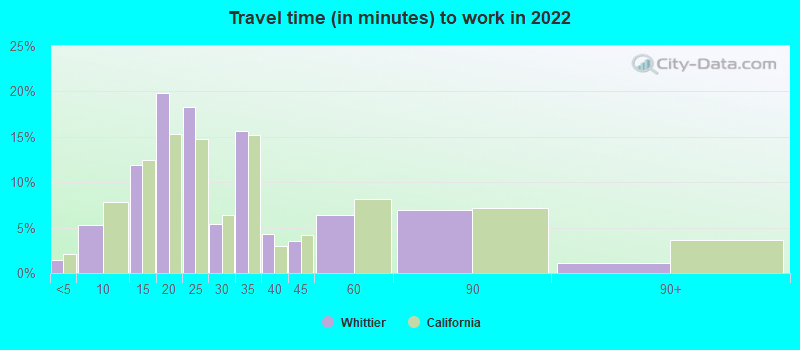
Average travel time to work
Type
Anaheim
Whittier
Average
30.8 min
28.1 min
Other means
28.1 min
30.9 min
Public transportation
47.8 min
54.2 min
Private vehicle occupancy
Type
Anaheim
Whittier
Average
1.2
1.2
Drove alone
85.3%
89%
In 2 person carpool
11.2%
8.1%
In 3 person carpool
1.8%
2.3%
In 4 person carpool
0.8%
0.2%
In 5-6 person carpool
0.9%
0.3%
How many people usually rode to work in the car, truck or van.
Real Estate
Real estate in Anaheim is markedly more expensive, reflecting its popularity as a tourist destination and larger urban area. Whittier, on the other hand, has a lower average home price, making it a feasible option for those prioritizing affordability in their housing search.
Neighborhoods
Anaheim presents a mix of urban and suburban neighborhoods, with notable ones including Anaheim Hills and the Platinum Triangle. Whittier encompasses more residential and historic neighborhoods like Uptown Whittier and Friendly Hills, offering a more tranquil, community-centered lifestyle.
Houses and residents
Type
Anaheim
Whittier
Houses
110,319
28,607
Average household size (people)
3.4
3
Median year apartment built
1975
1960
Median year house/condo built
1970
1955
Length of stay in the house since moving in
14.8 years
16.9 years
Houses occupied
105,608 (95.7%)
27,773 (97.1%)
Houses occupied by owners
51,684 (48.9%)
16,521 (59.5%)
Houses occupied by renters
53,924 (51.1%)
11,252 (40.5%)
Median rent asked for vacant for-rent units
$2,111
$1,375
Median monthly housing costs
$1,910
$1,861
Median price asked for vacant for-sale houses and condos
$1,256,069
$853,666
Estimated median house or condo value
$688,400
$718,300
Median numbers of rooms
4.7
5
Median number of rooms in apartments
3.6
3.8
Median number of rooms in houses and condos
6.1
6
Median house price - detached houses
$859,592
$826,824
Median house price - in 2-unit structures
$742,035
$752,464
Median house price - in 3-to-4-unit structures
$546,946
$864,309
Median house price - in 5 or more unit structures
$553,561
$448,691
Median house price - mobile homes
$114,904
$80,684
Median house price - Townhouses or other attached units
$619,623
$719,734
Median house price - All housing units
$782,600
$814,382
Median house age
48
65
Renting percentage
51.5%
42.7%
Housing density (houses/condos per square mile)
2,254.1
1,955.2
House value disparities
20.2%
17.9%
Household income disparities
43.6%
43.5%
Median household income for houses/condes with a mortgage
$125,169
$147,702
Median household income for apartments without a mortgage
$86,779
$67,172
Housing units without a mortgage
374 (1%)
289 (2.3%)
Housing units with both a second mortgage and home equity loan
2,222 (6%)
1,165 (9.2%)
Housing units with a mortgage
36,875 (99%)
12,353 (97.7%)
Housing units with a home equity loan
0 (0%)
0 (0%)
Housing units with a second mortgage
2,794 (7.5%)
1,414 (11.2%)
House/condo owner moved in on average (years ago)
14
17
House/condo renter moved in on average (years ago)
4
5
Housing units lacking complete kitchen facilities
4.5%
3.1%
Housing units lacking complete plumbing facilities
0.1%
1.3%
Housing units in structures
Housing units in structures
Anaheim
Whittier
One, detached
42.7%
65.2%
One, attached
8.3%
4.5%
Two
2.3%
2.0%
3 or 4
7.6%
7.8%
5 to 9
6.8%
8.1%
10 to 19
5.5%
5.4%
20 to 49
6.8%
4.3%
50 or more
17.2%
2.1%
Mobile homes
2.6%
0.4%
Boats, RVs, vans, etc.
0.1%
0.2%
Median real estate property taxes paid for housing units
Self-employed workers in own not incorporated business
11,077
1,908
State government workers
5,046
1,415
Unpaid family workers
65
241
Industries and Occupations
In Anaheim, the tourism industry leads, employing thousands in roles linked to hospitality and entertainment. There's also a strong presence of manufacturing and retail companies. Meanwhile, in Whittier, healthcare reigns due to the presence of institutions such as the PIH Health Hospital. Education and retail also provide numerous jobs for residents.
Both cities boast excellent healthcare facilities. Anaheim has several state-of-the-art hospitals, including the Kaiser Permanente Anaheim Medical Center, while Whittier is home to the reputable PIH Health Hospital.
Health (county statistics)
Type
Anaheim
Whittier
General health status score of residents in this county from 1 (poor) to 5 (excellent)
Anaheim's infrastructure is robust and well-developed, featuring a plethora of amenities including theme parks, sports arenas, and shopping centers. Whittier, though smaller, is well-structured with a charming downtown area featuring historic buildings, cafes, and boutiques. The city's focus on preserving its historic and cultural heritage lends a unique, intimate charm to its infrastructure.
Infrastructure
Type
Anaheim
Whittier
Hospitals
22
5
TV stations
6
22
Bank branches located here
46
22
Bank institutions located here
19
12
Main business address for public companies
7
1
Drinking water stations with no reported violations in the past
1
1
Drinking water stations with reported violations in the past
HMDA - Conventional home purchase loans - Applications denied
Year
Anaheim
Whittier
1999
914
152
2000
679
141
2001
632
135
2002
735
112
2003
1,047
269
2004
1,456
338
2005
1,965
398
2006
1,999
415
2007
1,230
415
2008
599
122
2009
378
74
Culture and Food
Anaheim offers a vibrant cultural scene, enriched by landmarks like Disneyland and a thriving downtown area. A variety of restaurants serves global cuisines, influenced by diverse demographics. In contrast, Whittier has a more relaxed cultural vibe, reflected in its historic downtown, local eateries, and various community-driven events.
Sports Teams
Anaheim is home to sports teams like the Anaheim Ducks (NHL) and the Los Angeles Angels (MLB). Whittier, being a smaller city, does not host professional sports teams but offers plenty of community sports programs for local participation.


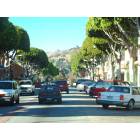


 Anaheim, CA
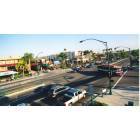
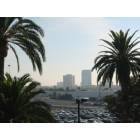
 Whittier, CA