A comparison between Arlington, Texas, and Plano, Texas, reveals distinctions in various areas including crime rates, weather patterns, cost of living, education, and economic activities. These distinctions influence both residents looking to relocate and tourists wanting to visit either or both cities. Factors such as infrastructure, employment opportunities, cultural exposure, sports teams, and healthcare services are considered vital for both categories of people. Join us as we unearth the diverse facets of Arlington and Plano, providing insights to help decision-making for possible relocation or touristic visitation.
Distance between
Arlington, TX and
Plano, TX : 32.4 miles
Arlington's population is larger by 36%. Its population has grown by 59,817 people (18.0%) since 2000. The population of Plano has grown by 66,223 people (29.8%) during that time.
Safety generally differs between Arlington and Plano. According to the FBI, Plano has a lower crime rate compared to Arlington. Thus, Plano would present a safer environment for both residents and tourists. However, both cities have dedicated law enforcement agencies that continuously strive to maintain law and order and ensure safety in the respective communities.
City-data.com crime index counts serious crimes and violent crime more heavily. It adjusts for the number of visitors and daily workers commuting into cities. (higher means more crime, U.S. average = 301.1)
City-data.com crime index counts serious crimes and violent crime more heavily. It adjusts for the number of visitors and daily workers commuting into cities. (higher means more crime, U.S. average = 301.1)
Sex Offenders
According to our data, there are 594 registered sex offenders living in Arlington and 134 registered sex offenders living in . The ratio of residents to sex offenders in Arlington is 661 to 1; the ratio in Plano is 2,135 to 1. The number of registered sex offenders compared to the number of residents is much larger in Arlington than that in Plano.
Cost of Living
In terms of cost of living, Plano is slightly more expensive than Arlington. This difference is mainly seen in housing costs and transportation. While relocation could be a bit costly in Plano, visitors spending a short period might not feel the pinch as much.
Income Tax
Texas is one of the few states where residents do not pay personal state income tax. Therefore, income taxation would not be a differentiating factor for residents or visitors in either Arlington or Plano.
Property Tax
On average, property tax rates are higher in Plano compared to Arlington. This forms an important monetary consideration for potential homeowners when deciding between the two cities.
Sales Tax
Both cities are located within Texas and share a similar taxation structure with no state income tax and a city sales tax rate of 1.75%. Therefore, the tax burden would be relatively equal in Arlington and Plano.
Income
Type
Arlington
Plano
Estimated median household income
$59,889
$95,002
Estimated per capita income
$31,722
$49,792
Cost of living index (U.S. average is 100)
95.9
96.2
If you make $50,000 in Arlington, you will have to make $50,156 in Plano to maintain the same standard of living.
Geographical Conditions
Both Arlington and Plano are part of the broader Dallas-Fort Worth metroplex and are characterized by flat terrains. Arlington is closer to several lakes and parks, offering plenty of outdoor recreational activities.
Both cities are served by well-established public school districts and host campuses for higher education. However, Plano Independent School District is often rated higher than Arlington’s school district, making it more appealing to families with school-going children. For higher education, both cities offer quality institutions such as the University of Texas at Arlington and Collin College in Plano.
Plano and Arlington's economies are both vibrant and diverse. Arlington's economy benefits from its proximity to Dallas and Fort Worth, making it a suitable living and working environment. On the other hand, Plano's rising technology and corporate sector provides substantial job opportunities.
Biggest Employers
Major employers in Arlington include the Arlington Independent School District, the University of Texas at Arlington, and the Texas Health Resources. In contrast, Plano hosts headquarters of renowned corporations like Capital One Finance, Toyota Motor North America, and Liberty Mutual Insurance.
There were 976 building permits issued in Arlington in 2012 (744 more than in 2011) compared to 321 building permits issued in Plano in 2012 (28 less than in 2011).
In Arlington (Tarrant County), 41.4% voted for Democrats and 57.1% for Republicans in 2012 Presidential Election. In Plano (Collin County), 33.6% voted for Democrats and 65.2% for Republicans.
Elections
Type
Democrats
Republicans
Other
Year
Arlington
Plano
Arlington
Plano
Arlington
Plano
2020
49.3%
47.1%
49.1%
51.4%
1.6%
1.5%
2016
43.2%
39.0%
51.8%
55.7%
5.0%
5.4%
2012
41.4%
33.6%
57.1%
65.2%
1.4%
1.2%
2008
43.8%
36.7%
55.5%
62.3%
0.7%
1.0%
2004
37.0%
28.2%
62.5%
71.3%
0.5%
0.6%
2000
36.9%
24.5%
60.9%
73.2%
2.3%
2.3%
1996
41.6%
28.5%
50.9%
63.0%
7.5%
8.5%
Breakdown of population affiliated with a religious congregation
Type
Adherents
Congregations
Religion
Arlington
Plano
Arlington
Plano
SOUTHERN BAPTIST CONVENTION
17.3%
10.1%
33.3%
29.1%
CATHOLIC CHURCH
11.1%
14.2%
1.9%
1.6%
MUSLIM ESTIMATE
2.2%
2.9%
0.9%
1.9%
LUTHERAN CHURCH
0.5%
0.8%
0.9%
1.4%
SEVENTH DAY ADVENTIST CHURCH
0.4%
0.1%
1.6%
0.8%
EPISCOPAL CHURCH
0.3%
0.2%
0.8%
1.0%
EVANGELICAL LUTHERAN CHURCH IN AMERICA
0.3%
0.3%
0.9%
1.0%
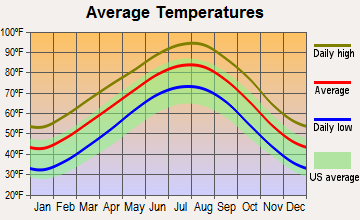
Weather
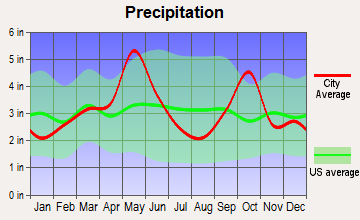
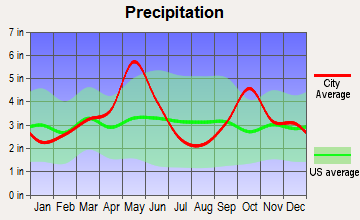
The weather in both Arlington and Plano is similarly characterized by hot, humid summers and generally mild to cool winters. Plano, however, experiences a slightly higher average annual precipitation compared to Arlington. Therefore, if you enjoy a warmer climate, both cities will be suitable for you.
Weather and climate
Type
Arlington
Plano
Temperature - Average
65°F
64.2°F
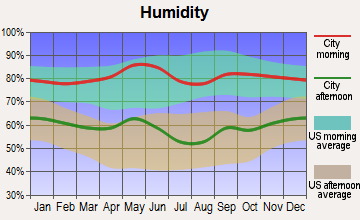
Humidity - Average morning or afternoon humidity
71.4%
71.3%
Humidity - Differences between morning and afternoon humidity
34%
34%
Humidity - Maximum monthly morning or afternoon humidity
82%
82%
Humidity - Minimum monthly morning or afternoon humidity
48%
48%
Precipitation - Yearly average
37.9 in
40.2 in
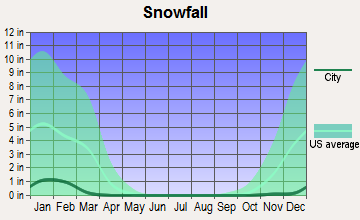
Snowfall - Yearly average
4.2 in
4.2 in
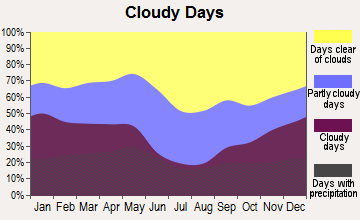
Clouds - Number of days clear of clouds
22.7%
22.8%
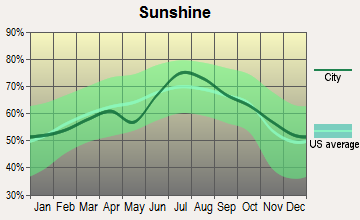
Sunshine amount - Average
66.6%
66.6%
Sunshine amount - Differences during a year
20%
20%
Sunshine amount - Maximum monthly
74%
74%
Sunshine amount - Minimum monthly
54%
54%
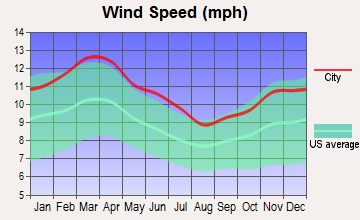
Wind speed - Average
10.3 mph
10.3 mph
Average climate in Arlington, Texas
Average climate in Plano, Texas
Air pollution
Type
AQI
CO
NO2
OZONE
PB
PM25
SO2
Year
Arlington
Plano
Arlington
Arlington
Plano
Arlington
Plano
Plano
Arlington
Plano
Arlington
Plano
2018
86
85
N/A
N/A
5.8
5.8
27.1
30.1
N/A
N/A
9.4
9.7
0.4
0.4
2017
86
84
N/A
N/A
6.2
5.8
27.2
31.4
N/A
N/A
9.1
9.1
0.3
0.3
2016
76
77
N/A
N/A
6.3
6.4
25.5
29.9
N/A
N/A
8.2
8.4
0.2
0.2
2015
80
84
N/A
N/A
6.5
7.2
24.8
30.0
N/A
N/A
8.6
8.9
0.3
0.3
2014
78
83
0.22
N/A
6.8
6.1
26.6
30.9
N/A
N/A
9.3
9.9
0.3
0.3
2013
96
95
0.25
N/A
6.4
7.0
27.2
32.2
N/A
N/A
11.0
13.0
0.2
0.2
2012
108
112
0.26
N/A
7.8
8.5
30.3
34.3
N/A
N/A
10.5
12.0
0.3
0.3
2011
96
98
0.23
N/A
8.2
9.1
30.7
33.9
N/A
N/A
9.5
11.9
0.6
0.6
2010
76
78
0.23
N/A
8.9
9.7
27.7
30.8
N/A
N/A
8.4
N/A
0.7
0.7
2009
91
86
0.25
N/A
8.7
9.6
29.5
31.5
N/A
N/A
8.5
N/A
0.5
0.5
2008
92
82
0.25
N/A
9.6
9.9
25.8
32.3
0.121
N/A
10.7
N/A
0.5
0.5
2007
95
89
0.30
N/A
10.6
10.3
24.6
29.7
0.070
N/A
9.8
N/A
0.5
0.3
2006
102
103
0.34
N/A
10.4
10.5
29.7
33.7
0.106
N/A
9.9
N/A
0.8
0.7
2005
110
105
0.34
N/A
11.7
13.2
28.4
32.6
0.142
N/A
11.3
11.0
1.0
0.9
2004
90
92
0.39
N/A
10.8
11.8
25.4
29.2
0.099
N/A
N/A
N/A
0.9
0.8
2003
97
100
0.40
N/A
11.1
13.9
27.2
30.3
0.121
N/A
N/A
N/A
1.0
1.0
2002
97
96
0.37
N/A
11.8
14.3
25.8
29.1
0.080
N/A
N/A
N/A
0.6
0.4
2001
88
99
0.48
N/A
14.7
12.8
25.0
30.6
0.069
N/A
N/A
N/A
1.1
1.0
2000
104
107
0.55
N/A
14.5
14.5
26.2
31.7
0.092
N/A
N/A
N/A
1.3
1.1
Natural disasters
Type
Arlington
Plano
Tornado activity compared to U.S. average
254.3%
252.9%
Earthquake activity compared to U.S. average
558.3%
596.9%
Natural disasters compared to U.S. average
23%
14%
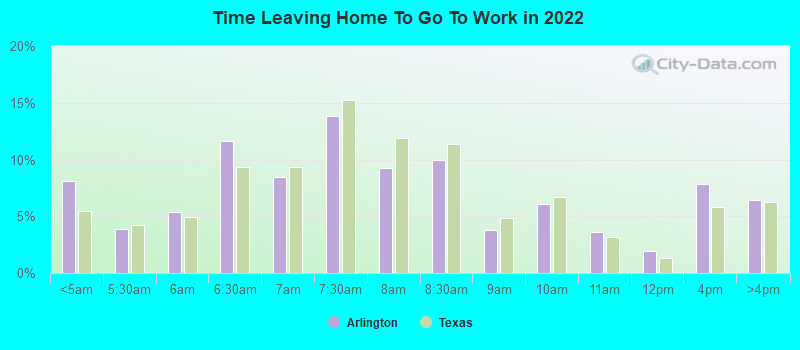
Transportation
Arlington has traditionally been a car-dependent city compared to Plano that offers more public transit options, which can significantly ease commuting. However, both cities are part of the extensive Dallas-Fort Worth transportation network.
Transport
Type
Arlington
Plano
Amtrak stations nearby
2
1
FAA registered aircraft
362
266
FAA registered aircraft manufacturers and dealers
5
11
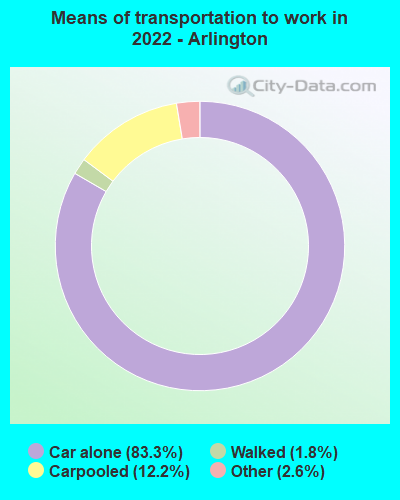
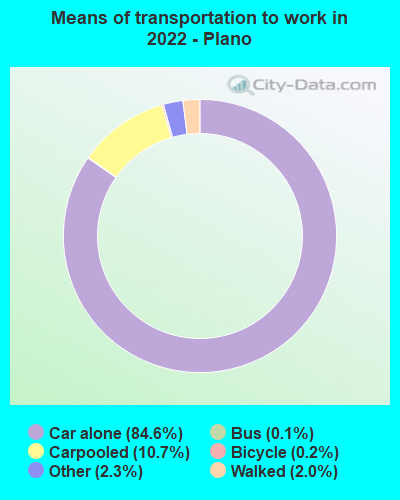
Means of transportation to work
Type
Arlington
Plano
Bicycle
0.2%
0.1%
Bus
0%
0.4%
Carpooled
11.9%
7.8%
Car alone
85%
89.2%
Motorcycle
0.1%
0.1%
Walked
1.4%
1.2%
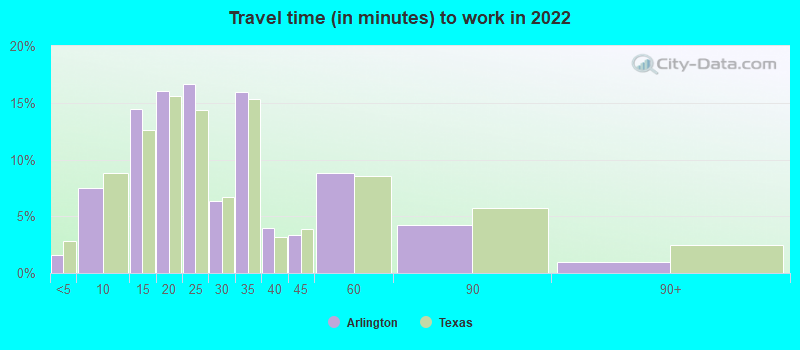
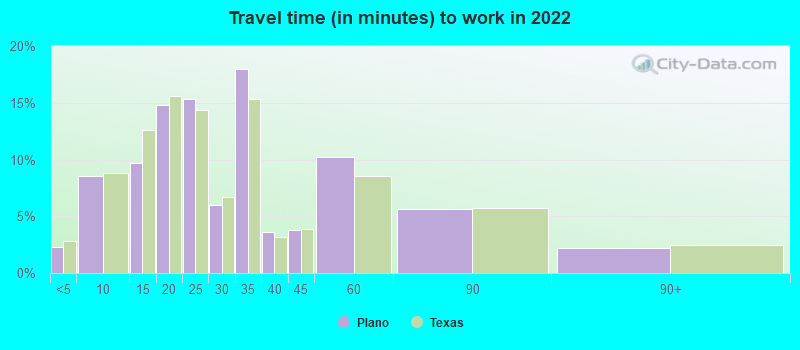
Average travel time to work
Type
Arlington
Plano
Average
26.1 min
28.8 min
Other means
27.6 min
28.4 min
Public transportation
45.1 min
59 min
Private vehicle occupancy
Type
Arlington
Plano
Average
1.2
1.1
Drove alone
88.7%
89.9%
In 2 person carpool
7.8%
8.8%
In 3 person carpool
2.2%
0.8%
In 4 person carpool
0.8%
0.2%
In 5-6 person carpool
0.4%
0.2%
How many people usually rode to work in the car, truck or van.
Real Estate
Both cities offer diverse real estate options, but housing is generally more expensive in Plano. Arlington is more affordable, making it a more attractive option for potential residents on a budget.
Neighborhoods
Arlington is known for its mix of residential, commercial, and industrial neighborhoods. Plano, on the other hand, stands out with its affluent, family-friendly neighborhoods which have been repeatedly recognized for their safety and quality of life.
Houses and residents
Type
Arlington
Plano
Houses
156,653
114,797
Average household size (people)
2.7
2.6
Median year apartment built
1983
1996
Median year house/condo built
1984
1990
Length of stay in the house since moving in
13 years
13 years
Houses occupied
146,888 (93.8%)
108,472 (94.5%)
Houses occupied by owners
78,883 (53.7%)
60,883 (56.1%)
Houses occupied by renters
68,005 (46.3%)
47,589 (43.9%)
Median rent asked for vacant for-rent units
$1,609
$1,491
Median monthly housing costs
$1,220
$1,599
Median price asked for vacant for-sale houses and condos
$199,415
$1,044,402
Estimated median house or condo value
$254,700
$387,200
Median numbers of rooms
5.4
6.1
Median number of rooms in apartments
4.1
4
Median number of rooms in houses and condos
6.5
7.6
Median house price - detached houses
$265,594
$447,315
Median house price - in 2-unit structures
$415,006
$154,744
Median house price - in 3-to-4-unit structures
$224,044
$260,615
Median house price - in 5 or more unit structures
$131,545
$210,357
Median house price - mobile homes
$92,300
$112,806
Median house price - Townhouses or other attached units
$171,140
$325,999
Median house price - All housing units
$259,527
$437,302
Median house age
37
28
Renting percentage
42.6%
37%
Housing density (houses/condos per square mile)
1,634.9
1,604.1
House value disparities
25%
23.4%
Household income disparities
43.9%
41.5%
Median household income for houses/condes with a mortgage
$97,883
$134,911
Median household income for apartments without a mortgage
$67,452
$110,429
Housing units without a mortgage
948 (2%)
744 (2%)
Housing units with both a second mortgage and home equity loan
1,684 (3.6%)
1,681 (4.4%)
Housing units with a mortgage
46,456 (98%)
37,102 (98%)
Housing units with a home equity loan
0 (0%)
86 (0.2%)
Housing units with a second mortgage
1,967 (4.1%)
2,508 (6.6%)
House/condo owner moved in on average (years ago)
13
13
House/condo renter moved in on average (years ago)
1
1
Housing units lacking complete kitchen facilities
1.7%
1.9%
Housing units lacking complete plumbing facilities
1%
0%
Housing units in structures
Housing units in structures
Arlington
Plano
One, detached
60.2%
60.2%
One, attached
10.8%
3.5%
Two
1.5%
0.8%
3 or 4
4.3%
3.0%
5 to 9
5.7%
7.3%
10 to 19
7.7%
9.1%
20 to 49
3.3%
3.2%
50 or more
5.2%
12.1%
Mobile homes
1.3%
0.8%
Boats, RVs, vans, etc.
0.1%
0.0%
Median real estate property taxes paid for housing units
Self-employed workers in own not incorporated business
10,953
7,541
State government workers
6,771
4,098
Unpaid family workers
396
57
Industries and Occupations
Key industries in Arlington include entertainment, education, and healthcare, while Plano's economy is driven by technology, finance, and corporate operations. Both cities offer diverse opportunities for professionals from various backgrounds.
Healthcare facilities are generally very good in both Arlington and Plano. Major hospitals in Arlington include Texas Health Arlington Memorial Hospital and Medical City Arlington, while in Plano, there's the Medical City Plano and Texas Health Presbyterian Hospital.
Arlington boasts numerous cultural and entertainment infrastructures such as the AT&T Stadium and Globe Life Park. Both cities, however, have invested in modern road networks, healthcare facilities, and public utilities that drastically improve the quality of life for residents.
Infrastructure
Type
Arlington
Plano
Hospitals
39
15
TV stations
25
25
Bank branches located here
74
115
Bank institutions located here
23
42
Main business address for public companies
2
17
Drinking water stations with reported violations in the past
HMDA - Conventional home purchase loans - Applications denied
Year
Arlington
Plano
1999
1,768
825
2000
1,198
258
2001
1,140
199
2002
847
204
2003
1,216
655
2004
1,504
921
2005
2,158
1,145
2006
2,107
1,104
2007
1,390
750
2008
558
384
2009
235
213
Culture and Food
Both cities embrace Texan culture with a vibrant food scene, especially noted for barbecue, Tex-Mex cuisine, and traditional American fares. Arlington, however, is home to multiple cultural events and venues including the Arlington Museum of Art and the Levitt Pavilion for Performing Arts.
Sports Teams
For sports enthusiasts, Arlington is home to the Texas Rangers and the Dallas Cowboys while Plano lacks major professional sports teams. Tourists and residents are sure to find numerous sporting events to attend in Arlington.

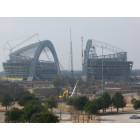


 Arlington, TX
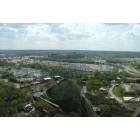
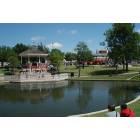
 Plano, TX