Aurora and Southwest Arapahoe are two diverse and lively regions in Colorado, each with their unique characteristics. While Aurora is a large city, known for its multiculturalism, rich history, and robust economy, Southwest Arapahoe represents a comfortable, residential locale within the Denver-Arapahoe metropolitan area. The contrast between these two areas offers residents and tourists alike an array of lifestyle options, activities, and attractions.
Aurora, being a larger city, has a higher crime rate compared to Southwest Arapahoe. While the law enforcement agencies are active and engaged, it's advisable to be aware of one's surroundings and take usual urban precautions. On the other hand, Southwest Arapahoe enjoys a relatively lower crime rate, closer to the national average, making it a safer option for families wishing to settle down.
Cost of Living
The cost of living in Aurora is generally considered to be lower compared to Southwest Arapahoe. Housing tends to be less expensive, which makes for a significant part of this difference. The overall affordability makes Aurora an attractive place for both relocation and tourism.
Income Tax
Both Aurora and Southwest Arapahoe fall under Colorado’s flat income tax rate of 4.63%, which applies to all residents irrespective of their income level.
Property Tax
Property tax rates are slightly higher in Southwest Arapahoe than Aurora. This difference, combined with higher home prices, can make owning a home more expensive in Southwest Arapahoe.
Sales Tax
The total sales tax rate in Aurora is fairly high at 8.5%, whereas in Southwest Arapahoe, it is slightly lower. However, the difference may not overly impact the overall cost of living.
Income
Type
Aurora
Southwest Arapahoe
Estimated median household income
$71,647
$94,400
Estimated per capita income
$35,054
$57,187
Cost of living index (U.S. average is 100)
109.4
113.3
If you make $50,000 in Aurora, you will have to make $51,782 in Southwest Arapahoe to maintain the same standard of living.
Geographical Conditions
Both being in Colorado, they share similar geographic features – a blend of plains, green spaces, and distant mountain views which offer plenty of outdoor activities for residents and tourists.
Geographical information
Type
Aurora
Southwest Arapahoe
Land area
142.5 sq. miles
69.4 sq. miles
Population density
2,732.2 people per sq. mile
2,907.1 people per sq. mile
Relative area comparison
Aurora, CO Southwest Arapahoe, CO
Education
Both areas have access to excellent educational facilities. Aurora’s public school system is large and diverse with a range of options for K-12 education, and it is also home to several higher educational institutions. Southwest Arapahoe also offers high-quality education through Cherry Creek Schools, one of the highest-ranked school districts in the state.
Aurora boasts a sturdy economy with opportunities in different sectors such as healthcare, education, and manufacturing. Southwest Arapahoe, being part of the Denver metropolitan area, also exhibits strong economic performance with many job opportunities in diverse fields.
Biggest Employers
Aurora's biggest employers are the University of Colorado Anschutz Medical Campus and the Children's Hospital Colorado. Southwest Arapahoe’s key employers fall within the Denver metro area, including several renowned corporations and government departments.
In Aurora (Adams County), 57.3% voted for Democrats and 40.4% for Republicans in 2012 Presidential Election. In Southwest Arapahoe (Arapahoe County), 54.4% voted for Democrats and 44.4% for Republicans.
Elections
Type
Democrats
Republicans
Other
Year
Aurora
Southwest Arapahoe
Aurora
Southwest Arapahoe
Aurora
Southwest Arapahoe
2020
57.1%
61.3%
40.7%
36.6%
2.2%
2.1%
2016
50.1%
53.1%
41.6%
38.9%
8.3%
8.1%
2012
57.3%
54.4%
40.4%
44.4%
2.3%
1.3%
2008
58.5%
56.0%
40.1%
43.0%
1.4%
1.0%
2004
50.7%
47.6%
48.4%
51.6%
0.9%
0.8%
2000
50.3%
43.6%
44.2%
51.6%
5.5%
4.8%
1996
51.3%
41.9%
38.9%
50.8%
9.8%
7.3%
Breakdown of population affiliated with a religious congregation
Type
Adherents
Congregations
Religion
Aurora
Southwest Arapahoe
Aurora
Southwest Arapahoe
CATHOLIC CHURCH
16.0%
12.1%
4.5%
4.3%
LUTHERAN CHURCH
0.7%
1.0%
3.3%
2.6%
SOUTHERN BAPTIST CONVENTION
0.7%
1.6%
7.8%
9.9%
EVANGELICAL LUTHERAN CHURCH IN AMERICA
0.4%
2.0%
2.5%
4.3%
SEVENTH DAY ADVENTIST CHURCH
0.4%
0.2%
3.3%
2.6%
EPISCOPAL CHURCH
0.1%
0.4%
1.2%
1.7%
MUSLIM ESTIMATE
0.1%
1.9%
0.8%
1.0%
VINEYARD USA
0.0%
0.5%
0.4%
0.3%
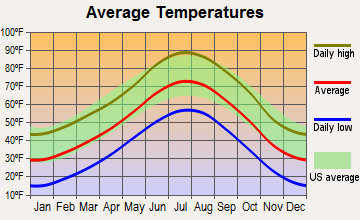
Weather
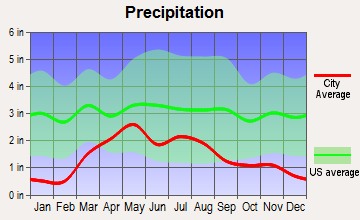
Weather conditions are pretty similar in both areas due to their close geographical proximity. They experience a semi-arid, continental climate with hot, dry summers and cold, snowy winters. The average annual rainfall varies slightly, with Aurora receiving slightly more precipitation than Southwest Arapahoe.
Weather and climate
Type
Aurora
Southwest Arapahoe
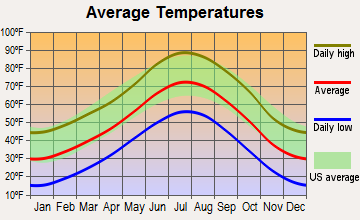
Temperature - Average
49.9°F
50°F
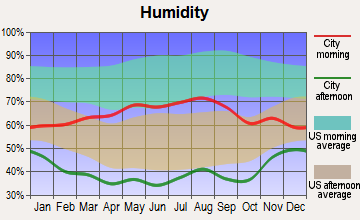
Humidity - Average morning or afternoon humidity
50.6%
50.6%
Humidity - Differences between morning and afternoon humidity
20%
20%
Humidity - Maximum monthly morning or afternoon humidity
55%
55%
Humidity - Minimum monthly morning or afternoon humidity
35%
35%
Precipitation - Yearly average
16.9 in
17.5 in
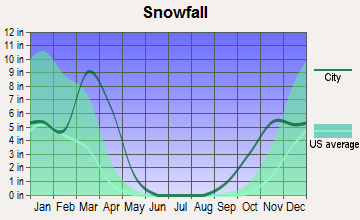
Snowfall - Yearly average
114 in
113.9 in
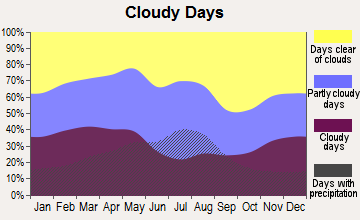
Clouds - Number of days clear of clouds
19.2%
19.2%
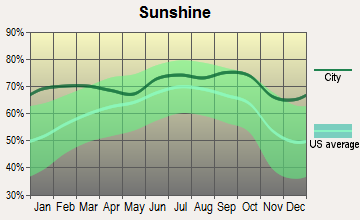
Sunshine amount - Average
75.6%
75.6%
Sunshine amount - Differences during a year
10%
10%
Sunshine amount - Maximum monthly
74%
74%
Sunshine amount - Minimum monthly
64%
64%
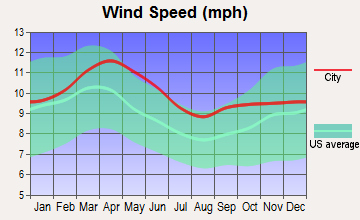
Wind speed - Average
8.6 mph
8.6 mph
Average climate in Aurora, Colorado
Average climate in Southwest Arapahoe, Colorado
Air pollution
Type
AQI
CO
NO2
OZONE
PB
PM10
PM25
SO2
Year
Aurora
Southwest Arapahoe
Aurora
Southwest Arapahoe
Aurora
Southwest Arapahoe
Aurora
Southwest Arapahoe
Aurora
Southwest Arapahoe
Aurora
Southwest Arapahoe
Aurora
Southwest Arapahoe
Aurora
Southwest Arapahoe
2018
99
100
0.37
0.40
21.5
22.3
31.3
32.3
N/A
N/A
29.2
29.2
8.5
8.2
0.7
0.7
2017
95
95
0.37
0.40
21.9
22.6
31.1
32.6
N/A
N/A
22.0
22.0
8.5
8.2
0.9
0.8
2016
90
90
0.42
0.45
24.0
24.5
30.7
32.2
N/A
N/A
22.6
22.6
8.1
7.9
1.0
1.0
2015
101
101
0.44
0.46
22.8
24.2
29.5
30.7
N/A
N/A
20.6
20.8
9.5
9.6
1.1
1.0
2014
94
94
0.42
0.45
21.8
23.2
29.6
30.6
N/A
N/A
22.5
23.8
10.1
10.1
1.3
1.3
2013
84
85
0.39
0.41
19.6
20.7
29.9
31.2
N/A
N/A
21.9
23.1
N/A
N/A
1.4
1.4
2012
90
91
0.35
0.34
18.9
18.9
30.8
31.3
N/A
N/A
24.2
24.7
N/A
N/A
1.2
1.3
2011
91
91
0.34
0.33
18.1
18.1
30.9
30.4
N/A
N/A
23.8
23.8
N/A
N/A
1.5
1.6
2010
81
82
0.41
0.42
16.3
16.3
28.8
28.0
N/A
N/A
26.6
26.4
N/A
N/A
1.0
1.0
2009
79
79
0.37
0.37
14.1
14.1
27.1
26.9
0.005
0.005
22.6
22.4
N/A
N/A
1.3
1.3
2008
85
85
0.41
0.42
17.3
17.3
28.8
30.1
0.008
0.008
25.5
25.4
N/A
N/A
1.6
1.6
2007
96
96
0.42
0.40
20.6
20.6
25.4
27.6
0.007
0.007
28.8
29.4
N/A
N/A
1.2
1.2
2006
89
89
0.50
0.50
19.0
19.0
25.0
27.1
0.027
0.018
28.0
28.0
N/A
N/A
1.4
1.4
2005
86
86
0.57
0.57
21.3
21.3
22.5
23.6
0.109
0.090
29.6
29.8
N/A
N/A
1.5
1.5
2004
82
82
0.61
0.60
21.2
21.2
21.4
22.7
0.037
0.024
28.6
28.6
N/A
N/A
1.8
1.8
2003
106
106
0.62
0.59
21.2
21.2
23.1
24.5
0.040
0.027
32.6
32.6
N/A
N/A
1.9
1.9
2002
86
86
0.64
0.64
19.2
19.2
22.8
24.1
0.028
0.021
35.7
35.7
N/A
N/A
2.5
2.5
2001
95
95
0.79
0.80
24.0
22.2
20.4
22.2
0.030
0.021
32.6
32.6
N/A
N/A
2.6
2.6
2000
93
93
0.77
0.78
13.8
12.5
21.4
23.1
0.033
0.023
12.2
12.2
N/A
N/A
2.1
2.1
Natural disasters
Type
Aurora
Southwest Arapahoe
Tornado activity compared to U.S. average
138.7%
125.3%
Earthquake activity compared to U.S. average
796.4%
815.2%
Natural disasters compared to U.S. average
11%
10%
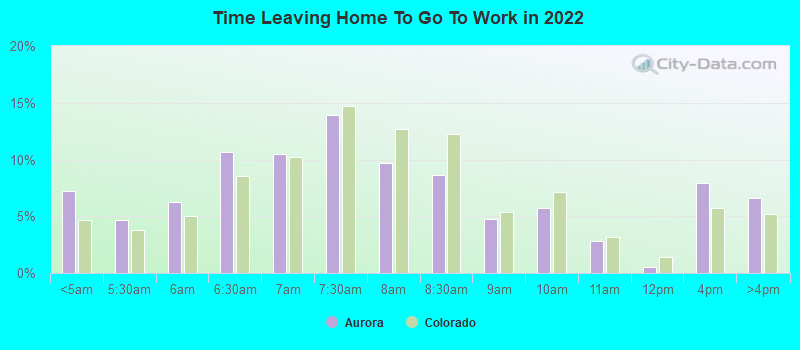
Transportation
Public transit in Aurora is well established with bus routes and light rail services. Southwest Arapahoe benefits from its proximity to Denver and enjoys efficient, reliable commuting options and access to Denver’s comprehensive transit system.
Transport
Type
Aurora
Southwest Arapahoe
Amtrak stations nearby
2
1
FAA registered aircraft
138
0
FAA registered aircraft manufacturers and dealers
19
0
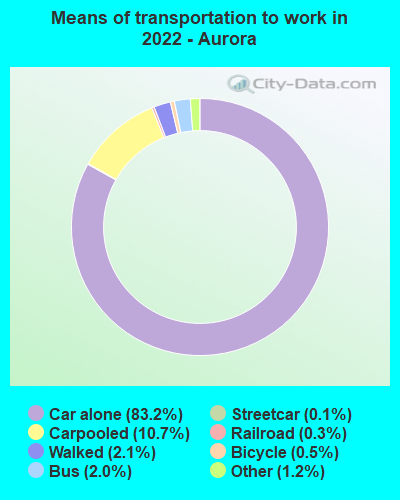
Means of transportation to work
Type
Aurora
Southwest Arapahoe
Bicycle
0.6%
0.4%
Bus
1.7%
2.6%
Carpooled
9.3%
8.7%
Car alone
84.4%
79.5%
Subway
0.1%
0.1%
Walked
2.5%
1.9%
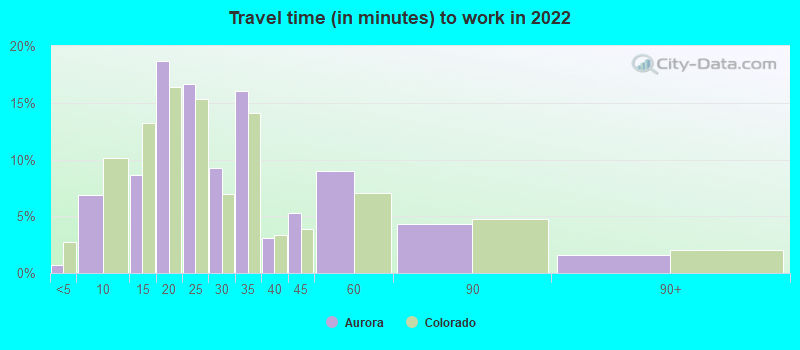
Average travel time to work
Type
Aurora
Southwest Arapahoe
Average
28.3 min
23.6 min
Real Estate
Real estate in Aurora is generally more affordable than in Southwest Arapahoe, offering a wider range of housing options. In contrast, Southwest Arapahoe homes tend to be more expensive, reflecting its status as a more upscale, suburban neighborhood.
Neighborhoods
Aurora is diverse and multicultural, with neighborhoods reflecting this variety, from urban districts to quiet suburban areas. Southwest Arapahoe, though less diverse, offers serene, family-friendly neighborhoods often noted for their safety.
Houses and residents
Type
Aurora
Southwest Arapahoe
Houses
149,636
74,676
Average household size (people)
2.7
2.3
Houses occupied
140,003 (93.6%)
72,320 (96.8%)
Houses occupied by owners
89,615 (64%)
51,515 (71.2%)
Houses occupied by renters
50,388 (36%)
20,805 (28.8%)
Median rent asked for vacant for-rent units
$2,036
$1,892
Median price asked for vacant for-sale houses and condos
$725,445
$836,561
Estimated median house or condo value
$411,400
$580,701
Median number of rooms in apartments
3.9
3.9
Median number of rooms in houses and condos
6.5
8.4
Renting percentage
40.1%
33.4%
Housing density (houses/condos per square mile)
1,050.1
1,076.2
Household income disparities
41.5%
39.5%
Housing units without a mortgage
424 (0.6%)
10,129 (21.9%)
Housing units with both a second mortgage and home equity loan
5,246 (7.8%)
188 (0.4%)
Housing units with a mortgage
66,791 (99.4%)
36,226 (78.1%)
Housing units with a home equity loan
176 (0.3%)
4,073 (8.8%)
Housing units with a second mortgage
6,860 (10.2%)
5,648 (12.2%)
Housing units lacking complete kitchen facilities
1%
0.6%
Housing units lacking complete plumbing facilities
Self-employed workers in own not incorporated business
13,677
8,094
State government workers
5,134
2,412
Unpaid family workers
0
266
Industries and Occupations
In Aurora, key industries include healthcare, retail, and education. Alternatively, Southwest Arapahoe has a diverse industry spread with a significant presence in professional services, healthcare, and retail trade.
Healthcare facilities are excellent in both areas. Aurora is home to the Anschutz Medical Campus, one of the largest and most advanced health care campuses in the US. In Southwest Arapahoe, residents enjoy easy access to quality health care providers within the larger Denver metropolitan area.
Health (county statistics)
Type
Aurora
Southwest Arapahoe
General health status score of residents in this county from 1 (poor) to 5 (excellent)
Aurora, as a large city, has well-developed infrastructure including roads, parks, public facilities, shopping centers, and more. Southwest Arapahoe, while smaller, is well integrated into the Denver metro area infrastructure providing residents with quick access to a multitude of amenities.
Infrastructure
Type
Aurora
Southwest Arapahoe
TV stations
15
16
Culture and Food
Aurora is known for its diversity reflected in its cultural events and food scenes, comprising cuisines from across the globe. Southwest Arapahoe has a smaller and less diverse but high-quality culinary scene.
Sports Teams
As a part of the Denver Metro area, both areas have vibrant sports cultures and easy access to Denver’s sports teams, including the Denver Broncos (NFL), Colorado Rockies (MLB), Denver Nuggets (NBA), and Colorado Avalanche (NHL).
 Aurora, CO
 Southwest Arapahoe, CO