Austin, TX and Boise, ID are both thriving cities in the United States with unique features that make them attractive places to live or visit. Austin, the 'Live Music Capital of the World,' offers a vibrant cultural scene and booming tech industry, while Boise is known for its safe neighborhoods, natural beauty, and active lifestyle. This analysis will compare these two cities across a range of factors to provide a comprehensive view of what each city brings to the table for potential residents and tourists.
Distance between
Austin, TX and
Boise, ID : 1,368.3 miles
Austin's population is larger by 306%. Its population has grown by 307,615 people (46.9%) since 2000. The population of Boise has grown by 51,659 people (27.8%) during that time.
Boise, ID boasts a relatively low crime rate, making it one of the safest places in the US to live and visit. Even in downtown, crime tends to be low compared to other cities of similar size. Austin, TX, while being relatively safe compared to national averages, has a slightly higher crime rate. However, most crimes in Austin tend to be property crimes rather than violent crimes. In both cities, you will find a dedicated police force and vigilant community deterrents ensuring the safety of residents and tourists.
City-data.com crime index counts serious crimes and violent crime more heavily. It adjusts for the number of visitors and daily workers commuting into cities. (higher means more crime, U.S. average = 301.1)
City-data.com crime index counts serious crimes and violent crime more heavily. It adjusts for the number of visitors and daily workers commuting into cities. (higher means more crime, U.S. average = 301.1)
Sex Offenders
According to our data, there are 1,411 registered sex offenders living in Austin and 792 registered sex offenders living in . The ratio of residents to sex offenders in Austin is 672 to 1; the ratio in Boise is 282 to 1. The number of registered sex offenders compared to the number of residents is a smaller in Austin than in Boise.
Cost of Living
The cost of living in Austin, TX is significantly higher than in Boise, ID, particularly when it comes to housing. Despite this, Austin still remains more affordable than many major US cities. Meanwhile, Boise offers lower living expenses, but has seen a rise in housing costs in recent years due to increased demand. When it comes to food, entertainment, and transportation, both cities are fairly compatible with national averages.
Income Tax
Boise residents pay state income tax, with rates ranging from 1.125% to 6.925%, depending on income level. Texas, on the other hand, does not have a state income tax, resulting in more take-home pay for workers in Austin.
Property Tax
Both Austin, TX and Boise, ID have property tax rates above the national average, although Austin's rates tend to be slightly higher. Each city uses property taxes to fund community services such as schools, parks, and public safety measures.
Sales Tax
Austin has a higher sales tax rate due to Texas's 8.25% state sales tax which is above the national average. Idaho's state sales tax is currently set at 6%, making Boise's sales tax lower than in Austin.
Income
Type
Austin
Boise
Estimated median household income
$79,542
$70,217
Estimated per capita income
$53,937
$42,814
Cost of living index (U.S. average is 100)
96.4
95.8
If you make $50,000 in Boise, you will have to make $50,313 in Austin to maintain the same standard of living.
Geographical Conditions
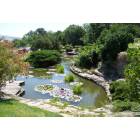
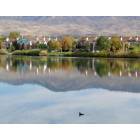
Austin sits in Central Texas and is known for its hill country, lakes, and rivers. It offers many outdoor recreational opportunities such as hiking, biking, and boating. Boise, often referred to as the City of Trees, is in the foothills of the Rocky Mountains, offering easy access to hiking, skiing, and river activities.
Both cities value education and have well-regarded public school systems. Austin offers a diverse range of educational opportunities, including charter and magnet schools, and is home to the highly regarded University of Texas at Austin. Boise also has solid educational resources, with Boise State University and several community colleges offering quality higher education options.
Austin, TX has a thriving economy powered by a flourishing tech industry with companies like Dell, Indeed, and Google. The city also has a vibrant music and arts scene which contributes to the economy. Boise, ID is known for its balanced economy with industries such as healthcare, education, and technology leading the way. Both cities demonstrate strong job growth and lower unemployment rates compared to the national average.
Biggest Employers
Austin's biggest employers come from a variety of sectors including the University of Texas, Dell Technologies, and the Austin Independent School District. Meanwhile, Boise's largest employers include St. Luke's Health System, Micron Technology, and Boise State University.
There were 4,180 building permits issued in Austin in 2012 (2467 more than in 2011) compared to 856 building permits issued in Boise in 2012 (497 more than in 2011).
In Austin (Travis County), 60.2% voted for Democrats and 36.2% for Republicans in 2012 Presidential Election. In Boise (Ada County), 42.3% voted for Democrats and 53.5% for Republicans.
Elections
Type
Democrats
Republicans
Other
Year
Austin
Boise
Austin
Boise
Austin
Boise
2020
71.7%
46.6%
26.5%
50.5%
1.8%
2.8%
2016
65.8%
38.8%
27.2%
48.1%
7.0%
13.0%
2012
60.2%
42.3%
36.2%
53.5%
3.6%
4.1%
2008
63.8%
45.5%
34.4%
51.6%
1.8%
2.9%
2004
56.1%
37.8%
42.1%
61.2%
1.8%
1.0%
2000
41.7%
33.1%
47.0%
61.0%
11.3%
5.9%
1996
52.4%
36.6%
40.0%
52.5%
7.7%
10.9%
Breakdown of population affiliated with a religious congregation
Type
Adherents
Congregations
Religion
Austin
Boise
Austin
Boise
CATHOLIC CHURCH
17.3%
6.7%
4.5%
2.5%
SOUTHERN BAPTIST CONVENTION
8.0%
0.6%
22.8%
3.1%
EPISCOPAL CHURCH
1.4%
0.6%
2.8%
1.1%
MUSLIM ESTIMATE
1.2%
0.2%
0.7%
0.8%
EVANGELICAL LUTHERAN CHURCH IN AMERICA
1.0%
0.6%
2.5%
1.4%
LUTHERAN CHURCH
0.9%
0.5%
2.1%
1.1%
SEVENTH DAY ADVENTIST CHURCH
0.2%
0.6%
1.0%
2.3%
AMERICAN BAPTIST CHURCHES IN THE USA
0.1%
0.7%
0.1%
2.0%
VINEYARD USA
0.0%
0.9%
0.3%
0.6%
Weather
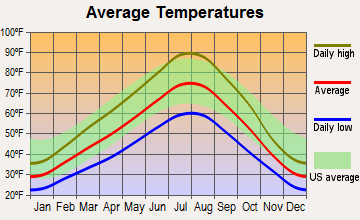
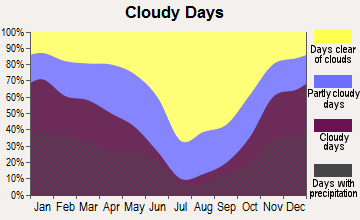
Austin, TX is known for its hot summers, with temperatures frequently exceeding 90 degrees Fahrenheit between June and September. Winters are mild and short. Boise, ID, on the other hand, experiences a full range of seasons with hot, dry summers and winters that can often bring heavy snowfall. Both cities offer a good mix of outdoor activities year-round, with Boise's colder climate great for winter sports and Austin's warmth ideal for summer festivals and concerts.
Weather and climate
Type
Austin
Boise
Temperature - Average
68.5°F
51.6°F
Humidity - Average morning or afternoon humidity
75.2%
57.8%
Humidity - Differences between morning and afternoon humidity
40%
59%
Humidity - Maximum monthly morning or afternoon humidity
89%
79%
Humidity - Minimum monthly morning or afternoon humidity
49%
20%
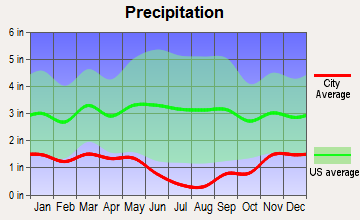
Precipitation - Yearly average
33.7 in
13.1 in
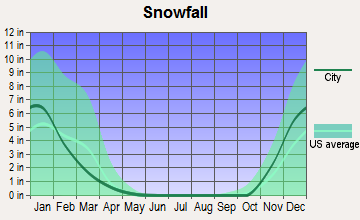
Snowfall - Yearly average
1.4 in
40 in
Clouds - Number of days clear of clouds
19.3%
20%
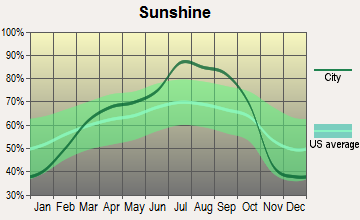
Sunshine amount - Average
63.3%
68.3%
Sunshine amount - Differences during a year
22%
53%
Sunshine amount - Maximum monthly
72%
85%
Sunshine amount - Minimum monthly
50%
32%
Wind speed - Average
7.2 mph
8.2 mph
Average climate in Austin, Texas
Average climate in Boise, Idaho
Air pollution
Type
AQI
CO
NO2
OZONE
PM10
PM25
SO2
Year
Austin
Boise
Austin
Boise
Austin
Boise
Austin
Boise
Boise
Austin
Boise
Austin
Boise
2018
76
89
N/A
0.63
4.9
N/A
26.7
27.2
21.3
N/A
8.7
8.0
0.2
0.3
2017
76
107
N/A
0.43
4.6
N/A
29.7
28.0
23.2
N/A
8.3
10.3
0.3
0.3
2016
71
85
N/A
0.39
4.2
N/A
29.5
25.5
21.6
N/A
8.2
6.0
0.2
0.7
2015
78
93
N/A
0.50
4.4
N/A
28.9
24.7
24.7
N/A
8.6
6.9
0.3
0.6
2014
74
49
N/A
0.39
5.2
N/A
28.3
24.7
20.1
N/A
8.7
N/A
0.5
0.7
2013
78
58
0.09
0.35
5.5
N/A
29.5
24.3
25.6
N/A
8.6
N/A
0.5
2.6
2012
86
89
0.13
0.39
5.5
N/A
30.1
27.0
26.4
N/A
8.6
N/A
N/A
1.2
2011
83
67
0.11
0.35
2.6
N/A
33.0
31.1
20.5
N/A
9.1
N/A
N/A
0.9
2010
77
81
0.05
0.40
3.2
9.0
29.4
26.7
18.8
N/A
8.8
12.8
N/A
0.3
2009
76
75
0.05
0.62
2.6
9.8
29.7
27.2
21.5
N/A
9.0
6.1
N/A
0.3
2008
81
82
0.12
0.67
3.2
N/A
30.7
N/A
22.7
N/A
9.7
9.3
N/A
N/A
2007
82
105
0.12
0.55
3.1
N/A
27.1
N/A
24.2
N/A
9.8
11.2
N/A
N/A
2006
89
96
0.14
0.64
3.8
N/A
31.3
N/A
23.9
N/A
10.0
8.7
0.2
N/A
2005
92
92
0.15
0.81
4.4
N/A
29.0
N/A
21.7
N/A
10.7
8.1
0.2
N/A
2004
74
89
0.16
0.89
3.3
N/A
26.8
31.7
23.3
N/A
N/A
7.2
N/A
N/A
2003
85
72
0.26
1.02
4.2
N/A
28.9
28.4
27.5
N/A
N/A
N/A
0.1
N/A
2002
83
78
0.33
1.04
3.9
N/A
27.2
32.2
30.7
N/A
N/A
N/A
N/A
N/A
2001
83
75
0.31
1.06
4.2
N/A
25.5
N/A
30.7
N/A
N/A
N/A
N/A
N/A
2000
86
59
0.28
1.05
4.7
18.3
27.8
N/A
28.6
N/A
N/A
N/A
N/A
N/A
Natural disasters
Type
Austin
Boise
Tornado activity compared to U.S. average
137.9%
5.8%
Earthquake activity compared to U.S. average
80.4%
2,314.9%
Natural disasters compared to U.S. average
29%
5%
Transportation
Austin has a variety of commuting options, including a Metro system, city buses, ride-sharing services, and bike routes. However, due to rapid growth, Austin struggles with traffic congestion. Boise, on the other hand, has less traffic and a good public transit system, but many residents opt to use cars for convenience.
Transport
Type
Austin
Boise
Amtrak stations
1
1
Amtrak stations nearby
1
2
FAA registered aircraft
911
737
FAA registered aircraft manufacturers and dealers
21
19
Means of transportation to work
Type
Austin
Boise
Bicycle
0.8%
2.5%
Bus
1.5%
0.2%
Carpooled
7.9%
5.4%
Car alone
85.9%
89.1%
Motorcycle
0.3%
0.1%
Taxicab
0.1%
0.1%
Walked
2%
1.5%
Average travel time to work
Type
Austin
Boise
Average
29.9 min
23.5 min
Other means
22.7 min
18.9 min
Public transportation
37.9 min
36 min
Private vehicle occupancy
Type
Austin
Boise
Average
1.1
1.1
Drove alone
91.2%
91.9%
In 2 person carpool
6.3%
6.7%
In 3 person carpool
1.7%
1%
In 4 person carpool
0.6%
0.2%
In 5-6 person carpool
0.1%
0.2%
In 7+ person carpool
0.2%
0.1%
How many people usually rode to work in the car, truck or van.
Real Estate
Real estate prices in Austin tend to be higher than in Boise, with a median home value above the national average. The recent increase in popularity has led to a competitive housing market. Boise has typically lower house prices but has experienced a notable rise due to increased demand.
Neighborhoods
Both Austin and Boise offer a wide range of neighborhoods, from bustling downtown areas to serene suburban enclaves. Austin neighborhoods like South Congress and Hyde Park have a unique flair defined by local shops, restaurants, and music venues, while in Boise, areas like the North End and the East End offer an appealing mix of historic charm and modern amenities.
Houses and residents
Type
Austin
Boise
Houses
469,156
104,110
Average household size (people)
2.4
2.4
Median year apartment built
1997
1985
Median year house/condo built
1988
1983
Length of stay in the house since moving in
12.1 years
11.2 years
Houses occupied
449,399 (95.8%)
99,250 (95.3%)
Houses occupied by owners
196,458 (43.7%)
62,684 (63.2%)
Houses occupied by renters
252,941 (56.3%)
36,566 (36.8%)
Median rent asked for vacant for-rent units
$1,286
$965.22
Median monthly housing costs
$1,521
$1,184
Median price asked for vacant for-sale houses and condos
$549,769
$290,076
Estimated median house or condo value
$482,900
$460,200
Median numbers of rooms
4.4
5.4
Median number of rooms in apartments
3.4
4
Median number of rooms in houses and condos
6
6.4
Median house price - detached houses
$595,996
$511,096
Median house price - in 2-unit structures
$393,984
$444,814
Median house price - in 3-to-4-unit structures
$262,826
Over $1,000,000
Median house price - in 5 or more unit structures
$576,111
$369,189
Median house price - mobile homes
$56,102
$79,284
Median house price - Townhouses or other attached units
$459,657
$421,814
Median house price - All housing units
$571,154
$486,650
Median house age
28
38
Renting percentage
54.9%
38.9%
Housing density (houses/condos per square mile)
1,865.3
1,632.4
House value disparities
28.4%
27.1%
Household income disparities
44.8%
43.3%
Median household income for houses/condes with a mortgage
$141,177
$101,590
Median household income for apartments without a mortgage
$86,430
$62,286
Housing units without a mortgage
1,799 (1.3%)
1,657 (3.8%)
Housing units with both a second mortgage and home equity loan
6,421 (4.8%)
4,888 (11.2%)
Housing units with a mortgage
132,628 (98.7%)
41,976 (96.2%)
Housing units with a home equity loan
206 (0.2%)
51 (0.1%)
Housing units with a second mortgage
8,515 (6.3%)
5,293 (12.1%)
House/condo owner moved in on average (years ago)
9
8
House/condo renter moved in on average (years ago)
1
1
Housing units lacking complete kitchen facilities
0.9%
2%
Housing units lacking complete plumbing facilities
0.6%
0.5%
Housing units in structures
Housing units in structures
Austin
Boise
One, detached
43.1%
63.8%
One, attached
5.2%
7.2%
Two
2.4%
2.0%
3 or 4
4.1%
6.5%
5 to 9
7.2%
4.2%
10 to 19
11.0%
5.4%
20 to 49
8.9%
3.7%
50 or more
17.2%
3.7%
Mobile homes
1.0%
3.4%
Median real estate property taxes paid for housing units
Self-employed workers in own not incorporated business
38,777
9,168
State government workers
46,229
8,189
Unpaid family workers
102
172
Industries and Occupations
Austin's dominant industries are technology, healthcare, and entertainment, and some of the popular occupations include software engineers, healthcare workers, and performers. Boise's economy is diversified with health care, education, and tech industries leading the way. Most common jobs in Boise include registered nurses, software developers, and teachers.
Both cities provide high-quality healthcare facilities. Austin's healthcare institutions, such as the Seton Family of Hospitals and St. David's HealthCare, are nationally recognized. Boise also has excellent healthcare services, with St. Luke's Health System and Saint Alphonsus Health System serving as the key providers.
Health (county statistics)
Type
Austin
Boise
General health status score of residents in this county from 1 (poor) to 5 (excellent)
Austin's infrastructure includes a robust public transportation system, numerous parks and recreation areas, and a network of bike lanes and trails. Traffic congestion can be an issue. Boise, on the other hand, is noted for its clean, well-maintained cityscape, versatile transportation options, and also boasts an extensive park system. Both cities are making ongoing investments to improve infrastructure and quality of life for their residents.
Infrastructure
Type
Austin
Boise
Hospitals
65
15
TV stations
20
18
Arenas or stadiums
2
1
Bank branches located here
264
96
Bank institutions located here
43
21
Main business address for public companies
44
6
Drinking water stations with no reported violations in the past
46
7
Drinking water stations with reported violations in the past
HMDA - Conventional home purchase loans - Applications denied
Year
Austin
Boise
1999
4,733
984
2000
2,950
639
2001
2,038
423
2002
1,772
374
2003
2,213
525
2004
2,458
624
2005
3,121
1,209
2006
3,367
1,081
2007
2,560
628
2008
1,747
283
2009
1,067
146
Culture and Food
Culturally, both cities are diverse. Austin is known for its live music scene, arts, and culinary diversity, evident in its renowned food trucks. BBQ and Tex-Mex are longtime favorites. Boise, while quieter, offers a mix of American and international cuisine, with a focus on local ingredients. Its annual Treefort Music Fest highlights the vibrant local music scene.
Sports Teams
Austin, unlike most major cities, doesn't have any major league sports teams but is the home of Texas Longhorns and recently welcomed a Major League Soccer team, Austin FC. Boise does not have major league teams, but sports fans enjoy the Boise Hawks minor league baseball and the Boise State University's Broncos football team.


 Austin, TX and
  Boise, ID : 1,368.3 miles