Austin, Texas and Des Moines, Iowa are two vibrant US cities, each with its unique lifestyle. Austin, known for its dynamic culture and thriving tech industries, presents an exciting life for professionals and tourists while Des Moines, boasting a robust insurance industry and a lower cost of living, is an attractive destination for families looking to relocate. In this comparison, we take into account factors such as crime/safety, weather, cost of living, and more, that might influence a potential move or tourist visit to either city.
Distance between
Austin, TX and
Des Moines, IA : 813.2 miles
Austin's population is larger by 355%. Its population has grown by 307,615 people (46.9%) since 2000. The population of Des Moines has grown by 13,349 people (6.7%) during that time.
Historically, Des Moines has a lower crime rate compared to the national average which makes it reasonably safe for residents and tourists. Meanwhile, Austin tends to have a slightly higher crime rate compared to the national average and marginally higher than Des Moines'. Nonetheless, the city is generally safe, particularly in numerous neighborhoods which have significantly lower crime rates.
City-data.com crime index counts serious crimes and violent crime more heavily. It adjusts for the number of visitors and daily workers commuting into cities. (higher means more crime, U.S. average = 301.1)
City-data.com crime index counts serious crimes and violent crime more heavily. It adjusts for the number of visitors and daily workers commuting into cities. (higher means more crime, U.S. average = 301.1)
Sex Offenders
According to our data, there are 1,422 registered sex offenders living in Austin and 786 registered sex offenders living in . The ratio of residents to sex offenders in Austin is 667 to 1; the ratio in Des Moines is 274 to 1. The number of registered sex offenders compared to the number of residents is a smaller in Austin than in Des Moines.
Cost of Living
The cost of living in Austin is significantly higher than in Des Moines. This is largely driven by housing costs, which are well above the national average in Austin. On the contrary, Des Moines boasts a cost of living below the national average— an inviting attribute for families looking to relocate without compromising their quality of life.
Income Tax
Residents in Austin benefit from Texas's lack of a state income tax, which can lower the overall tax burden. On the other hand, Iowa imposes a state income tax, which can escalate the overall tax paid by Des Moines residents.
Property Tax
Austin's property tax rates are higher than the national average, affecting the overall cost of homeownership. Des Moines offers lower property tax rates compared to the national average, consequently offering a more affordable home ownership experience.
Sales Tax
Texas has a relatively high sales tax rate, but it doesn't impose any state income tax. This contrasts with Iowa, which has a lower sales tax rate but they do levy state income tax.
Income
Type
Austin
Des Moines
Estimated median household income
$79,542
$60,693
Estimated per capita income
$53,937
$33,498
Cost of living index (U.S. average is 100)
96.4
89.7
If you make $50,000 in Des Moines, you will have to make $53,735 in Austin to maintain the same standard of living.
Geographical Conditions
Located in Central Texas, Austin offers hill-country scenery with many parks, lakes, and outdoor recreation areas. Conversely, Des Moines, situated in the Midwest's heartland, is flatter and known for its fertile soil, featuring a mix of rural and urban landscapes.
Both Austin and Des Moines prioritize education. Austin, home to the prestigious University of Texas, offers a wealth of educational resources and opportunities. Des Moines, on the other hand, has highly rated public schools and is also home to several colleges and universities, contributing to a well-educated workforce.
Austin's economy is bustling, primarily driven by the tech industry, with numerous tech giants housing major operations there. In contrast, Des Moines is known as the "Hartford of the West", owing to its prosperous insurance sector. The city is home to several insurance company headquarters, which provides ample job opportunities.
Biggest Employers
Some of the main employers in Austin include Dell, IBM, and the University of Texas. In Des Moines, principal employers include Principal Financial, Wells Fargo, and the Mercy Medical Center.
There were 4,180 building permits issued in Austin in 2012 (2467 more than in 2011) compared to 248 building permits issued in Des Moines in 2012 (133 more than in 2011).
In Austin (Travis County), 60.2% voted for Democrats and 36.2% for Republicans in 2012 Presidential Election. In Des Moines (Polk County), 56.4% voted for Democrats and 42.2% for Republicans.
Elections
Type
Democrats
Republicans
Other
Year
Austin
Des Moines
Austin
Des Moines
Austin
Des Moines
2020
71.7%
56.9%
26.5%
41.5%
1.8%
1.6%
2016
65.8%
51.9%
27.2%
40.5%
7.0%
7.7%
2012
60.2%
56.4%
36.2%
42.2%
3.6%
1.4%
2008
63.8%
56.5%
34.4%
41.9%
1.8%
1.6%
2004
56.1%
52.1%
42.1%
47.4%
1.8%
0.5%
2000
41.7%
51.9%
47.0%
46.2%
11.3%
1.9%
1996
52.4%
78.5%
40.0%
18.2%
7.7%
3.4%
Breakdown of population affiliated with a religious congregation
Type
Adherents
Congregations
Religion
Austin
Des Moines
Austin
Des Moines
CATHOLIC CHURCH
17.3%
14.6%
4.5%
4.7%
SOUTHERN BAPTIST CONVENTION
8.0%
1.1%
22.8%
3.2%
EPISCOPAL CHURCH
1.4%
0.5%
2.8%
1.5%
MUSLIM ESTIMATE
1.2%
0.4%
0.7%
1.0%
EVANGELICAL LUTHERAN CHURCH IN AMERICA
1.0%
3.8%
2.5%
4.2%
LUTHERAN CHURCH
0.9%
1.8%
2.1%
3.7%
SEVENTH DAY ADVENTIST CHURCH
0.2%
0.3%
1.0%
1.2%
REFORMED CHURCH IN AMERICA
0.0%
0.8%
0.0%
1.0%
Weather
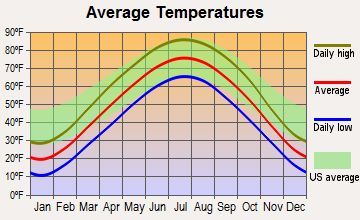
Weather-wise, Austin, located in Central Texas, experiences hot summers and mild winters. Des Moines, located in the Midwest, has a balanced mix of all four seasons, including hot, humid summers and cold, snowy winters. This variance in weather offers different appeals, with Austin's warm climate attracting those who love outdoor activities year-round, and Des Moines providing seasonal changes, appealing to those who enjoy diverse climate conditions.
Weather and climate
Type
Austin
Des Moines
Temperature - Average
68.5°F
49.6°F
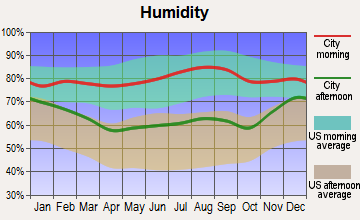
Humidity - Average morning or afternoon humidity
75.2%
76.2%
Humidity - Differences between morning and afternoon humidity
40%
32%
Humidity - Maximum monthly morning or afternoon humidity
89%
86%
Humidity - Minimum monthly morning or afternoon humidity
49%
54%
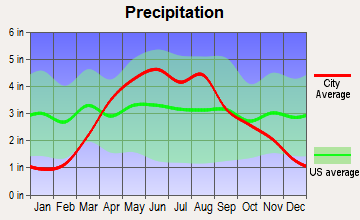
Precipitation - Yearly average
33.7 in
34.5 in
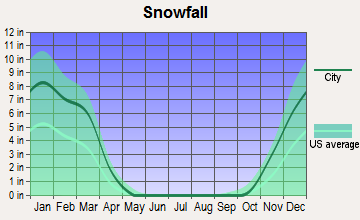
Snowfall - Yearly average
1.4 in
68.6 in
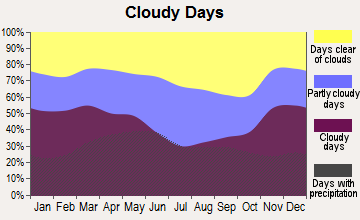
Clouds - Number of days clear of clouds
19.3%
17.5%
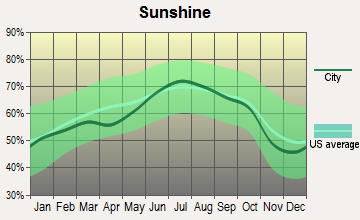
Sunshine amount - Average
63.3%
63.3%
Sunshine amount - Differences during a year
22%
31%
Sunshine amount - Maximum monthly
72%
74%
Sunshine amount - Minimum monthly
50%
43%
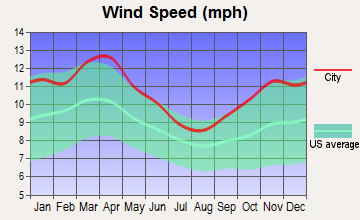
Wind speed - Average
7.2 mph
10.6 mph
Average climate in Austin, Texas
Average climate in Des Moines, Iowa
Air pollution
Type
AQI
CO
NO2
OZONE
PM25
SO2
Year
Austin
Des Moines
Austin
Des Moines
Austin
Des Moines
Austin
Des Moines
Austin
Des Moines
Austin
Des Moines
2018
76
67
N/A
0.21
4.9
6.8
26.7
27.6
8.7
7.1
0.2
0.0
2017
76
76
N/A
0.21
4.6
6.4
29.7
28.2
8.3
7.5
0.3
0.1
2016
71
69
N/A
0.21
4.2
6.2
29.5
30.3
8.2
7.6
0.2
0.0
2015
78
68
N/A
0.21
4.4
6.4
28.9
30.4
8.6
7.2
0.3
0.1
2014
74
71
N/A
0.21
5.2
6.5
28.3
28.6
8.7
7.1
0.5
0.0
2013
78
69
0.09
0.21
5.5
7.0
29.5
31.0
8.6
9.1
0.5
0.0
2012
86
77
0.13
0.22
5.5
8.1
30.1
32.9
8.6
9.0
N/A
0.1
2011
83
76
0.11
0.21
2.6
8.0
33.0
28.9
9.1
9.2
N/A
0.1
2010
77
74
0.05
0.29
3.2
9.3
29.4
27.0
8.8
10.1
N/A
0.3
2009
76
70
0.05
0.28
2.6
9.0
29.7
25.0
9.0
9.9
N/A
0.3
2008
81
79
0.12
0.31
3.2
9.1
30.7
26.7
9.7
10.5
N/A
0.3
2007
82
72
0.12
0.34
3.1
8.9
27.1
30.2
9.8
N/A
N/A
0.3
2006
89
50
0.14
0.36
3.8
9.9
31.3
27.1
10.0
N/A
0.2
N/A
2005
92
66
0.15
0.48
4.4
10.7
29.0
29.4
10.7
N/A
0.2
N/A
2004
74
42
0.16
0.79
3.3
11.1
26.8
24.1
N/A
N/A
N/A
N/A
2003
85
47
0.26
0.83
4.2
12.3
28.9
19.7
N/A
N/A
0.1
N/A
2002
83
51
0.33
0.80
3.9
12.0
27.2
23.9
N/A
N/A
N/A
N/A
2001
83
52
0.31
0.82
4.2
12.4
25.5
25.3
N/A
N/A
N/A
N/A
2000
86
68
0.28
0.77
4.7
N/A
27.8
24.3
N/A
N/A
N/A
N/A
Natural disasters
Type
Austin
Des Moines
Tornado activity compared to U.S. average
137.9%
205.8%
Earthquake activity compared to U.S. average
80.4%
317.2%
Natural disasters compared to U.S. average
29%
17%
Transportation
Austin has an increasing focus on public transportation with options such as buses, a commuter rail, bicycles, and ride-sharing apps. However, most Austinites rely on cars for their commute. Des Moines' DART (Des Moines Area Regional Transit) is a primary means of public transport for many residents, and the city is also highly bike-friendly.
Transport
Type
Austin
Des Moines
Amtrak stations
1
0
Amtrak stations nearby
1
0
FAA registered aircraft
911
142
FAA registered aircraft manufacturers and dealers
21
8
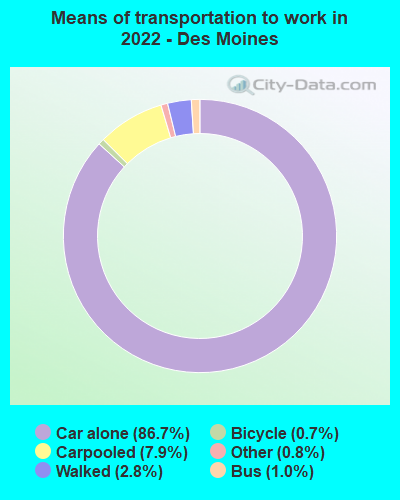
Means of transportation to work
Type
Austin
Des Moines
Bicycle
0.8%
0.8%
Bus
1.5%
0.9%
Carpooled
7.9%
9.7%
Car alone
85.9%
84.9%
Motorcycle
0.3%
0.1%
Taxicab
0.1%
0.1%
Walked
2%
1.8%
Average travel time to work
Type
Austin
Des Moines
Average
29.9 min
23.5 min
Other means
22.7 min
18.7 min
Public transportation
37.9 min
29.5 min
Private vehicle occupancy
Type
Austin
Des Moines
Average
1.1
1.2
Drove alone
91.2%
86.6%
In 2 person carpool
6.3%
9.9%
In 3 person carpool
1.7%
2.7%
In 4 person carpool
0.6%
0.5%
In 5-6 person carpool
0.1%
0.1%
In 7+ person carpool
0.2%
0.1%
How many people usually rode to work in the car, truck or van.
Real Estate
Real estate in Austin tends to be more expensive due to the constant influx of new residents drawn by the city's thriving tech scene. In contrast, Des Moines offers affordable housing options making it attractive for families and individuals looking to relocate.
Neighborhoods
Both cities provide diverse neighborhoods catering to different demographics. Austin's neighborhoods range from vibrant downtown areas filled with nightlife to quiet suburban neighborhoods ideal for families. Des Moines boasts family-friendly neighborhoods, such as Beaverdale and Waveland Park, friendly suburbs that offer excellent amenities.
Houses and residents
Type
Austin
Des Moines
Houses
469,156
97,957
Average household size (people)
2.4
2.4
Median year apartment built
1997
1973
Median year house/condo built
1988
1955
Length of stay in the house since moving in
12.1 years
11.9 years
Houses occupied
449,399 (95.8%)
90,416 (92.3%)
Houses occupied by owners
196,458 (43.7%)
57,606 (63.7%)
Houses occupied by renters
252,941 (56.3%)
32,810 (36.3%)
Median rent asked for vacant for-rent units
$1,286
$1,302
Median monthly housing costs
$1,521
$1,020
Median price asked for vacant for-sale houses and condos
$549,769
$248,725
Estimated median house or condo value
$482,900
$165,100
Median numbers of rooms
4.4
5.2
Median number of rooms in apartments
3.4
3.8
Median number of rooms in houses and condos
6
6.1
Median house price - detached houses
$595,996
$179,065
Median house price - in 2-unit structures
$393,984
$116,964
Median house price - in 3-to-4-unit structures
$262,826
$235,107
Median house price - in 5 or more unit structures
$576,111
$284,995
Median house price - mobile homes
$56,102
$21,893
Median house price - Townhouses or other attached units
$459,657
$192,190
Median house price - All housing units
$571,154
$180,640
Median house age
28
62
Renting percentage
54.9%
37.2%
Housing density (houses/condos per square mile)
1,865.3
1,292.4
House value disparities
28.4%
31.7%
Household income disparities
44.8%
41.3%
Median household income for houses/condes with a mortgage
$141,177
$83,033
Median household income for apartments without a mortgage
$86,430
$57,585
Housing units without a mortgage
1,799 (1.3%)
649 (1.6%)
Housing units with both a second mortgage and home equity loan
6,421 (4.8%)
2,590 (6.5%)
Housing units with a mortgage
132,628 (98.7%)
39,110 (98.4%)
Housing units with a home equity loan
206 (0.2%)
414 (1%)
Housing units with a second mortgage
8,515 (6.3%)
3,409 (8.6%)
House/condo owner moved in on average (years ago)
9
10
House/condo renter moved in on average (years ago)
1
1
Housing units lacking complete kitchen facilities
0.9%
1.5%
Housing units lacking complete plumbing facilities
0.6%
1%
Housing units in structures
Housing units in structures
Austin
Des Moines
One, detached
43.1%
64.4%
One, attached
5.2%
3.7%
Two
2.4%
3.6%
3 or 4
4.1%
2.3%
5 to 9
7.2%
2.9%
10 to 19
11.0%
3.8%
20 to 49
8.9%
7.8%
50 or more
17.2%
9.0%
Mobile homes
1.0%
1.7%
Boats, RVs, vans, etc.
0.0%
0.6%
Median real estate property taxes paid for housing units
Self-employed workers in own not incorporated business
38,777
4,833
State government workers
46,229
3,844
Unpaid family workers
102
222
Industries and Occupations
Austin is known as the "Silicon Hills" given its significant concentration of tech companies, which offers numerous tech jobs. Conversely, Des Moines' economy centers around financial services and insurance, offering opportunities in these sectors.
Austin provides excellent healthcare facilities, with numerous hospitals rated highly for patient care. Similarly, Des Moines has a strong healthcare system with well-rated hospitals and access to quality medical care.
Health (county statistics)
Type
Austin
Des Moines
General health status score of residents in this county from 1 (poor) to 5 (excellent)
Both cities have efficient infrastructure systems. Austin boasts modern infrastructures to support its booming tech industry, while Des Moines has made significant investments in urban revitalization projects, including updating their downtown area and establishing trails and greenways.
Infrastructure
Type
Austin
Des Moines
Hospitals
65
12
TV stations
20
14
Arenas or stadiums
2
2
Bank branches located here
264
61
Bank institutions located here
43
19
Main business address for public companies
44
7
Drinking water stations with no reported violations in the past
46
2
Drinking water stations with reported violations in the past
HMDA - Conventional home purchase loans - Applications denied
Year
Austin
Des Moines
1999
4,733
791
2000
2,950
658
2001
2,038
629
2002
1,772
665
2003
2,213
573
2004
2,458
725
2005
3,121
892
2006
3,367
895
2007
2,560
671
2008
1,747
284
2009
1,067
158
Culture and Food
Austin, often referred to as the "Live Music Capital of the World", is known for its vibrant music scene and cultural festivals. The city also offers a diverse culinary scene, specifically renowned for its Tex-Mex and barbecue. Des Moines, though smaller, hosts numerous cultural events and offers a variety of dining options, with special emphasis on its farm-to-table restaurants.
Sports Teams
Austin is home to the University of Texas Longhorns and the Austin FC of Major League Soccer. Des Moines doesn't host any major league sports teams but offers minor league games via teams like the Iowa Cubs (baseball) and the Iowa Wolves (basketball).


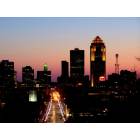
 Austin, TX
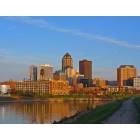
 Des Moines, IA