In a comparison between living in Austin, Texas, and El Toro, California, one must consider various factors such as crime and safety, cost of living, education, and more. Austin is the capital city of Texas, known for its vibrant live music scene and culinary diversity. El Toro, on the other hand, is a smaller community in California, known for its family-friendly environment and close-knit community. Herein, we dive into a comprehensive comparison of life in these two cities in the United States.
Austin maintains a higher crime rate compared to El Toro. The crime rate in Austin is 44 per one thousand residents whereas, in El Toro, it's significantly lower. That said, Austin is generally safe, with crime mostly concentrated in specific areas. El Toro is widely regarded as one of the safest cities in Cali, making it a great destination for families and retirees.
Cost of Living
The cost of living in El Toro, CA, is typically higher than in Austin, TX. Housing tends to be the most significant living cost difference - Austin is substantially more affordable in terms of home prices and rentals. Other expenses such as groceries, health, and transportation are also generally lower in Austin.
Income Tax
Texas, including Austin, has no state income tax, which is a significant advantage for residents. California has a progressive income tax, which could be considerable, depending on one's income level.
Property Tax
Both Texas and California have relatively high property tax rates, but with the median home price being significantly higher in El Toro, one could expect to pay more property tax in California.
Sales Tax
Sales tax in Austin is 8.25%, which includes the Texas state rate of 6.25% and the city's additional 2%. Alternatively, El Toro's sales tax is a touch higher, at a rate of 7.75%.
Income
Type
Austin
El Toro
Estimated median household income
$79,542
$132,724
Estimated per capita income
$53,937
$60,371
Cost of living index (U.S. average is 100)
96.4
95
If you make $50,000 in El Toro, you will have to make $50,737 in Austin to maintain the same standard of living.
Geographical Conditions
Austin features hill country terrain with lakes and rivers, making it ideal for outdoor activities. El Toro is situated in a valley surrounded by picturesque hills covered with residential development.
Geographical information
Type
Austin
El Toro
Land area
251.5 sq. miles
74.2 sq. miles
Population density
3,833.4 people per sq. mile
2,412 people per sq. mile
Elevation
501 feet
520 feet
Relative area comparison
Austin, TX El Toro, CA
Education
Both Austin and El Toro have excellent educational facilities. Austin, home to the University of Texas, boasts a wide array of educational options. El Toro, while smaller, has great schools (with many achieving high ratings) that are part of the Saddleback Valley Unified School District.
Austin's economy is booming, with a significant focus on the tech industry. It's known as a "miniature Silicon Valley," housing several tech giants like Dell and Apple. El Toro has a diversified economy, with education, health services, and professional services being significant sectors.
Biggest Employers
In Austin, the biggest employers are Dell, IBM, the University of Texas at Austin, and the City of Austin. Meanwhile, in El Toro, the top employers include the Saddleback Valley Unified School District and El Toro Water District.
In Austin (Travis County), 60.2% voted for Democrats and 36.2% for Republicans in 2012 Presidential Election. In El Toro (Orange County), 45.8% voted for Democrats and 52.0% for Republicans.
Elections
Type
Democrats
Republicans
Other
Year
Austin
El Toro
Austin
El Toro
Austin
El Toro
2020
71.7%
53.6%
26.5%
44.6%
1.8%
1.8%
2016
65.8%
50.9%
27.2%
42.4%
7.0%
6.7%
2012
60.2%
45.8%
36.2%
52.0%
3.6%
2.3%
2008
63.8%
47.8%
34.4%
50.3%
1.8%
1.9%
2004
56.1%
39.3%
42.1%
60.2%
1.8%
0.5%
2000
41.7%
40.4%
47.0%
55.9%
11.3%
3.7%
1996
52.4%
37.9%
40.0%
51.7%
7.7%
10.5%
Breakdown of population affiliated with a religious congregation
Type
Adherents
Congregations
Religion
Austin
El Toro
Austin
El Toro
CATHOLIC CHURCH
17.3%
26.5%
4.5%
4.4%
SOUTHERN BAPTIST CONVENTION
8.0%
2.3%
22.8%
8.8%
EPISCOPAL CHURCH
1.4%
0.4%
2.8%
1.4%
MUSLIM ESTIMATE
1.2%
0.8%
0.7%
1.3%
EVANGELICAL LUTHERAN CHURCH IN AMERICA
1.0%
0.4%
2.5%
2.3%
LUTHERAN CHURCH
0.9%
0.6%
2.1%
2.0%
SEVENTH DAY ADVENTIST CHURCH
0.2%
0.4%
1.0%
1.3%
REFORMED CHURCH IN AMERICA
0.0%
0.3%
0.0%
0.2%
Weather
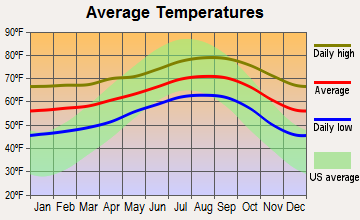
Weather-wise, Austin features a humid subtropical climate, with hot summers and relatively mild winters. El Toro enjoys Mediterranean-style weather characterized by warm summers and mild winters. It experiences significantly fewer days of extreme heat compared to Austin.
Weather and climate
Type
Austin
El Toro
Temperature - Average
68.5°F
63.3°F
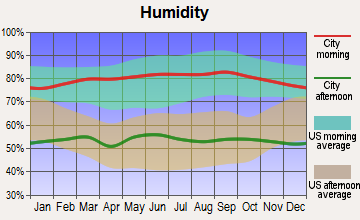
Humidity - Average morning or afternoon humidity
75.2%
68.9%
Humidity - Differences between morning and afternoon humidity
40%
24.8%
Humidity - Maximum monthly morning or afternoon humidity
89%
76.8%
Humidity - Minimum monthly morning or afternoon humidity
49%
52.1%
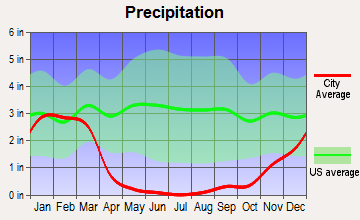
Precipitation - Yearly average
33.7 in
13.1 in
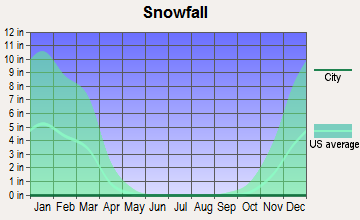
Snowfall - Yearly average
1.4 in
0 in
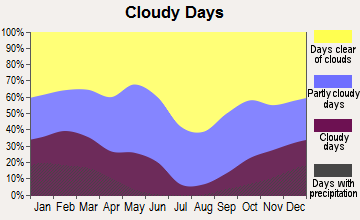
Clouds - Number of days clear of clouds
19.3%
26.7%
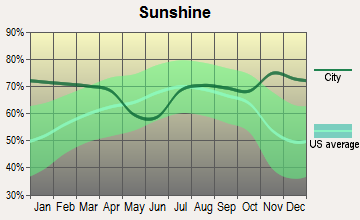
Sunshine amount - Average
63.3%
78.2%
Sunshine amount - Differences during a year
22%
21.7%
Sunshine amount - Maximum monthly
72%
84.3%
Sunshine amount - Minimum monthly
50%
62.6%
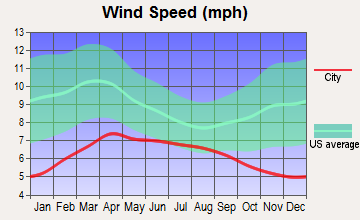
Wind speed - Average
7.2 mph
5.4 mph
Average climate in Austin, Texas
Average climate in El Toro, California
Air pollution
Type
AQI
CO
NO2
OZONE
PM10
PM25
SO2
Year
Austin
El Toro
Austin
El Toro
Austin
El Toro
Austin
El Toro
El Toro
Austin
El Toro
Austin
El Toro
2018
76
121
N/A
0.23
4.9
12.5
26.7
32.7
25.4
N/A
8.7
10.7
0.2
N/A
2017
76
123
N/A
0.25
4.6
12.3
29.7
33.4
25.7
N/A
8.3
12.9
0.3
N/A
2016
71
112
N/A
0.19
4.2
11.7
29.5
32.6
23.5
N/A
8.2
12.0
0.2
0.1
2015
78
123
N/A
0.16
4.4
12.4
28.9
31.8
23.5
N/A
8.6
13.7
0.3
0.1
2014
74
109
N/A
0.15
5.2
12.2
28.3
30.6
26.3
N/A
8.7
15.0
0.5
0.3
2013
78
110
0.09
0.21
5.5
12.7
29.5
29.2
27.2
N/A
8.6
12.9
0.5
0.2
2012
86
114
0.13
0.28
5.5
12.1
30.1
28.9
25.5
N/A
8.6
13.6
N/A
0.1
2011
83
129
0.11
0.19
2.6
13.3
33.0
29.5
26.5
N/A
9.1
14.5
N/A
0.3
2010
77
114
0.05
0.25
3.2
13.1
29.4
29.7
23.6
N/A
8.8
14.0
N/A
0.6
2009
76
134
0.05
0.20
2.6
15.2
29.7
30.4
25.2
N/A
9.0
14.6
N/A
1.1
2008
81
142
0.12
0.29
3.2
15.9
30.7
30.8
33.3
N/A
9.7
14.5
N/A
1.1
2007
82
116
0.12
0.27
3.1
16.0
27.1
29.7
N/A
N/A
9.8
N/A
N/A
0.8
2006
89
115
0.14
0.33
3.8
16.8
31.3
29.6
N/A
N/A
10.0
N/A
0.2
1.3
2005
92
113
0.15
0.31
4.4
16.9
29.0
29.4
N/A
N/A
10.7
N/A
0.2
1.3
2004
74
134
0.16
0.35
3.3
17.9
26.8
32.3
N/A
N/A
N/A
N/A
N/A
1.6
2003
85
133
0.26
0.44
4.2
20.9
28.9
30.2
N/A
N/A
N/A
N/A
0.1
1.1
2002
83
130
0.33
0.46
3.9
20.3
27.2
27.1
N/A
N/A
N/A
N/A
N/A
1.6
2001
83
140
0.31
0.57
4.2
20.5
25.5
27.0
N/A
N/A
N/A
N/A
N/A
1.4
2000
86
140
0.28
0.48
4.7
23.3
27.8
23.1
N/A
N/A
N/A
N/A
N/A
1.9
Natural disasters
Type
Austin
El Toro
Tornado activity compared to U.S. average
137.9%
18.6%
Earthquake activity compared to U.S. average
80.4%
6,916.9%
Natural disasters compared to U.S. average
29%
32%
Transportation
Austin is a car-centric city but also offers public transit options, including buses and a metro rail. El Toro residents, too, largely rely on cars; however, there are several public transit options available, with Orange County Transportation Authority providing the majority of services.
Transport
Type
Austin
El Toro
Amtrak stations
1
0
Amtrak stations nearby
1
3
FAA registered aircraft
911
0
FAA registered aircraft manufacturers and dealers
21
0
Means of transportation to work
Type
Austin
El Toro
Bicycle
0.8%
0.3%
Bus
1.5%
0.5%
Carpooled
7.9%
9.7%
Car alone
85.9%
83.4%
Motorcycle
0.3%
0.2%
Railroad
0%
0.2%
Taxicab
0.1%
0%
Walked
2%
0.6%
Average travel time to work
Type
Austin
El Toro
Average
29.9 min
25.6 min
Real Estate
Real estate in Austin is more affordable compared to El Toro. Austin offers a mix of downtown apartments, suburban homes, and luxury estates. El Toro mostly contains upper-middle-class residential properties.
Neighborhoods
Austin's neighborhoods offer a variety from hip, artsy areas like South Congress to more family-oriented ones like Round Rock. El Toro is made up of several charming, family-friendly neighborhoods, each offering a safe and quiet lifestyle.
Houses and residents
Type
Austin
El Toro
Houses
469,156
65,041
Average household size (people)
2.4
2.8
Houses occupied
449,399 (95.8%)
61,855 (95.1%)
Houses occupied by owners
196,458 (43.7%)
42,038 (68%)
Houses occupied by renters
252,941 (56.3%)
19,817 (32%)
Median rent asked for vacant for-rent units
$1,286
$3,113
Median price asked for vacant for-sale houses and condos
$549,769
$1,099,558
Estimated median house or condo value
$482,900
$956,652
Median number of rooms in apartments
3.4
3.9
Median number of rooms in houses and condos
6
6.1
Housing density (houses/condos per square mile)
1,865.3
876.6
Household income disparities
44.8%
35%
Housing units without a mortgage
1,799 (1.3%)
2,867 (7.8%)
Housing units with both a second mortgage and home equity loan
6,421 (4.8%)
154 (0.4%)
Housing units with a mortgage
132,628 (98.7%)
33,957 (92.2%)
Housing units with a home equity loan
206 (0.2%)
3,730 (10.1%)
Housing units with a second mortgage
8,515 (6.3%)
4,895 (13.3%)
Housing units lacking complete kitchen facilities
0.9%
0.3%
Housing units lacking complete plumbing facilities
Self-employed workers in own not incorporated business
38,777
7,511
State government workers
46,229
2,809
Unpaid family workers
102
330
Industries and Occupations
Once again, technology reigns in Austin, with a significant number of jobs in the sector. Others include healthcare and education. El Toro's largest industries include educational services, health care, and retail trade.
Austin is known for its excellent healthcare, featuring top medical establishments. Meanwhile, El Toro offers a high standard of health care services, with Mission Hospital being the nearest major hospital.
Health (county statistics)
Type
Austin
El Toro
General health status score of residents in this county from 1 (poor) to 5 (excellent)
Austin flaunts advanced infrastructure, being a major city. It boasts modern housing, commercial complexes, and a reliable utility system. El Toro, on the other hand, is characterized by its small-town charm but still maintains solid, dependable infrastructure.
Infrastructure
Type
Austin
El Toro
TV stations
20
2
Bank branches located here
264
4
Bank institutions located here
43
3
Nuclear power plants nearby
0
2
Culture and Food
Austin is a diverse city, known for its lively music scene and unique food culture – especially famed for its BBQ and Tex-Mex cuisine. El Toro, meanwhile, offers a mix of traditional, international and fusion California cuisine.
Sports Teams
Austin has recently welcomed Austin FC, its first major league soccer team while also being home to Texas Longhorns. It does not have any major league teams in other sports. El Toro residents typically root for Los Angeles based professional teams like the Lakers, Dodgers, and Rams.
 Austin, TX
 El Toro, CA