Austin, Texas, and Fayetteville, North Carolina, are both compelling cities to visit and potentially relocate to. Each city has its unique charm and appeal, along with a host of attributes that cater to diverse demographics. While Austin shines with its vibrant tech scene, entertainment, and robust economy, Fayetteville shows strengths in affordability, family-friendly neighborhoods, and lower taxes. The following comparison offers deeper insight into various aspects of these two cities.
Distance between
Austin, TX and
Fayetteville, NC : 1,141.3 miles
Austin's population is larger by 362%. Its population has grown by 307,615 people (46.9%) since 2000. The population of Fayetteville has grown by 87,763 people (72.5%) during that time.
Austin is generally safer than Fayetteville, with significantly lower violent crime rates. However, it does have relatively higher property crime rates due to its larger population and urbanization. Police in Austin have made efforts to launch community initiatives to curb this. On the other hand, Fayetteville is working to reduce its overall crime rate, with local police forces having established community watch programs.
City-data.com crime index counts serious crimes and violent crime more heavily. It adjusts for the number of visitors and daily workers commuting into cities. (higher means more crime, U.S. average = 301.1)
City-data.com crime index counts serious crimes and violent crime more heavily. It adjusts for the number of visitors and daily workers commuting into cities. (higher means more crime, U.S. average = 301.1)
Sex Offenders
According to our data, there are 1,411 registered sex offenders living in Austin and 609 registered sex offenders living in . The ratio of residents to sex offenders in Austin is 672 to 1; the ratio in Fayetteville is 336 to 1. The number of registered sex offenders compared to the number of residents is a smaller in Austin than in Fayetteville.
Cost of Living
Living in Austin is more costly than in Fayetteville. Housing, food, and healthcare costs are relatively higher in Austin. However, higher wages and job opportunities in the tech field can offset this. Fayetteville offers a more affordable cost of living which might be more appealing to families and retirees.
Income Tax
Texas does not impose a state income tax, making Austin an attractive city for high-income earners. North Carolina, on the other hand, has a flat state income tax imposed on Fayetteville residents.
Property Tax
Both cities impose property taxes. However, Austin's property tax rate is typically higher than Fayetteville's, commensurate with its higher property values.
Sales Tax
Texas does not have a state income tax, but its sales tax is higher than North Carolina's. Fayetteville has both a state and city sales tax but combined are still lower than Austin's.
Income
Type
Austin
Fayetteville
Estimated median household income
$79,542
$51,629
Estimated per capita income
$53,937
$27,983
Cost of living index (U.S. average is 100)
96.4
88.7
If you make $50,000 in Fayetteville, you will have to make $54,340 in Austin to maintain the same standard of living.
Geographical Conditions
Austin is located in Central Texas and has a hilly geographical landscape. Fayetteville is located in North Carolina's Sandhills and offers plenty of green spaces and parks.
Austin boasts stronger educational opportunities, hosting several reputable universities such as the University of Texas at Austin. Fayetteville has commendable educational options too, home to Fayetteville State University and a variety of community colleges. Both cities have solid public school systems for families with children.
Austin's economy is dynamic and expansive, notably in the technology and entertainment sectors. The job growth runs at a higher rate than the national average. Meanwhile, Fayetteville's economy is steady, influenced heavily by the military base Fort Bragg, healthcare, and education sectors.
Biggest Employers
In Austin, the largest employers include Dell, IBM, the University of Texas, and the city itself. In Fayetteville, the top employers are the Department of Defense (Fort Bragg), Cape Fear Valley Health System, and Cumberland County Public School System.
There were 4,180 building permits issued in Austin in 2012 (2467 more than in 2011) compared to 337 building permits issued in Fayetteville in 2012 (181 less than in 2011).
In Austin (Travis County), 60.2% voted for Democrats and 36.2% for Republicans in 2012 Presidential Election. In Fayetteville (Cumberland County), 59.5% voted for Democrats and 39.8% for Republicans.
Elections
Type
Democrats
Republicans
Other
Year
Austin
Fayetteville
Austin
Fayetteville
Austin
Fayetteville
2020
71.7%
57.6%
26.5%
41.0%
1.8%
1.4%
2016
65.8%
56.2%
27.2%
40.2%
7.0%
3.6%
2012
60.2%
59.5%
36.2%
39.8%
3.6%
0.7%
2008
63.8%
58.7%
34.4%
41.0%
1.8%
0.3%
2004
56.1%
48.1%
42.1%
51.6%
1.8%
0.3%
2000
41.7%
50.1%
47.0%
49.4%
11.3%
0.5%
1996
52.4%
49.2%
40.0%
44.8%
7.7%
5.9%
Breakdown of population affiliated with a religious congregation
Type
Adherents
Congregations
Religion
Austin
Fayetteville
Austin
Fayetteville
CATHOLIC CHURCH
17.3%
2.8%
4.5%
1.6%
SOUTHERN BAPTIST CONVENTION
8.0%
10.8%
22.8%
19.5%
EPISCOPAL CHURCH
1.4%
0.5%
2.8%
1.4%
MUSLIM ESTIMATE
1.2%
0.1%
0.7%
0.5%
EVANGELICAL LUTHERAN CHURCH IN AMERICA
1.0%
0.1%
2.5%
0.2%
LUTHERAN CHURCH
0.9%
0.1%
2.1%
0.2%
INTERNA PENTECO HOLINESS CHURCH
0.2%
2.6%
1.5%
4.5%
SEVENTH DAY ADVENTIST CHURCH
0.2%
0.4%
1.0%
0.7%
AMERICAN BAPTIST CHURCHES IN THE USA
0.1%
1.7%
0.1%
0.2%
Weather
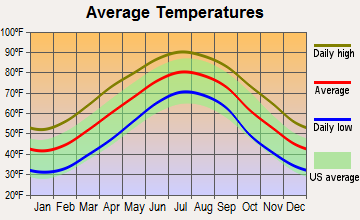
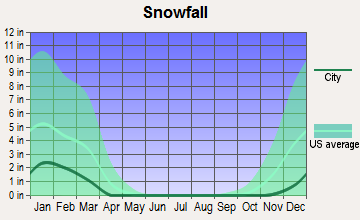
If you're a fan of warmer temperatures, Austin might be the city for you. With long, hot summers and mild winters, the climate here is more consistent. Fayetteville, however, experiences more distinct seasons, with humid summers and cool winters. Snowfall is rare, but it does occur.
Weather and climate
Type
Austin
Fayetteville
Temperature - Average
68.5°F
61.4°F
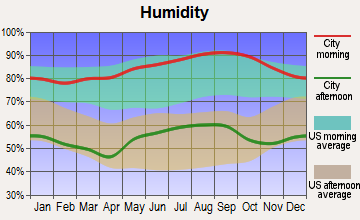
Humidity - Average morning or afternoon humidity
75.2%
74.1%
Humidity - Differences between morning and afternoon humidity
40%
42.8%
Humidity - Maximum monthly morning or afternoon humidity
89%
89.5%
Humidity - Minimum monthly morning or afternoon humidity
49%
46.7%
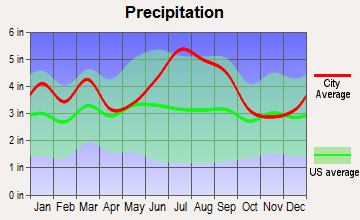
Precipitation - Yearly average
33.7 in
46.8 in
Snowfall - Yearly average
1.4 in
11.3 in
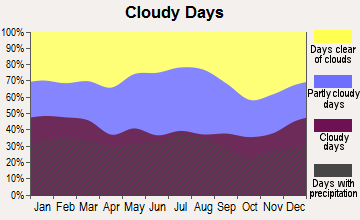
Clouds - Number of days clear of clouds
19.3%
18.4%
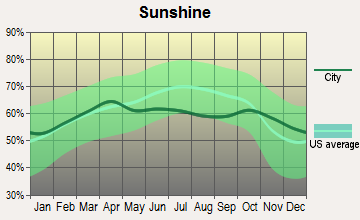
Sunshine amount - Average
63.3%
64.9%
Sunshine amount - Differences during a year
22%
13.1%
Sunshine amount - Maximum monthly
72%
65.7%
Sunshine amount - Minimum monthly
50%
52.6%
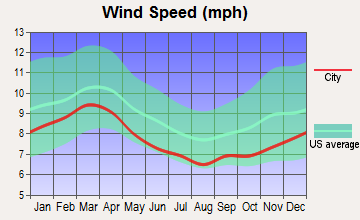
Wind speed - Average
7.2 mph
7.5 mph
Average climate in Austin, Texas
Average climate in Fayetteville, North Carolina
Air pollution
Type
AQI
CO
NO2
OZONE
PM10
PM25
SO2
Year
Austin
Fayetteville
Austin
Austin
Austin
Fayetteville
Fayetteville
Austin
Fayetteville
Austin
Fayetteville
2018
76
61
N/A
N/A
4.9
N/A
26.7
29.1
11.5
N/A
8.7
7.4
0.2
0.4
2017
76
67
N/A
N/A
4.6
N/A
29.7
32.9
11.5
N/A
8.3
9.0
0.3
N/A
2016
71
68
N/A
N/A
4.2
N/A
29.5
31.5
11.8
N/A
8.2
8.7
0.2
N/A
2015
78
60
N/A
N/A
4.4
N/A
28.9
29.5
N/A
N/A
8.6
7.1
0.3
0.1
2014
74
65
N/A
N/A
5.2
N/A
28.3
33.0
N/A
N/A
8.7
8.9
0.5
N/A
2013
78
65
0.09
N/A
5.5
N/A
29.5
28.4
N/A
N/A
8.6
8.5
0.5
N/A
2012
86
74
0.13
N/A
5.5
N/A
30.1
31.0
N/A
N/A
8.6
9.1
N/A
0.1
2011
83
80
0.11
N/A
2.6
N/A
33.0
33.9
N/A
N/A
9.1
10.7
N/A
N/A
2010
77
86
0.05
N/A
3.2
N/A
29.4
34.7
N/A
N/A
8.8
10.6
N/A
N/A
2009
76
75
0.05
N/A
2.6
N/A
29.7
31.1
N/A
N/A
9.0
10.5
N/A
1.1
2008
81
88
0.12
N/A
3.2
N/A
30.7
32.9
N/A
N/A
9.7
12.3
N/A
N/A
2007
82
93
0.12
N/A
3.1
N/A
27.1
35.5
N/A
N/A
9.8
13.7
N/A
N/A
2006
89
96
0.14
N/A
3.8
N/A
31.3
31.5
N/A
N/A
10.0
14.7
0.2
2.2
2005
92
125
0.15
N/A
4.4
N/A
29.0
34.5
N/A
N/A
10.7
N/A
0.2
N/A
2004
74
92
0.16
N/A
3.3
N/A
26.8
30.2
N/A
N/A
N/A
N/A
N/A
N/A
2003
85
92
0.26
N/A
4.2
N/A
28.9
31.9
N/A
N/A
N/A
N/A
0.1
N/A
2002
83
87
0.33
N/A
3.9
N/A
27.2
34.6
N/A
N/A
N/A
N/A
N/A
1.9
2001
83
124
0.31
N/A
4.2
N/A
25.5
36.3
N/A
N/A
N/A
N/A
N/A
N/A
2000
86
117
0.28
N/A
4.7
N/A
27.8
36.5
N/A
N/A
N/A
N/A
N/A
N/A
Natural disasters
Type
Austin
Fayetteville
Tornado activity compared to U.S. average
137.9%
112.7%
Earthquake activity compared to U.S. average
80.4%
49.2%
Natural disasters compared to U.S. average
29%
15%
Transportation
Public transportation is more robust in Austin, with options including buses, rail services, and a bike-share program. Commuting times can be longer due to traffic. Fayetteville's public transit consists mainly of buses, and commuting times are typically shorter.
Transport
Type
Austin
Fayetteville
Amtrak stations
1
1
Amtrak stations nearby
1
1
FAA registered aircraft
911
110
FAA registered aircraft manufacturers and dealers
21
4
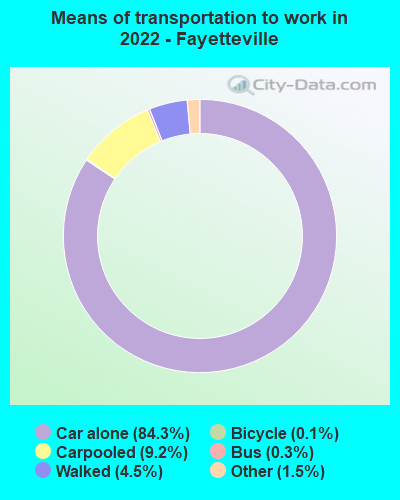
Means of transportation to work
Type
Austin
Fayetteville
Bicycle
0.8%
0.1%
Bus
1.5%
0.3%
Carpooled
7.9%
6.5%
Car alone
85.9%
87.8%
Motorcycle
0.3%
0.3%
Taxicab
0.1%
0.2%
Walked
2%
4%
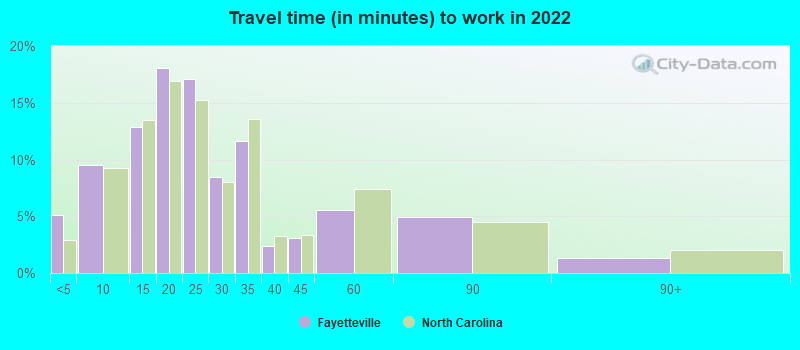
Average travel time to work
Type
Austin
Fayetteville
Average
29.9 min
24.4 min
Other means
22.7 min
21 min
Public transportation
37.9 min
42.6 min
Private vehicle occupancy
Type
Austin
Fayetteville
Average
1.1
1.1
Drove alone
91.2%
90.8%
In 2 person carpool
6.3%
7%
In 3 person carpool
1.7%
1.8%
In 4 person carpool
0.6%
0.1%
In 7+ person carpool
0.2%
0.2%
How many people usually rode to work in the car, truck or van.
Real Estate
Real estate in Austin is highly competitive and pricier, reflecting the city's growth and popularity. Fayetteville's real estate is more affordable, with a broad range of single-family homes that are ideal for families or retirees.
Neighborhoods
Austin's neighborhoods are eclectic, from the downtown hustle to quiet, suburban areas. In contrast, Fayetteville offers numerous family-friendly neighborhoods with a suburban feel and proximity to parks and schools.
Houses and residents
Type
Austin
Fayetteville
Houses
469,156
91,054
Average household size (people)
2.4
2.5
Median year apartment built
1997
1987
Median year house/condo built
1988
1982
Length of stay in the house since moving in
12.1 years
13.6 years
Houses occupied
449,399 (95.8%)
83,147 (91.3%)
Houses occupied by owners
196,458 (43.7%)
38,079 (45.8%)
Houses occupied by renters
252,941 (56.3%)
45,068 (54.2%)
Median rent asked for vacant for-rent units
$1,286
$571.42
Median monthly housing costs
$1,521
$1,041
Median price asked for vacant for-sale houses and condos
$549,769
$86,536
Estimated median house or condo value
$482,900
$150,200
Median numbers of rooms
4.4
5.4
Median number of rooms in apartments
3.4
4.4
Median number of rooms in houses and condos
6
6.4
Median house price - detached houses
$595,996
$214,819
Median house price - in 2-unit structures
$393,984
$152,480
Median house price - in 3-to-4-unit structures
$262,826
$234,147
Median house price - in 5 or more unit structures
$576,111
$194,723
Median house price - mobile homes
$56,102
$98,029
Median house price - Townhouses or other attached units
$459,657
$236,623
Median house price - All housing units
$571,154
$214,671
Median house age
28
38
Renting percentage
54.9%
49.7%
Housing density (houses/condos per square mile)
1,865.3
1,549.4
House value disparities
28.4%
32.9%
Household income disparities
44.8%
43.4%
Median household income for houses/condes with a mortgage
$141,177
$73,385
Median household income for apartments without a mortgage
$86,430
$56,188
Housing units without a mortgage
1,799 (1.3%)
726 (2.8%)
Housing units with both a second mortgage and home equity loan
6,421 (4.8%)
593 (2.3%)
Housing units with a mortgage
132,628 (98.7%)
25,293 (97.2%)
Housing units with a home equity loan
206 (0.2%)
67 (0.3%)
Housing units with a second mortgage
8,515 (6.3%)
1,240 (4.8%)
House/condo owner moved in on average (years ago)
9
12
House/condo renter moved in on average (years ago)
1
1
Housing units lacking complete kitchen facilities
0.9%
1.1%
Housing units lacking complete plumbing facilities
0.6%
1.6%
Housing units in structures
Housing units in structures
Austin
Fayetteville
One, detached
43.1%
60.8%
One, attached
5.2%
2.8%
Two
2.4%
4.2%
3 or 4
4.1%
5.2%
5 to 9
7.2%
8.9%
10 to 19
11.0%
8.5%
20 to 49
8.9%
5.0%
50 or more
17.2%
1.9%
Mobile homes
1.0%
2.8%
Median real estate property taxes paid for housing units
Self-employed workers in own not incorporated business
38,777
3,292
State government workers
46,229
4,673
Unpaid family workers
102
78
Industries and Occupations
In Austin, the dominant industries are technology, music, film, and start-ups. It's a city that attracts technical professionals, entrepreneurs, and artists. Conversely, in Fayetteville, the defense, healthcare, and education sectors are dominant, attracting military personnel, healthcare professionals, and educators.
Austin and Fayetteville both offer comprehensive healthcare services with Austin's healthcare facilities highly rated nationally. Fayetteville's health services are well-established, with several major medical centers.
Health (county statistics)
Type
Austin
Fayetteville
General health status score of residents in this county from 1 (poor) to 5 (excellent)
Austin's infrastructure is advanced, accommodating the city's booming technology industry. Public services are reliable, and the urban landscape is rapidly developing to accommodate growth. On the other hand, Fayetteville's infrastructure is more traditional, with needed amenities and services but less focus on high-tech amenities.
Infrastructure
Type
Austin
Fayetteville
Hospitals
65
16
TV stations
20
19
Arenas or stadiums
2
1
Bank branches located here
264
50
Bank institutions located here
43
13
Drinking water stations with no reported violations in the past
46
4
Drinking water stations with reported violations in the past
HMDA - Conventional home purchase loans - Applications denied
Year
Austin
Fayetteville
1999
4,733
1,353
2000
2,950
808
2001
2,038
603
2002
1,772
393
2003
2,213
355
2004
2,458
334
2005
3,121
401
2006
3,367
431
2007
2,560
299
2008
1,747
126
2009
1,067
93
Culture and Food
Austin is known for its thriving music scene, lively festivals, and diverse food options, spanning from food trucks to high-end dining. Fayetteville offers a rich history, military heritage, and a varied blend of Southern and international cuisine.
Sports Teams
Austin is home to an MLS team, the Austin FC, and the University of Texas sports teams. Fayetteville does not host any major league sports teams but takes pride in local college sports.


 Austin, TX
 Fayetteville, NC