Austin, Texas, and Little Rock, Arkansas, are two distinct cities each with their unique vibe, culture, and opportunities. Austin, renowned for its arts scene, high-tech industries, and progressive culture, is a bustling metropolis. Little Rock, on the other hand, provides a laid-back life with historical charm, outdoor activities, and lower cost of living. However, each city offers a distinct lifestyle, employment opportunities, healthcare, and cultural experiences. We'll delve into the specifics of each area to aid potential residents and tourists in making informed decisions.
Distance between
Austin, TX and
Little Rock, AR : 439.7 miles
Austin's population is larger by 377%. Its population has grown by 307,615 people (46.9%) since 2000. The population of Little Rock has grown by 18,865 people (10.3%) during that time.
When comparing crime rates, Little Rock's overall crime rate is higher than the national average; however, the city is taking considerable measures to improve safety. Austin, in contrast, has a slightly lower crime rate and is generally considered safer. It's worth noting that crime rates can vary significantly from neighborhood to neighborhood within both cities.
City-data.com crime index counts serious crimes and violent crime more heavily. It adjusts for the number of visitors and daily workers commuting into cities. (higher means more crime, U.S. average = 301.1)
City-data.com crime index counts serious crimes and violent crime more heavily. It adjusts for the number of visitors and daily workers commuting into cities. (higher means more crime, U.S. average = 301.1)
Sex Offenders
According to our data, there are 1,428 registered sex offenders living in Austin and 490 registered sex offenders living in . The ratio of residents to sex offenders in Austin is 664 to 1; the ratio in Little Rock is 405 to 1. The number of registered sex offenders compared to the number of residents is a smaller in Austin than in Little Rock.
Cost of Living
Despite significant growth, Little Rock maintains a lower cost of living compared to the national average. The cost of housing, groceries, and healthcare are more affordable than in Austin, where the cost of living is notably higher due to the booming tech sector and population growth.
Income Tax
Residents in Austin benefit from Texas's no state income tax policy. Conversely, Little Rock residents are subjected to Arkansas's state income tax.
Property Tax
Though Texas has no income tax, Austin residents face high property taxes. Little Rock, in contrast, imposes lower property taxes.
Sales Tax
Texas doesn't impose a state sales tax, giving Austin an advantage. Arkansas has a state sales tax, which boosts Little Rock's overall tax burden.
Income
Type
Austin
Little Rock
Estimated median household income
$79,542
$53,565
Estimated per capita income
$53,937
$39,600
Cost of living index (U.S. average is 100)
96.4
85.1
If you make $50,000 in Little Rock, you will have to make $56,639 in Austin to maintain the same standard of living.
Geographical Conditions
Austin is in the Texas Hill Country, known for its lakes and hiking opportunities. Little Rock features beautiful parks, the Arkansas River, and access to the Ouachita Mountains.
Austin is home to the reputed University of Texas and a high-performing public school district. Little Rock also has decent schools and houses the University of Arkansas at Little Rock. Education-wise, both cities provide good opportunities for families, students, and professionals seeking continued education.
Austin's economy is anchored by high-tech industries. The city is also a hub for startups. Little Rock has a diversified economy featuring government, healthcare, and banking. It's best to align your profession with the cities' primary industries for a successful career transition.
Biggest Employers
In Austin, some of the biggest employers include Dell, IBM, and the University of Texas. In Little Rock, the top employers are the state of Arkansas, the University of Arkansas for Medical Sciences (UAMS), and Baptist Health Hospitals.
There were 4,180 building permits issued in Austin in 2012 (2467 more than in 2011) compared to 666 building permits issued in Little Rock in 2012 (341 more than in 2011).
In Austin (Travis County), 60.2% voted for Democrats and 36.2% for Republicans in 2012 Presidential Election. In Little Rock (Pulaski County), 54.7% voted for Democrats and 43.3% for Republicans.
Elections
Type
Democrats
Republicans
Other
Year
Austin
Little Rock
Austin
Little Rock
Austin
Little Rock
2020
71.7%
60.5%
26.5%
37.8%
1.8%
1.7%
2016
65.8%
56.1%
27.2%
38.3%
7.0%
5.6%
2012
60.2%
54.7%
36.2%
43.3%
3.6%
2.0%
2008
63.8%
55.3%
34.4%
43.7%
1.8%
0.9%
2004
56.1%
55.2%
42.1%
44.4%
1.8%
0.4%
2000
41.7%
53.8%
47.0%
44.0%
11.3%
2.2%
1996
52.4%
58.8%
40.0%
35.1%
7.7%
6.2%
Breakdown of population affiliated with a religious congregation
Type
Adherents
Congregations
Religion
Austin
Little Rock
Austin
Little Rock
CATHOLIC CHURCH
17.3%
6.3%
4.5%
2.7%
SOUTHERN BAPTIST CONVENTION
8.0%
17.8%
22.8%
21.0%
EPISCOPAL CHURCH
1.4%
1.1%
2.8%
1.6%
MUSLIM ESTIMATE
1.2%
0.2%
0.7%
0.4%
EVANGELICAL LUTHERAN CHURCH IN AMERICA
1.0%
0.1%
2.5%
0.4%
LUTHERAN CHURCH
0.9%
0.5%
2.1%
1.3%
SEVENTH DAY ADVENTIST CHURCH
0.2%
0.4%
1.0%
0.9%
Weather
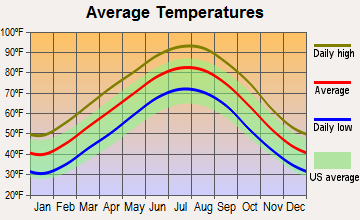
Austin experiences a hot, humid summer and milder winters. Those who prefer warmer weather would find Austin appealing. Little Rock experiences four distinct seasons, offering a cooler winter and generally less oppressive heat in the summer. Both cities face occasional severe weather conditions, with Austin prone to flash flooding and Little Rock exposed to tornadoes.
Weather and climate
Type
Austin
Little Rock
Temperature - Average
68.5°F
62.3°F
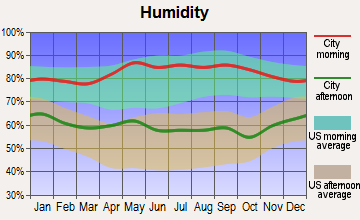
Humidity - Average morning or afternoon humidity
75.2%
76.2%
Humidity - Differences between morning and afternoon humidity
40%
35%
Humidity - Maximum monthly morning or afternoon humidity
89%
88%
Humidity - Minimum monthly morning or afternoon humidity
49%
53%
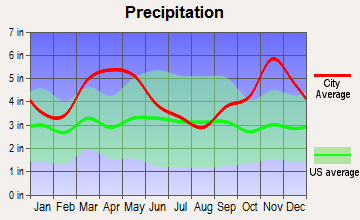
Precipitation - Yearly average
33.7 in
51.4 in
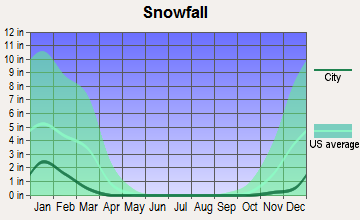
Snowfall - Yearly average
1.4 in
9.4 in
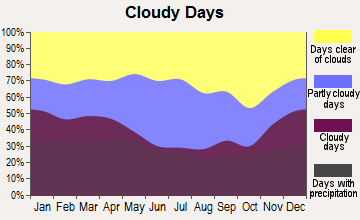
Clouds - Number of days clear of clouds
19.3%
19.8%
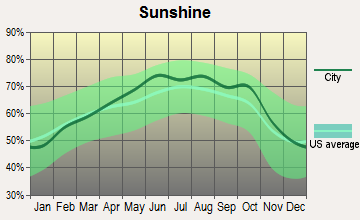
Sunshine amount - Average
63.3%
74%
Sunshine amount - Differences during a year
22%
30%
Sunshine amount - Maximum monthly
72%
82%
Sunshine amount - Minimum monthly
50%
52%
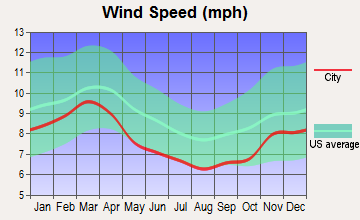
Wind speed - Average
7.2 mph
7.6 mph
Average climate in Austin, Texas
Average climate in Little Rock, Arkansas
Air pollution
Type
AQI
CO
NO2
OZONE
PM25
SO2
Year
Austin
Little Rock
Austin
Little Rock
Austin
Little Rock
Austin
Little Rock
Austin
Little Rock
Austin
Little Rock
2018
76
67
N/A
0.29
4.9
7.3
26.7
24.7
8.7
9.2
0.2
0.6
2017
76
70
N/A
0.41
4.6
7.6
29.7
25.5
8.3
9.5
0.3
0.6
2016
71
64
N/A
0.30
4.2
7.9
29.5
25.4
8.2
8.7
0.2
0.6
2015
78
64
N/A
0.31
4.4
8.6
28.9
22.8
8.6
9.0
0.3
1.1
2014
74
69
N/A
0.35
5.2
8.9
28.3
22.6
8.7
9.4
0.5
1.2
2013
78
70
0.09
0.39
5.5
9.8
29.5
24.7
8.6
9.5
0.5
1.3
2012
86
81
0.13
0.47
5.5
10.6
30.1
25.8
8.6
9.9
N/A
1.3
2011
83
81
0.11
0.45
2.6
10.0
33.0
25.5
9.1
11.3
N/A
1.4
2010
77
72
0.05
0.45
3.2
10.0
29.4
24.8
8.8
N/A
N/A
1.3
2009
76
62
0.05
0.42
2.6
9.1
29.7
22.0
9.0
N/A
N/A
1.7
2008
81
59
0.12
0.44
3.2
9.0
30.7
22.6
9.7
N/A
N/A
1.8
2007
82
75
0.12
0.59
3.1
10.8
27.1
22.1
9.8
N/A
N/A
3.2
2006
89
75
0.14
0.56
3.8
11.9
31.3
25.3
10.0
N/A
0.2
3.2
2005
92
87
0.15
0.39
4.4
12.1
29.0
24.1
10.7
N/A
0.2
1.5
2004
74
68
0.16
0.38
3.3
14.1
26.8
20.5
N/A
N/A
N/A
2.0
2003
85
78
0.26
0.47
4.2
14.3
28.9
22.0
N/A
N/A
0.1
2.3
2002
83
81
0.33
0.59
3.9
15.5
27.2
22.9
N/A
N/A
N/A
2.7
2001
83
82
0.31
N/A
4.2
10.4
25.5
25.9
N/A
N/A
N/A
N/A
2000
86
78
0.28
N/A
4.7
10.2
27.8
26.0
N/A
N/A
N/A
N/A
Natural disasters
Type
Austin
Little Rock
Tornado activity compared to U.S. average
137.9%
253.3%
Earthquake activity compared to U.S. average
80.4%
579.4%
Natural disasters compared to U.S. average
29%
26%
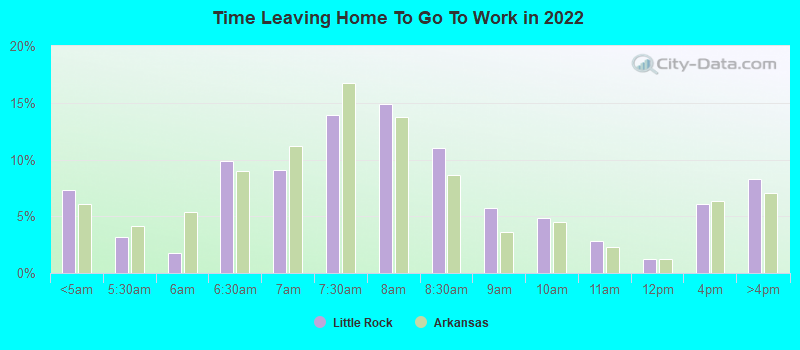
Transportation
Both cities offer public transit systems, and Austin has invested in transportation infrastructure to cope with its rapid growth. The commute time in Austin is longer than in Little Rock due to its larger size and population.
Transport
Type
Austin
Little Rock
Amtrak stations
1
1
Amtrak stations nearby
1
1
FAA registered aircraft
911
259
FAA registered aircraft manufacturers and dealers
21
35
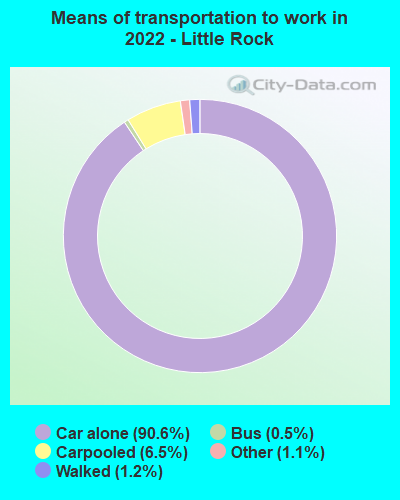
Means of transportation to work
Type
Austin
Little Rock
Bicycle
0.8%
0.1%
Bus
1.5%
0.4%
Carpooled
7.9%
9.7%
Car alone
85.9%
88.1%
Motorcycle
0.3%
0.1%
Taxicab
0.1%
0.3%
Walked
2%
0.9%
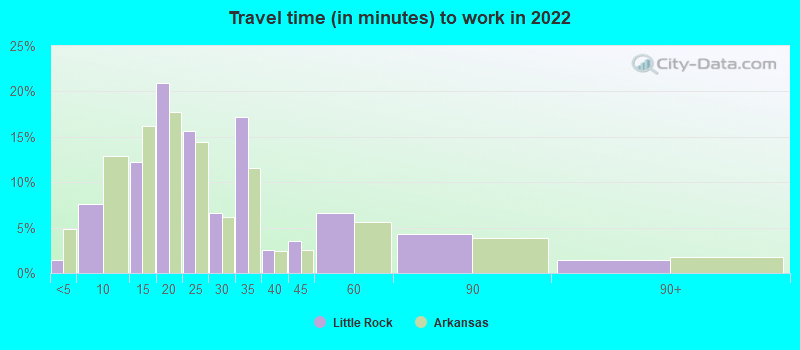
Average travel time to work
Type
Austin
Little Rock
Average
29.9 min
26 min
Other means
22.7 min
20 min
Public transportation
37.9 min
36.2 min
Private vehicle occupancy
Type
Austin
Little Rock
Average
1.1
1.2
Drove alone
91.2%
87.6%
In 2 person carpool
6.3%
8.3%
In 3 person carpool
1.7%
1.3%
In 4 person carpool
0.6%
0.9%
In 5-6 person carpool
0.1%
1.5%
In 7+ person carpool
0.2%
0.3%
How many people usually rode to work in the car, truck or van.
Real Estate
Real estate in Austin is growing robustly, but prices are significantly higher than in Little Rock. In contrast, Little Rock offers a lower cost of home ownership.
Neighborhoods
Both cities have charming neighborhoods. Austin's include the trendy East Austin and the upscale Westlake. Little Rock has the historic Quapaw Quarter and the scenic Hillcrest.
Houses and residents
Type
Austin
Little Rock
Houses
469,156
99,876
Average household size (people)
2.4
2.3
Median year apartment built
1997
1981
Median year house/condo built
1988
1977
Length of stay in the house since moving in
12.1 years
12.9 years
Houses occupied
449,399 (95.8%)
89,422 (89.5%)
Houses occupied by owners
196,458 (43.7%)
49,236 (55.1%)
Houses occupied by renters
252,941 (56.3%)
40,186 (44.9%)
Median rent asked for vacant for-rent units
$1,286
$706.04
Median monthly housing costs
$1,521
$990
Median price asked for vacant for-sale houses and condos
$549,769
$243,385
Estimated median house or condo value
$482,900
$191,700
Median numbers of rooms
4.4
5.3
Median number of rooms in apartments
3.4
3.9
Median number of rooms in houses and condos
6
6.3
Median house price - detached houses
$595,996
$274,395
Median house price - in 2-unit structures
$393,984
$152,806
Median house price - in 3-to-4-unit structures
$262,826
$175,185
Median house price - in 5 or more unit structures
$576,111
$451,067
Median house price - mobile homes
$56,102
$35,528
Median house price - Townhouses or other attached units
$459,657
$160,142
Median house price - All housing units
$571,154
$271,664
Median house age
28
43
Renting percentage
54.9%
43.8%
Housing density (houses/condos per square mile)
1,865.3
859.5
House value disparities
28.4%
43.1%
Household income disparities
44.8%
49.3%
Median household income for houses/condes with a mortgage
$141,177
$98,030
Median household income for apartments without a mortgage
$86,430
$64,425
Housing units without a mortgage
1,799 (1.3%)
623 (1.9%)
Housing units with both a second mortgage and home equity loan
6,421 (4.8%)
1,588 (4.8%)
Housing units with a mortgage
132,628 (98.7%)
32,138 (98.1%)
Housing units with a home equity loan
206 (0.2%)
75 (0.2%)
Housing units with a second mortgage
8,515 (6.3%)
2,366 (7.2%)
House/condo owner moved in on average (years ago)
9
11
House/condo renter moved in on average (years ago)
1
1
Housing units lacking complete kitchen facilities
0.9%
2.1%
Housing units lacking complete plumbing facilities
0.6%
0.8%
Housing units in structures
Housing units in structures
Austin
Little Rock
One, detached
43.1%
61.4%
One, attached
5.2%
2.2%
Two
2.4%
1.9%
3 or 4
4.1%
4.1%
5 to 9
7.2%
8.6%
10 to 19
11.0%
4.9%
20 to 49
8.9%
3.8%
50 or more
17.2%
11.2%
Mobile homes
1.0%
2.0%
Median real estate property taxes paid for housing units
Self-employed workers in own not incorporated business
38,777
4,725
State government workers
46,229
9,860
Unpaid family workers
102
160
Industries and Occupations
In Austin, the thriving tech industry offers job opportunities in various fields. Little Rock is predominantly governmental and healthcare focussed. Both cities have a long-standing commitment to small businesses and entrepreneurship.
Both cities provide good healthcare with major hospitals and medical centers. However, Austin's healthcare is more highly ranked nationally than Little Rock's.
Health (county statistics)
Type
Austin
Little Rock
General health status score of residents in this county from 1 (poor) to 5 (excellent)
Austin is known for its modern infrastructure with well-planned highways and rapid population growth. Little Rock's infrastructure is less developed. Though both cities are investing in infrastructure development, Austin's initiatives stand out to accommodate its substantial growth.
Infrastructure
Type
Austin
Little Rock
Hospitals
65
15
TV stations
20
17
Arenas or stadiums
2
2
Bank branches located here
264
139
Bank institutions located here
43
29
Main business address for public companies
44
4
Drinking water stations with no reported violations in the past
46
0
Drinking water stations with reported violations in the past
HMDA - Conventional home purchase loans - Applications denied
Year
Austin
Little Rock
1999
4,733
842
2000
2,950
792
2001
2,038
634
2002
1,772
365
2003
2,213
510
2004
2,458
581
2005
3,121
837
2006
3,367
881
2007
2,560
503
2008
1,747
230
2009
1,067
114
Culture and Food
Austin is famous for its vibrant music scene, cultural festivals, and diverse dining options. Little Rock features historical museums, performing arts venues, and southern cuisine.
Sports Teams
Austin has a strong sports scene, including the University of Texas Longhorns. Little Rock residents enjoy local college sports teams as the city lacks major league teams.


 Austin, TX
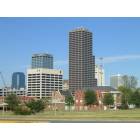
 Little Rock, AR