Austin, TX and Norfolk, VA are two diverse cities with a rich heritage, cultural variation, and economic vibrancy. Each offers residents and tourists a unique experience with distinct contrasts in climate, economy, transportation, cultural atmosphere, and overall living standards. Austin, a fast-growing technology hub, is known for its exhilarating live music scene, while Norfolk is famous for its strong naval history, beautiful beaches, and historic landmarks.
Distance between
Austin, TX and
Norfolk, VA : 1,314.1 miles
Austin's population is larger by 310%. Its population has grown by 307,615 people (46.9%) since 2000. The population of Norfolk has grown by 686 people (0.3%) during that time.
Austin's crime rate is somewhat higher than in Norfolk, particularly in property crime, which is a vital aspect to consider in terms of safety for residents and tourists alike. According to Neighborhood Scout, Austin's property crime rates are higher compared to national average. However, violent crime rates are lower in both cities compared to the national average. Norfolk also sees its share of crime but maintains a robust police force and numerous neighborhood watch programs. Always remember that safety levels vary across neighborhoods and staying aware of your surroundings is helpful no matter where you are.
City-data.com crime index counts serious crimes and violent crime more heavily. It adjusts for the number of visitors and daily workers commuting into cities. (higher means more crime, U.S. average = 301.1)
City-data.com crime index counts serious crimes and violent crime more heavily. It adjusts for the number of visitors and daily workers commuting into cities. (higher means more crime, U.S. average = 301.1)
Sex Offenders
According to our data, there are 1,411 registered sex offenders living in Austin and 868 registered sex offenders living in . The ratio of residents to sex offenders in Austin is 672 to 1; the ratio in Norfolk is 282 to 1. The number of registered sex offenders compared to the number of residents is a smaller in Austin than in Norfolk.
Cost of Living
Austin's cost of living is higher than in Norfolk, largely due to housing costs. Austin's booming tech industry has driven up housing prices, putting the city at a higher than average cost of living compared to U.S cities. On the other hand, the cost of living in Norfolk is slightly below the national average.
Income Tax
As previously mentioned, Texas, and thus Austin, does not have state income tax. On the other hand, Virginia (and therefore Norfolk) operates on a sliding scale for state income tax, ranging from 2% to 5.75%.
Property Tax
Both cities have property taxes, which fund public services like education and infrastructure enhancement. Austin's property tax rates are relatively high, while Norfolk's are lower in comparison.
Sales Tax
Austin and Texas at large do not have state income tax, which is attractive to many potential residents. However, they do have a comparatively higher sales tax rate of 8.25%. Norfolk, with a sales tax of 6%, is comparatively lower, but Virginia does levy a state income tax.
Income
Type
Austin
Norfolk
Estimated median household income
$79,542
$58,591
Estimated per capita income
$53,937
$33,362
Cost of living index (U.S. average is 100)
96.4
96.6
If you make $50,000 in Austin, you will have to make $50,104 in Norfolk to maintain the same standard of living.
Geographical Conditions
Austin is situated in central Texas and has varied terrain, consisting of both hill country and lakes. Norfolk, on the eastern coast of Virginia, offers a mix of city life and beachfront, with close proximity to the Chesapeake Bay and Atlantic Ocean.
Both cities have robust educational systems. Austin, home to the University of Texas, boasts a strong educational foundation with numerous top high schools and universities. Norfolk houses top-shelf institutions like Eastern Virginia Medical School and the prestigious Norfolk State University. The cities also support various vocational and alternative education programs.
Austin's economy is growing quickly, thanks largely to its booming tech industry. It's home to many established tech companies and startups. Norfolk's economy, on the other hand, is deeply tied to its port and military installations. Norfolk's sea port is one of the busiest on the East Coast, and the city is home to the largest naval base in the world.
Biggest Employers
Many multinational corporations call Austin home, such as Dell, IBM, and Amazon. On the other hand, Norfolk's largest employers include the US Department of Defense, Sentara Healthcare, and Norfolk City Public Schools.
There were 4,180 building permits issued in Austin in 2012 (2467 more than in 2011) compared to 303 building permits issued in Norfolk in 2012 (78 more than in 2011).
In Austin (Travis County), 60.2% voted for Democrats and 36.2% for Republicans in 2012 Presidential Election. In Norfolk (Norfolk city), 72.5% voted for Democrats and 26.8% for Republicans.
Elections
Type
Democrats
Republicans
Other
Year
Austin
Norfolk
Austin
Norfolk
Austin
Norfolk
2020
71.7%
71.7%
26.5%
26.1%
1.8%
2.2%
2016
65.8%
68.4%
27.2%
25.8%
7.0%
5.8%
2012
60.2%
72.5%
36.2%
26.8%
3.6%
0.8%
2008
63.8%
71.5%
34.4%
28.2%
1.8%
0.3%
2004
56.1%
61.7%
42.1%
37.4%
1.8%
0.9%
2000
41.7%
61.8%
47.0%
35.5%
11.3%
2.7%
1996
52.4%
62.6%
40.0%
31.1%
7.7%
6.3%
Breakdown of population affiliated with a religious congregation
Type
Adherents
Congregations
Religion
Austin
Norfolk
Austin
Norfolk
CATHOLIC CHURCH
17.3%
4.7%
4.5%
2.6%
SOUTHERN BAPTIST CONVENTION
8.0%
6.3%
22.8%
11.6%
EPISCOPAL CHURCH
1.4%
2.0%
2.8%
3.7%
MUSLIM ESTIMATE
1.2%
4.2%
0.7%
1.1%
EVANGELICAL LUTHERAN CHURCH IN AMERICA
1.0%
0.6%
2.5%
1.1%
LUTHERAN CHURCH
0.9%
0.2%
2.1%
1.1%
PRESBYTERIAN CHURCH IN AMERICA
0.2%
0.3%
0.6%
1.5%
SEVENTH DAY ADVENTIST CHURCH
0.2%
0.4%
1.0%
0.7%
AMERICAN BAPTIST CHURCHES IN THE USA
0.1%
3.4%
0.1%
3.7%
Weather
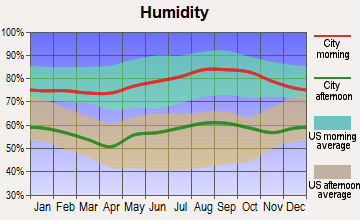
Austin offers a more moderate climate, with ideal weather conditions in the spring and fall, hot summers, and mild winters. Norfolk, however, showcases the distinct seasons of the East Coast with hot, humid summers and cold winters. Norfolk is also at risk for hurricanes and tropical storms, which can be a major consideration for those planning to move or visit.
Weather and climate
Type
Austin
Norfolk
Temperature - Average
68.5°F
59.6°F
Humidity - Average morning or afternoon humidity
75.2%
73%
Humidity - Differences between morning and afternoon humidity
40%
32%
Humidity - Maximum monthly morning or afternoon humidity
89%
83%
Humidity - Minimum monthly morning or afternoon humidity
49%
51%
Precipitation - Yearly average
33.7 in
46.3 in
Snowfall - Yearly average
1.4 in
15.4 in
Clouds - Number of days clear of clouds
19.3%
17.6%
Sunshine amount - Average
63.3%
66.8%
Sunshine amount - Differences during a year
22%
14%
Sunshine amount - Maximum monthly
72%
67%
Sunshine amount - Minimum monthly
50%
53%
Wind speed - Average
7.2 mph
10.4 mph
Average climate in Austin, Texas
Average climate in Norfolk, Virginia
Air pollution
Type
AQI
CO
NO2
OZONE
PB
PM25
SO2
Year
Austin
Norfolk
Austin
Norfolk
Austin
Norfolk
Austin
Norfolk
Norfolk
Austin
Norfolk
Austin
Norfolk
2018
76
57
N/A
0.29
4.9
7.0
26.7
30.9
0.002
N/A
8.7
6.1
0.2
0.3
2017
76
60
N/A
0.23
4.6
7.6
29.7
33.0
0.002
N/A
8.3
6.9
0.3
0.3
2016
71
66
N/A
0.22
4.2
7.3
29.5
31.5
0.002
N/A
8.2
6.1
0.2
0.3
2015
78
57
N/A
0.27
4.4
8.1
28.9
33.5
0.002
N/A
8.6
6.4
0.3
0.5
2014
74
59
N/A
0.28
5.2
8.3
28.3
33.5
0.002
N/A
8.7
6.8
0.5
1.2
2013
78
66
0.09
0.28
5.5
7.8
29.5
30.9
0.002
N/A
8.6
6.8
0.5
1.2
2012
86
76
0.13
0.30
5.5
8.4
30.1
34.2
0.002
N/A
8.6
8.1
N/A
1.2
2011
83
66
0.11
0.27
2.6
10.2
33.0
34.8
0.003
N/A
9.1
8.8
N/A
1.7
2010
77
80
0.05
0.24
3.2
6.4
29.4
38.2
0.004
N/A
8.8
N/A
N/A
2.2
2009
76
54
0.05
0.24
2.6
9.8
29.7
31.5
0.012
N/A
9.0
N/A
N/A
2.5
2008
81
77
0.12
0.24
3.2
10.3
30.7
36.2
0.004
N/A
9.7
N/A
N/A
3.5
2007
82
81
0.12
0.17
3.1
12.2
27.1
36.4
0.004
N/A
9.8
N/A
N/A
4.6
2006
89
62
0.14
0.34
3.8
N/A
31.3
36.3
0.004
N/A
10.0
N/A
0.2
3.4
2005
92
67
0.15
0.28
4.4
N/A
29.0
35.5
N/A
N/A
10.7
N/A
0.2
3.5
2004
74
80
0.16
0.29
3.3
15.9
26.8
33.4
N/A
N/A
N/A
N/A
N/A
4.4
2003
85
84
0.26
0.33
4.2
16.2
28.9
34.3
N/A
N/A
N/A
N/A
0.1
4.1
2002
83
99
0.33
0.41
3.9
17.8
27.2
38.0
N/A
N/A
N/A
N/A
N/A
6.4
2001
83
92
0.31
0.41
4.2
18.2
25.5
36.4
N/A
N/A
N/A
N/A
N/A
6.3
2000
86
85
0.28
0.43
4.7
15.7
27.8
36.6
N/A
N/A
N/A
N/A
N/A
6.8
Natural disasters
Type
Austin
Norfolk
Tornado activity compared to U.S. average
137.9%
69.9%
Earthquake activity compared to U.S. average
80.4%
36.4%
Natural disasters compared to U.S. average
29%
0%
Transportation
Austin offers numerous public transport options, including buses and commuter rails, while ride-hailing services like Uber and Lyft are also popular. Norfolk also provides comprehensive bus services and operates The Tide, a light rail commuter system.
Transport
Type
Austin
Norfolk
Amtrak stations
1
1
Amtrak stations nearby
1
3
FAA registered aircraft
911
106
FAA registered aircraft manufacturers and dealers
21
4
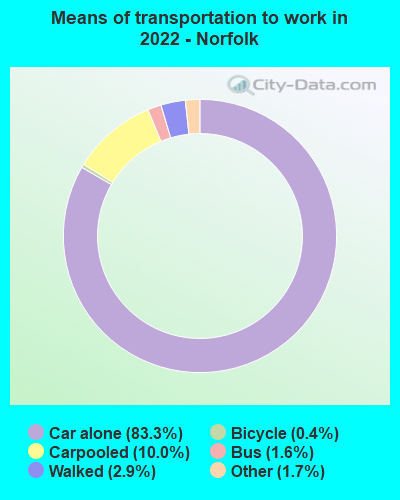
Means of transportation to work
Type
Austin
Norfolk
Bicycle
0.8%
0.4%
Bus
1.5%
1.7%
Carpooled
7.9%
9.2%
Car alone
85.9%
83%
Motorcycle
0.3%
0.2%
Taxicab
0.1%
0.3%
Walked
2%
4.1%
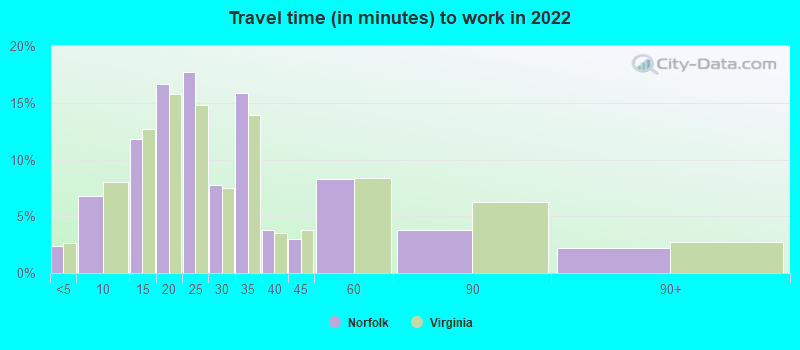
Average travel time to work
Type
Austin
Norfolk
Average
29.9 min
26.5 min
Other means
22.7 min
21.4 min
Public transportation
37.9 min
43.4 min
Private vehicle occupancy
Type
Austin
Norfolk
Average
1.1
1.1
Drove alone
91.2%
89.2%
In 2 person carpool
6.3%
8.4%
In 3 person carpool
1.7%
1.6%
In 4 person carpool
0.6%
0.3%
In 5-6 person carpool
0.1%
0.4%
In 7+ person carpool
0.2%
0%
How many people usually rode to work in the car, truck or van.
Real Estate
Austin's real estate market is robust and competitive, driven by the city's rapid growth and job opportunities. It's considered one of the hottest real estate markets in the country. In contrast, Norfolk's real estate market is more affordable, but it has seen steady growth in recent years.
Neighborhoods
Austin neighborhoods range from vibrant downtown areas to calm, suburban locales. Each neighborhood has a unique vibe, scenery, and amenities. Norfolk also offers a rich neighborhood diversity, from beach-front locations to family-friendly suburbs.
Houses and residents
Type
Austin
Norfolk
Houses
469,156
102,423
Average household size (people)
2.4
2.4
Median year apartment built
1997
1970
Median year house/condo built
1988
1958
Length of stay in the house since moving in
12.1 years
12.3 years
Houses occupied
449,399 (95.8%)
97,596 (95.3%)
Houses occupied by owners
196,458 (43.7%)
44,867 (46%)
Houses occupied by renters
252,941 (56.3%)
52,729 (54%)
Median rent asked for vacant for-rent units
$1,286
$517.27
Median monthly housing costs
$1,521
$1,196
Median price asked for vacant for-sale houses and condos
$549,769
$166,683
Estimated median house or condo value
$482,900
$250,300
Median numbers of rooms
4.4
5.3
Median number of rooms in apartments
3.4
4.2
Median number of rooms in houses and condos
6
6.6
Median house price - detached houses
$595,996
$306,640
Median house price - in 2-unit structures
$393,984
$250,782
Median house price - in 3-to-4-unit structures
$262,826
$117,518
Median house price - in 5 or more unit structures
$576,111
$260,910
Median house price - mobile homes
$56,102
$23,245
Median house price - Townhouses or other attached units
$459,657
$267,013
Median house price - All housing units
$571,154
$296,270
Median house age
28
56
Renting percentage
54.9%
54.6%
Housing density (houses/condos per square mile)
1,865.3
1,906.3
House value disparities
28.4%
33.9%
Household income disparities
44.8%
44.5%
Median household income for houses/condes with a mortgage
$141,177
$101,012
Median household income for apartments without a mortgage
$86,430
$66,099
Housing units without a mortgage
1,799 (1.3%)
741 (2.2%)
Housing units with both a second mortgage and home equity loan
6,421 (4.8%)
1,418 (4.1%)
Housing units with a mortgage
132,628 (98.7%)
33,471 (97.8%)
Housing units with a home equity loan
206 (0.2%)
128 (0.4%)
Housing units with a second mortgage
8,515 (6.3%)
2,277 (6.7%)
House/condo owner moved in on average (years ago)
9
9
House/condo renter moved in on average (years ago)
1
1
Housing units lacking complete kitchen facilities
0.9%
1.8%
Housing units lacking complete plumbing facilities
0.6%
1%
Housing units in structures
Housing units in structures
Austin
Norfolk
One, detached
43.1%
48.2%
One, attached
5.2%
7.7%
Two
2.4%
4.8%
3 or 4
4.1%
10.2%
5 to 9
7.2%
10.1%
10 to 19
11.0%
6.0%
20 to 49
8.9%
4.1%
50 or more
17.2%
8.2%
Mobile homes
1.0%
0.7%
Median real estate property taxes paid for housing units
Self-employed workers in own not incorporated business
38,777
4,402
State government workers
46,229
5,009
Unpaid family workers
102
102
Industries and Occupations
In Austin, the major industries include technology, pharmaceuticals, biotechnology, film and music, and education. In contrast, Norfolk's key industries are military, maritime (including shipping and ship repair), healthcare and education.
Both cities have strong healthcare infrastructures. Austin is home to several major hospitals, including the nationally ranked Dell Seton Medical Center. Norfolk is home to Sentara Norfolk General Hospital and the regionally renowned Children's Hospital of The King's Daughters.
Health (county statistics)
Type
Austin
Norfolk
General health status score of residents in this county from 1 (poor) to 5 (excellent)
Austin boasts an ever-evolving infrastructure with improved roads, bridges, and public buildings to accommodate its rapid development. Norfolk, though not as rapidly developing, has a robust infrastructure primarily centered around its maritime and military presence, including ports, naval bases, and shipyards.
Infrastructure
Type
Austin
Norfolk
Hospitals
65
13
TV stations
20
26
Arenas or stadiums
2
1
Bank branches located here
264
59
Bank institutions located here
43
14
Main business address for public companies
44
4
Nuclear power plants nearby
0
2
Drinking water stations with no reported violations in the past
46
1
Drinking water stations with reported violations in the past
HMDA - Conventional home purchase loans - Applications denied
Year
Austin
Norfolk
1999
4,733
0
2000
2,950
0
2001
2,038
0
2002
1,772
0
2003
2,213
520
2004
2,458
804
2005
3,121
854
2006
3,367
929
2007
2,560
604
2008
1,747
223
2009
1,067
92
Culture and Food
Austin's culture is firmly rooted in music, with the city being known as the "Live Music Capital of the World". Its food scene is vibrant, with a prominent focus on barbecues and Tex-Mex cuisine. Norfolk offers a rich culture influenced by its naval history and coastal location. Its food scene bursts with seafood delicacies and locally brewed craft beer.
Sports Teams
Austin, previously lacking a major professional sports team, recently welcomed Austin FC to the Major League Soccer. On the other hand, Norfolk does not host any major league professional sports teams but is home to the Norfolk Tides Minor League Baseball team and the Norfolk Admirals Minor League Hockey team.


 Austin, TX
 Norfolk, VA