Austin, Texas, and Pittsburgh, Pennsylvania, offer different lifestyles and opportunities, making them unique relocation or vacation destinations. This comparison will delve into aspects such as safety, education, economy, and culture to give a comprehensive view of what each city offers. Both cities have vibrant cultures and differing climates, with Austin boasting a lower cost of living, while Pittsburgh is renowned for its excellent healthcare facilities and superior education standards.
Distance between
Austin, TX and
Pittsburgh, PA : 1,218.1 miles
Austin's population is larger by 221%. Its population has grown by 307,615 people (46.9%) since 2000. The population of Pittsburgh has decreased by 34,132 people (10.2%) during that time.
Austin is generally safer than Pittsburgh. However, both cities have areas where crime is higher, as with any metropolitan area. According to Neighborhood Scout, Austin's crime rates are lower than both the Texas and national average. Pittsburgh's crime rate is higher than the Pennsylvania average but generally below the national average. As a newcomer to either city, it's advisable to research the safer neighborhoods to ensure a secure living environment.
City-data.com crime index counts serious crimes and violent crime more heavily. It adjusts for the number of visitors and daily workers commuting into cities. (higher means more crime, U.S. average = 301.1)
City-data.com crime index counts serious crimes and violent crime more heavily. It adjusts for the number of visitors and daily workers commuting into cities. (higher means more crime, U.S. average = 301.1)
Sex Offenders
According to our data, there are 1,407 registered sex offenders living in Austin and 695 registered sex offenders living in . The ratio of residents to sex offenders in Austin is 674 to 1; the ratio in Pittsburgh is 437 to 1. The number of registered sex offenders compared to the number of residents is a smaller in Austin than in Pittsburgh.
Cost of Living
Living in Austin is generally cheaper than Pittsburgh across numerous categories, including healthcare, utilities, and groceries. However, real estate prices are higher in Austin, leading to higher overall living costs. Pittsburgh might be a more affordable place to live when considering housing expenses.
Income Tax
No state income tax is imposed in Texas, including Austin, which is a huge relief for residents. However, Pittsburgh, like other Pennsylvania cities, levies a flat rate of 3.07% as state income tax.
Property Tax
Property tax in both cities varies depending upon the specific community and local tax rates. Texas's property tax rates are generally higher, making property tax payments in Austin more hefty than in Pittsburgh.
Sales Tax
Texas, including Austin, does not levy state income tax, which can be an enticing factor for potential residents. Pittsburgh residents pay Pennsylvania’s state income tax rate of 3.07%. However, sales tax in Austin, at a combined state and local rate, is higher than that in Pittsburgh.
Income
Type
Austin
Pittsburgh
Estimated median household income
$79,542
$57,821
Estimated per capita income
$53,937
$39,779
Cost of living index (U.S. average is 100)
96.4
95.2
If you make $50,000 in Pittsburgh, you will have to make $50,630 in Austin to maintain the same standard of living.
Geographical Conditions
Austin is characterized by its rolling hills, lakes, and river systems, providing ample outdoor recreational activities. Pittsburgh is known for its hills and rivers, making it an appealing choice for outdoor enthusiasts, with added charm of historic architecture spread across the city's landscape.
Pittsburgh holds an educational advantage with a robust public school system and numerous well-regarded universities, including Carnegie Mellon and the University of Pittsburgh. Austin also offers quality education, with the University of Texas in Austin being a premier institution. Nonetheless, Pittsburgh is generally considered to have a more prestigious academics reputation.
A thriving tech sector and steady job growth rate drive Austin's economy, making it attractive for job seekers in tech-related fields. Pittsburgh's economy is diversified, with healthcare, education, and finance sectors making significant contributions. Both cities offer strong job markets, but opportunities may vary depending on the particular industry.
Biggest Employers
In Austin, Dell, IBM, and the University of Texas are major employers. While Pittsburgh's economic landscape is dominated by UPMC, Giant Eagle, and the University of Pittsburgh.
There were 4,180 building permits issued in Austin in 2012 (2467 more than in 2011) compared to 198 building permits issued in Pittsburgh in 2012 (86 less than in 2011).
In Austin (Travis County), 60.2% voted for Democrats and 36.2% for Republicans in 2012 Presidential Election. In Pittsburgh (Allegheny County), 56.5% voted for Democrats and 42.0% for Republicans.
Elections
Type
Democrats
Republicans
Other
Year
Austin
Pittsburgh
Austin
Pittsburgh
Austin
Pittsburgh
2020
71.7%
59.4%
26.5%
39.0%
1.8%
1.5%
2016
65.8%
55.9%
27.2%
39.5%
7.0%
4.6%
2012
60.2%
56.5%
36.2%
42.0%
3.6%
1.5%
2008
63.8%
57.1%
34.4%
41.7%
1.8%
1.2%
2004
56.1%
57.2%
42.1%
42.2%
1.8%
0.6%
2000
41.7%
56.6%
47.0%
40.4%
11.3%
2.9%
1996
52.4%
52.8%
40.0%
37.9%
7.7%
9.3%
Breakdown of population affiliated with a religious congregation
Type
Adherents
Congregations
Religion
Austin
Pittsburgh
Austin
Pittsburgh
CATHOLIC CHURCH
17.3%
37.7%
4.5%
15.6%
SOUTHERN BAPTIST CONVENTION
8.0%
0.2%
22.8%
2.8%
EPISCOPAL CHURCH
1.4%
0.6%
2.8%
1.7%
MUSLIM ESTIMATE
1.2%
0.5%
0.7%
0.9%
EVANGELICAL LUTHERAN CHURCH IN AMERICA
1.0%
2.0%
2.5%
6.7%
LUTHERAN CHURCH
0.9%
0.3%
2.1%
1.8%
AMERICAN BAPTIST CHURCHES IN THE USA
0.1%
1.4%
0.1%
3.7%
SALVATION ARMY
0.0%
0.3%
0.1%
0.8%
Weather
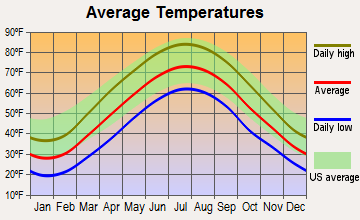
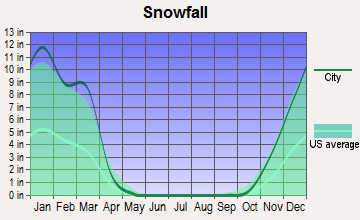
Weather considerably differs in these two cities. Austin enjoys a warm climate with over 230 sunny days annually, considerably hotter summer temperatures, and milder winters than Pittsburgh. On the other side, Pittsburgh experiences a colder climate with significant snowfall in winter, while summer temperatures remain moderate. This diverse climate might suit some people, but others may prefer Austin's consistent warmth.
Weather and climate
Type
Austin
Pittsburgh
Temperature - Average
68.5°F
51.3°F
Humidity - Average morning or afternoon humidity
75.2%
73.7%
Humidity - Differences between morning and afternoon humidity
40%
36%
Humidity - Maximum monthly morning or afternoon humidity
89%
86%
Humidity - Minimum monthly morning or afternoon humidity
49%
50%
Precipitation - Yearly average
33.7 in
38.6 in
Snowfall - Yearly average
1.4 in
87.7 in
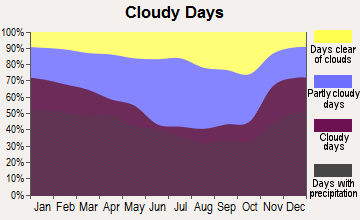
Clouds - Number of days clear of clouds
19.3%
9.8%
Sunshine amount - Average
63.3%
46%
Sunshine amount - Differences during a year
22%
31%
Sunshine amount - Maximum monthly
72%
54%
Sunshine amount - Minimum monthly
50%
23%
Wind speed - Average
7.2 mph
8.5 mph
Average climate in Austin, Texas
Average climate in Pittsburgh, Pennsylvania
Air pollution
Type
AQI
CO
NO2
OZONE
PB
PM10
PM25
SO2
Year
Austin
Pittsburgh
Austin
Pittsburgh
Austin
Pittsburgh
Austin
Pittsburgh
Pittsburgh
Pittsburgh
Austin
Pittsburgh
Austin
Pittsburgh
2018
76
105
N/A
0.26
4.9
5.7
26.7
24.7
N/A
N/A
15.1
N/A
8.7
11.8
0.2
0.6
2017
76
102
N/A
0.25
4.6
5.7
29.7
26.2
N/A
N/A
16.4
N/A
8.3
9.5
0.3
0.6
2016
71
100
N/A
0.27
4.2
6.5
29.5
25.9
0.002
N/A
15.6
N/A
8.2
10.4
0.2
0.7
2015
78
110
N/A
0.26
4.4
7.5
28.9
24.8
0.007
N/A
18.6
N/A
8.6
11.0
0.3
1.0
2014
74
107
N/A
0.30
5.2
9.3
28.3
23.1
0.042
N/A
18.1
N/A
8.7
10.4
0.5
1.2
2013
78
99
0.09
0.27
5.5
10.8
29.5
25.1
0.164
N/A
16.6
N/A
8.6
10.3
0.5
2.4
2012
86
120
0.13
0.33
5.5
13.0
30.1
25.4
N/A
N/A
19.5
N/A
8.6
10.3
N/A
2.5
2011
83
118
0.11
0.29
2.6
13.3
33.0
24.5
N/A
N/A
16.6
N/A
9.1
12.2
N/A
2.6
2010
77
151
0.05
0.37
3.2
13.6
29.4
24.5
N/A
N/A
20.2
N/A
8.8
12.1
N/A
5.0
2009
76
129
0.05
0.23
2.6
12.9
29.7
23.0
0.017
N/A
18.5
N/A
9.0
14.9
N/A
4.0
2008
81
135
0.12
0.26
3.2
16.1
30.7
22.3
0.017
N/A
20.6
N/A
9.7
16.7
N/A
4.8
2007
82
140
0.12
0.39
3.1
15.6
27.1
22.8
0.010
N/A
21.7
N/A
9.8
19.0
N/A
5.9
2006
89
149
0.14
0.35
3.8
16.2
31.3
20.2
0.028
N/A
19.3
N/A
10.0
16.1
0.2
6.6
2005
92
107
0.15
0.33
4.4
19.1
29.0
20.0
0.031
N/A
20.9
N/A
10.7
N/A
0.2
7.4
2004
74
93
0.16
0.41
3.3
18.9
26.8
19.7
0.019
N/A
21.0
N/A
N/A
N/A
N/A
6.6
2003
85
102
0.26
0.36
4.2
19.6
28.9
21.3
0.032
N/A
21.3
N/A
N/A
N/A
0.1
8.7
2002
83
111
0.33
0.32
3.9
20.1
27.2
21.7
0.017
N/A
20.2
N/A
N/A
N/A
N/A
9.2
2001
83
107
0.31
0.60
4.2
21.2
25.5
21.1
0.017
N/A
26.0
N/A
N/A
N/A
N/A
8.5
2000
86
102
0.28
0.62
4.7
22.0
27.8
19.8
0.016
N/A
22.8
N/A
N/A
N/A
N/A
9.1
Natural disasters
Type
Austin
Pittsburgh
Tornado activity compared to U.S. average
137.9%
80.2%
Earthquake activity compared to U.S. average
80.4%
44.6%
Natural disasters compared to U.S. average
29%
15%
Transportation
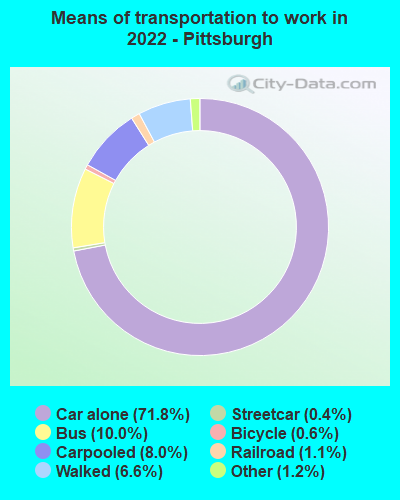
Austin has a reliance on cars for transportation, but it also has a growing public transit system with buses and an expanding rail network. However, the public transit system in Pittsburgh is more extensive, serving the greater Metro area with an array of buses, light rail lines, and even inclines.
Transport
Type
Austin
Pittsburgh
Amtrak stations
1
1
Amtrak stations nearby
1
1
FAA registered aircraft
911
233
FAA registered aircraft manufacturers and dealers
21
3
Means of transportation to work
Type
Austin
Pittsburgh
Bicycle
0.8%
0.8%
Bus
1.5%
9.3%
Carpooled
7.9%
7.4%
Car alone
85.9%
74%
Motorcycle
0.3%
0.1%
Railroad
0%
0.7%
Streetcar
0%
0.6%
Taxicab
0.1%
0.1%
Walked
2%
4.8%
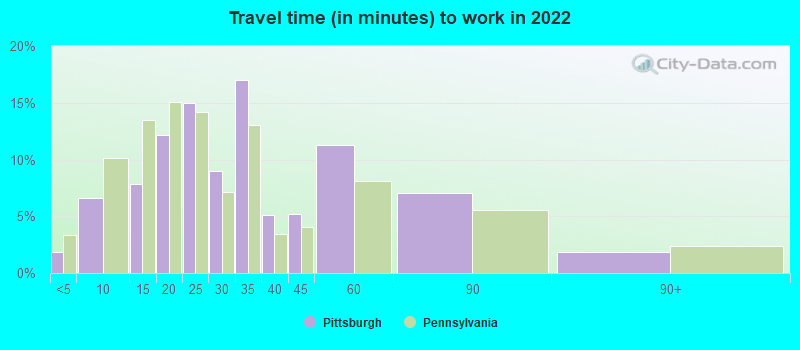
Average travel time to work
Type
Austin
Pittsburgh
Average
29.9 min
31 min
Other means
22.7 min
21.6 min
Public transportation
37.9 min
33.4 min
Private vehicle occupancy
Type
Austin
Pittsburgh
Average
1.1
1.1
Drove alone
91.2%
90.3%
In 2 person carpool
6.3%
8%
In 3 person carpool
1.7%
0.8%
In 4 person carpool
0.6%
0.5%
In 7+ person carpool
0.2%
0.3%
How many people usually rode to work in the car, truck or van.
Real Estate
Austin's real estate prices are considerably higher than those in Pittsburgh. The median home price in Austin is notably higher due to the ongoing influx of people moving into the city, which has resulted in a housing demand surge.
Neighborhoods
Both Austin and Pittsburgh offer diverse neighborhoods to suit almost any lifestyle. Austin neighborhoods like Circle C Ranch and Hyde Park are family-friendly with plenty of amenities. Pittsburgh neighborhoods like Shadyside and Squirrel Hill are noted for their historic homes, excellent schools, and vibrant local culture.
Houses and residents
Type
Austin
Pittsburgh
Houses
469,156
159,435
Average household size (people)
2.4
2.1
Median year apartment built
1997
1954
Length of stay in the house since moving in
12.1 years
16.4 years
Houses occupied
449,399 (95.8%)
136,747 (85.8%)
Houses occupied by owners
196,458 (43.7%)
66,729 (48.8%)
Houses occupied by renters
252,941 (56.3%)
70,018 (51.2%)
Median rent asked for vacant for-rent units
$1,286
$1,381
Median monthly housing costs
$1,521
$985
Median price asked for vacant for-sale houses and condos
$549,769
$325,759
Estimated median house or condo value
$482,900
$181,100
Median numbers of rooms
4.4
5.2
Median number of rooms in apartments
3.4
4
Median number of rooms in houses and condos
6
6.3
Median house price - detached houses
$595,996
$256,260
Median house price - in 2-unit structures
$393,984
$174,463
Median house price - in 3-to-4-unit structures
$262,826
$299,629
Median house price - in 5 or more unit structures
$576,111
$310,273
Median house price - mobile homes
$56,102
$187,764
Median house price - Townhouses or other attached units
$459,657
$258,331
Median house price - All housing units
$571,154
$257,793
Median house age
28
80
Renting percentage
54.9%
52.4%
Housing density (houses/condos per square mile)
1,865.3
2,868.3
House value disparities
28.4%
43.1%
Household income disparities
44.8%
49.5%
Median household income for houses/condes with a mortgage
$141,177
$97,230
Median household income for apartments without a mortgage
$86,430
$58,579
Housing units without a mortgage
1,799 (1.3%)
2,260 (5.6%)
Housing units with both a second mortgage and home equity loan
6,421 (4.8%)
4,417 (11%)
Housing units with a mortgage
132,628 (98.7%)
37,784 (94.4%)
Housing units with a home equity loan
206 (0.2%)
297 (0.7%)
Housing units with a second mortgage
8,515 (6.3%)
4,975 (12.4%)
House/condo owner moved in on average (years ago)
9
15
House/condo renter moved in on average (years ago)
1
1
Housing units lacking complete kitchen facilities
0.9%
3%
Housing units lacking complete plumbing facilities
0.6%
2.8%
Housing units in structures
Housing units in structures
Austin
Pittsburgh
One, detached
43.1%
43.7%
One, attached
5.2%
15.6%
Two
2.4%
8.9%
3 or 4
4.1%
6.2%
5 to 9
7.2%
4.8%
10 to 19
11.0%
4.3%
20 to 49
8.9%
4.3%
50 or more
17.2%
11.5%
Mobile homes
1.0%
0.6%
Median real estate property taxes paid for housing units
Self-employed workers in own not incorporated business
38,777
5,977
State government workers
46,229
5,427
Unpaid family workers
102
73
Industries and Occupations
In Austin, the technology industry is remarkably prevalent, with leading tech companies having headquarters or significant operations here. Pittsburgh, once famed for its steel industry, now boasts strength in healthcare, finance, and education sectors.
Both cities have excellent healthcare establishments. However, Pittsburgh holds an upper hand with University of Pittsburgh Medical Center (UPMC), one of the top-ranked healthcare systems in the US. Austin is served by reputable healthcare systems like Baylor Scott & White and Ascension Seton.
Health (county statistics)
Type
Austin
Pittsburgh
General health status score of residents in this county from 1 (poor) to 5 (excellent)
Austin's infrastructure includes a growing network of highways and a modern airport catering to national and international flights. However, public transportation is less punctual than Pittsburgh. Notably, Pittsburgh has nationally recognized bus and light rail systems, making public transit more reliable.
Infrastructure
Type
Austin
Pittsburgh
Hospitals
65
41
TV stations
20
22
Arenas or stadiums
2
3
Bank branches located here
264
250
Bank institutions located here
43
27
Main business address for public companies
44
37
Drinking water stations with no reported violations in the past
46
1
Drinking water stations with reported violations in the past
HMDA - Conventional home purchase loans - Applications denied
Year
Austin
Pittsburgh
1999
4,733
576
2000
2,950
539
2001
2,038
443
2002
1,772
378
2003
2,213
523
2004
2,458
614
2005
3,121
761
2006
3,367
807
2007
2,560
671
2008
1,747
347
2009
1,067
210
Culture and Food
Austin is widely known for its live music scene and is even dubbed the live "Music Capital of the World." It also offers iconic Tex-Mex and barbecue cuisine. Conversely, Pittsburgh offers culturally diverse food options, plentiful museums and cultural institutions, and the world-renowned Pittsburgh Symphony Orchestra.
Sports Teams
Sports are an integral part of both cities, with Austin being home to University of Texas college sports teams. Austin FC is also the city's first major league soccer team. Pittsburgh boasts a rich sports culture with professional sports teams in NFL (Steelers), MLB (Pirates), and NHL (Penguins).


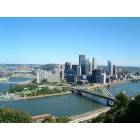
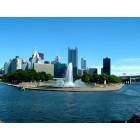

 Austin, TX
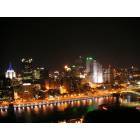
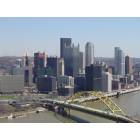
 Pittsburgh, PA