Austin, Texas, and Tulsa, Oklahoma, are two thriving cities in the United States with unique charms and offerings. The bustling city of Austin boasts lower crime rates, a vibrant economy, and a more expressive culture, while Tulsa offers a lower cost of living, expansive green spaces, and an emerging arts scene. We'll take an in-depth look at the key areas of comparison between the two, including safety, weather, cost, education, economy, infrastructure, industries, employers, real estate, neighborhoods, transportation, taxes, culture, sports teams, geography, and healthcare.
Distance between
Austin, TX and
Tulsa, OK : 416.2 miles
Austin's population is larger by 134%. Its population has grown by 307,615 people (46.9%) since 2000. The population of Tulsa has grown by 18,352 people (4.7%) during that time.
Austin has a higher overall crime rate than the national average, and Tulsa has even higher rates. However, Austin's violent crime rate is slightly lower than Tulsa's. Both cities are putting concerted efforts into reducing crime, enhancing safety, and fostering community engagement.
Cost of Living
Living in Austin is generally more expensive than living in Tulsa. Housing costs in particular are significantly higher in Austin. However, average salaries are also higher in Austin, helping offset the higher cost of living.
Income Tax
Texas does not have a state income tax, which can be a significant advantage for Austin residents. On the other hand, Oklahoma imposes a state income tax, which affects the overall disposable income for Tulsa residents.
Property Tax
Property taxes in Texas are among the highest in the U.S., and Austin is no exception. Conversely, Tulsa has considerably lower property taxes.
Sales Tax
Texas and Oklahoma have similar state sales tax rates, but cities may impose additional local taxes. Austin's local sales tax is 2%, and Tulsa's local sales tax is 3.167%, resulting in a slightly higher overall sales tax in Tulsa.
Income
Type
Austin
Tulsa
Estimated median household income
$79,542
$51,008
Estimated per capita income
$53,937
$33,002
Cost of living index (U.S. average is 100)
96.4
86.5
If you make $50,000 in Tulsa, you will have to make $55,723 in Austin to maintain the same standard of living.
Geographical Conditions
Austin rests in the Texas Hill Country, allowing for an abundance of outdoor activities such as hiking and lake activities because of its rivers and lakes. Tulsa is located in the Green Country region of Oklahoma, known for its rolling green hills and bodies of water, offering numerous outdoor activities as well.
Both cities have solid educational systems, but Austin wins in this category with its renowned University of Texas. A number of highly ranked public school districts also serve Austin. Tulsa also has quality educational institutions and public school districts.
Austin has a booming economy with strong job growth, particularly in technology, government, and entertainment sectors. Tulsa’s economy is diverse, spanning aerospace, finance, telecommunications, and manufacturing. However, job growth in Austin outpaces that in Tulsa.
Biggest Employers
Austin's biggest employers are the State of Texas, the University of Texas at Austin, and Dell. In Tulsa, the biggest employers are American Airlines, Saint Francis Health System, and the University of Tulsa.
There were 4,180 building permits issued in Austin in 2012 (2467 more than in 2011) compared to 652 building permits issued in Tulsa in 2012 (333 more than in 2011).
In Austin (Travis County), 60.2% voted for Democrats and 36.2% for Republicans in 2012 Presidential Election. In Tulsa (Tulsa County), 36.3% voted for Democrats and 63.7% for Republicans.
Elections
Type
Democrats
Republicans
Other
Year
Austin
Tulsa
Austin
Tulsa
Austin
Tulsa
2020
71.7%
40.9%
26.5%
56.5%
1.8%
2.7%
2016
65.8%
35.6%
27.2%
58.4%
7.0%
6.1%
2012
60.2%
36.3%
36.2%
63.7%
3.6%
0.0%
2008
63.8%
37.8%
34.4%
62.2%
1.8%
0.0%
2004
56.1%
35.6%
42.1%
64.4%
1.8%
0.0%
2000
41.7%
37.3%
47.0%
61.3%
11.3%
1.3%
1996
52.4%
37.1%
40.0%
53.6%
7.7%
9.3%
Breakdown of population affiliated with a religious congregation
Type
Adherents
Congregations
Religion
Austin
Tulsa
Austin
Tulsa
CATHOLIC CHURCH
17.3%
8.1%
4.5%
3.1%
SOUTHERN BAPTIST CONVENTION
8.0%
14.9%
22.8%
18.6%
EPISCOPAL CHURCH
1.4%
0.8%
2.8%
1.3%
MUSLIM ESTIMATE
1.2%
0.5%
0.7%
0.7%
EVANGELICAL LUTHERAN CHURCH IN AMERICA
1.0%
0.4%
2.5%
0.9%
LUTHERAN CHURCH
0.9%
0.7%
2.1%
1.2%
INTERNA PENTECO HOLINESS CHURCH
0.2%
0.7%
1.5%
0.7%
SEVENTH DAY ADVENTIST CHURCH
0.2%
0.4%
1.0%
1.1%
AMERICAN BAPTIST CHURCHES IN THE USA
0.1%
0.3%
0.1%
0.5%
Weather
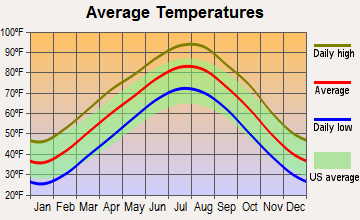
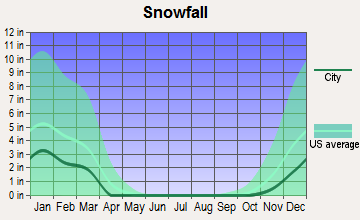
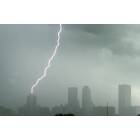
Austin has a humid subtropical climate, with hot summers and mild winters. Tulsa also has a humid subtropical climate, but it experiences more temperature fluctuations. Winters in Tulsa can get quite cold, with occasional snowfall, while Austin generally enjoys mild winters. The summers in both cities can be hot and humid.
Weather and climate
Type
Austin
Tulsa
Temperature - Average
68.5°F
60.4°F
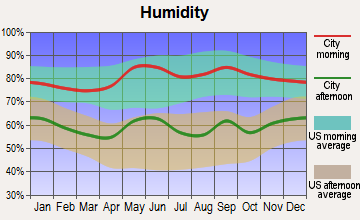
Humidity - Average morning or afternoon humidity
75.2%
73.8%
Humidity - Differences between morning and afternoon humidity
40%
33%
Humidity - Maximum monthly morning or afternoon humidity
89%
85%
Humidity - Minimum monthly morning or afternoon humidity
49%
52%
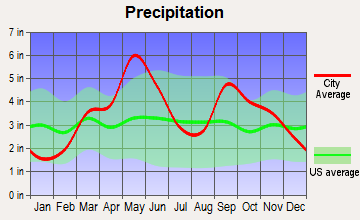
Precipitation - Yearly average
33.7 in
42.1 in
Snowfall - Yearly average
1.4 in
18.4 in
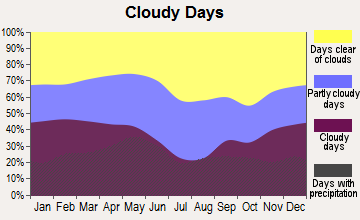
Clouds - Number of days clear of clouds
19.3%
21.1%
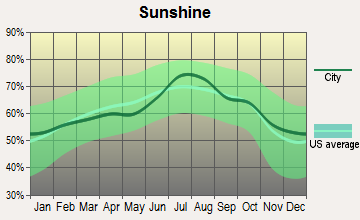
Sunshine amount - Average
63.3%
64.8%
Sunshine amount - Differences during a year
22%
24%
Sunshine amount - Maximum monthly
72%
74%
Sunshine amount - Minimum monthly
50%
50%
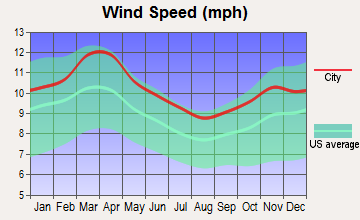
Wind speed - Average
7.2 mph
10.2 mph
Average climate in Austin, Texas
Average climate in Tulsa, Oklahoma
Air pollution
Type
AQI
CO
NO2
OZONE
PB
PM25
SO2
Year
Austin
Tulsa
Austin
Tulsa
Austin
Tulsa
Austin
Tulsa
Tulsa
Austin
Tulsa
Austin
Tulsa
2018
76
88
N/A
0.24
4.9
N/A
26.7
28.6
0.004
N/A
8.7
11.6
0.2
0.4
2017
76
80
N/A
0.22
4.6
N/A
29.7
29.9
0.004
N/A
8.3
10.2
0.3
0.5
2016
71
86
N/A
0.24
4.2
N/A
29.5
29.1
0.005
N/A
8.2
9.5
0.2
0.5
2015
78
74
N/A
0.25
4.4
N/A
28.9
28.1
0.004
N/A
8.6
8.6
0.3
0.8
2014
74
74
N/A
0.16
5.2
N/A
28.3
29.2
0.005
N/A
8.7
9.2
0.5
0.3
2013
78
85
0.09
0.21
5.5
N/A
29.5
29.8
0.005
N/A
8.6
10.1
0.5
0.5
2012
86
103
0.13
0.21
5.5
N/A
30.1
32.4
0.007
N/A
8.6
11.7
N/A
0.7
2011
83
108
0.11
0.27
2.6
N/A
33.0
33.8
0.005
N/A
9.1
13.8
N/A
0.8
2010
77
83
0.05
0.26
3.2
N/A
29.4
30.1
0.004
N/A
8.8
12.2
N/A
0.7
2009
76
88
0.05
0.26
2.6
N/A
29.7
29.8
0.004
N/A
9.0
12.2
N/A
0.7
2008
81
71
0.12
N/A
3.2
N/A
30.7
26.7
0.007
N/A
9.7
N/A
N/A
N/A
2007
82
77
0.12
0.32
3.1
N/A
27.1
28.8
0.007
N/A
9.8
N/A
N/A
0.8
2006
89
95
0.14
N/A
3.8
N/A
31.3
32.9
N/A
N/A
10.0
N/A
0.2
N/A
2005
92
84
0.15
N/A
4.4
N/A
29.0
28.9
N/A
N/A
10.7
N/A
0.2
N/A
2004
74
71
0.16
N/A
3.3
N/A
26.8
27.5
N/A
N/A
N/A
N/A
N/A
N/A
2003
85
94
0.26
N/A
4.2
N/A
28.9
29.2
N/A
N/A
N/A
N/A
0.1
N/A
2002
83
85
0.33
0.83
3.9
7.8
27.2
27.7
N/A
N/A
N/A
N/A
N/A
N/A
2001
83
102
0.31
0.75
4.2
14.4
25.5
30.6
N/A
N/A
N/A
N/A
N/A
N/A
2000
86
101
0.28
0.69
4.7
15.3
27.8
28.9
N/A
N/A
N/A
N/A
N/A
N/A
Natural disasters
Type
Austin
Tulsa
Tornado activity compared to U.S. average
137.9%
277.6%
Earthquake activity compared to U.S. average
80.4%
901.9%
Natural disasters compared to U.S. average
29%
34%
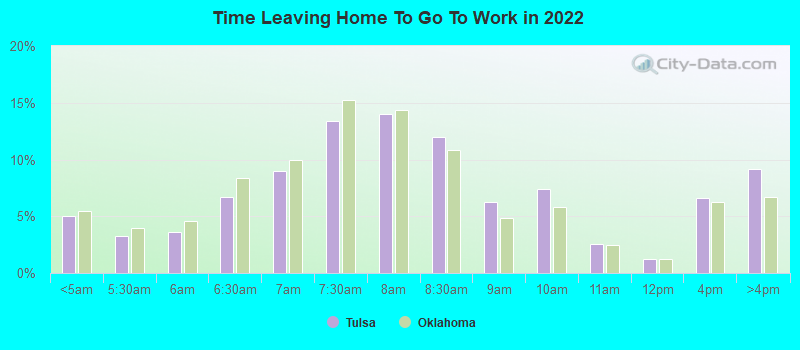
Transportation
Austin public transit system includes buses and a metro rail system. However, due to Austin's sprawling nature, many residents find it necessary to own a personal vehicle. Tulsa also has a bus system, and there is less traffic than in Austin, making commuting by personal car easier.
Transport
Type
Austin
Tulsa
Amtrak stations
1
1
Amtrak stations nearby
1
1
FAA registered aircraft
911
808
FAA registered aircraft manufacturers and dealers
21
35
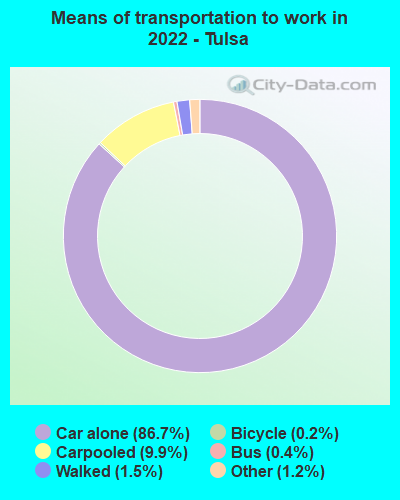
Means of transportation to work
Type
Austin
Tulsa
Bicycle
0.8%
0.1%
Bus
1.5%
0.1%
Carpooled
7.9%
9%
Car alone
85.9%
87.9%
Motorcycle
0.3%
0.1%
Taxicab
0.1%
0.1%
Walked
2%
1.4%
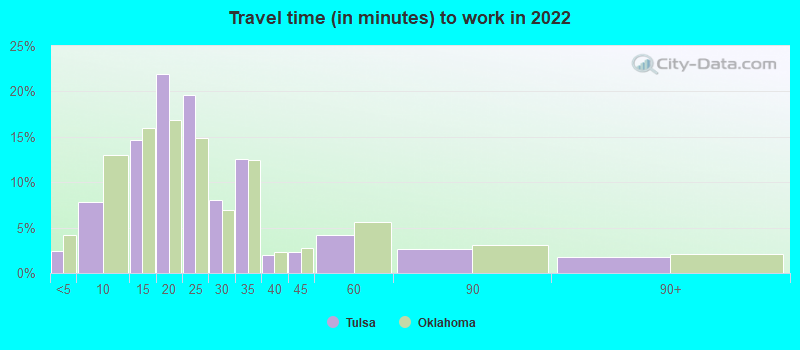
Average travel time to work
Type
Austin
Tulsa
Average
29.9 min
23.8 min
Other means
22.7 min
19.2 min
Public transportation
37.9 min
40.1 min
Private vehicle occupancy
Type
Austin
Tulsa
Average
1.1
1.2
Drove alone
91.2%
88.9%
In 2 person carpool
6.3%
8.7%
In 3 person carpool
1.7%
1.5%
In 4 person carpool
0.6%
0.3%
In 5-6 person carpool
0.1%
0.5%
In 7+ person carpool
0.2%
0.1%
How many people usually rode to work in the car, truck or van.
Real Estate
Real estate in Austin is generally more expensive than in Tulsa. Austin's housing market is in high demand and very competitive, while Tulsa's market is more affordable and less competitive.
Neighborhoods
Both Austin and Tulsa feature a blend of historic and contemporary neighborhoods. Austin neighborhoods, such as Cherrywood and Hyde Park, offer a combination of small-town feel with city amenities. Meanwhile, Tulsa has distinct neighborhoods like Brookside and Riverside that give a variety of living options.
Houses and residents
Type
Austin
Tulsa
Houses
469,156
194,402
Average household size (people)
2.4
2.3
Median year apartment built
1997
1975
Median year house/condo built
1988
1969
Length of stay in the house since moving in
12.1 years
12.9 years
Houses occupied
449,399 (95.8%)
173,943 (89.5%)
Houses occupied by owners
196,458 (43.7%)
89,307 (51.3%)
Houses occupied by renters
252,941 (56.3%)
84,636 (48.7%)
Median rent asked for vacant for-rent units
$1,286
$899.30
Median monthly housing costs
$1,521
$897
Median price asked for vacant for-sale houses and condos
$549,769
$163,212
Estimated median house or condo value
$482,900
$172,000
Median numbers of rooms
4.4
5.2
Median number of rooms in apartments
3.4
4.1
Median number of rooms in houses and condos
6
6.4
Median house price - detached houses
$595,996
$247,367
Median house price - in 2-unit structures
$393,984
$496,968
Median house price - in 3-to-4-unit structures
$262,826
$94,964
Median house price - in 5 or more unit structures
$576,111
$176,274
Median house price - mobile homes
$56,102
$73,235
Median house price - Townhouses or other attached units
$459,657
$184,309
Median house price - All housing units
$571,154
$241,263
Median house age
28
49
Renting percentage
54.9%
46.5%
Housing density (houses/condos per square mile)
1,865.3
1,064.4
House value disparities
28.4%
41.8%
Household income disparities
44.8%
48.1%
Median household income for houses/condes with a mortgage
$141,177
$84,820
Median household income for apartments without a mortgage
$86,430
$57,403
Housing units without a mortgage
1,799 (1.3%)
855 (1.7%)
Housing units with both a second mortgage and home equity loan
6,421 (4.8%)
2,464 (4.8%)
Housing units with a mortgage
132,628 (98.7%)
50,494 (98.3%)
Housing units with a home equity loan
206 (0.2%)
93 (0.2%)
Housing units with a second mortgage
8,515 (6.3%)
3,580 (7%)
House/condo owner moved in on average (years ago)
9
11
House/condo renter moved in on average (years ago)
1
1
Housing units lacking complete kitchen facilities
0.9%
2.9%
Housing units lacking complete plumbing facilities
0.6%
1.7%
Housing units in structures
Housing units in structures
Austin
Tulsa
One, detached
43.1%
62.9%
One, attached
5.2%
2.8%
Two
2.4%
1.9%
3 or 4
4.1%
5.0%
5 to 9
7.2%
6.8%
10 to 19
11.0%
9.2%
20 to 49
8.9%
4.4%
50 or more
17.2%
5.8%
Mobile homes
1.0%
1.1%
Boats, RVs, vans, etc.
0.0%
0.2%
Median real estate property taxes paid for housing units
Self-employed workers in own not incorporated business
38,777
13,964
State government workers
46,229
5,897
Unpaid family workers
102
284
Industries and Occupations
Austin's largest industries are tech, entertainment, and government. Its fastest-growing occupations include software developers and health diagnosing practitioners. Tulsa has a diverse range of industries with the largest being energy, aviation, telecommunications, and manufacturing.
Austin residents benefit from notable healthcare systems such as Ascension Seton and St. David's. Tulsa's healthcare industry is among the largest sectors of the economy, with top-ranked healthcare systems such as Hillcrest and St. John’s.
Health (county statistics)
Type
Austin
Tulsa
General health status score of residents in this county from 1 (poor) to 5 (excellent)
Austin's infrastructure is rapidly developing due to its growing population. New residential buildings, improved public transportation systems, and enhanced utility infrastructure are being implemented, while Tulsa also continues to invest in its infrastructure, focusing on improving roads, utilities, and public services.
Infrastructure
Type
Austin
Tulsa
Hospitals
65
45
TV stations
20
20
Arenas or stadiums
2
2
Bank branches located here
264
160
Bank institutions located here
43
40
Main business address for public companies
44
27
Drinking water stations with no reported violations in the past
46
0
Drinking water stations with reported violations in the past
HMDA - Conventional home purchase loans - Applications denied
Year
Austin
Tulsa
1999
4,733
2,135
2000
2,950
1,531
2001
2,038
1,216
2002
1,772
1,106
2003
2,213
1,243
2004
2,458
1,354
2005
3,121
1,709
2006
3,367
1,756
2007
2,560
1,014
2008
1,747
517
2009
1,067
327
Culture and Food
Austin is known for its vibrant culture, eclectic food scene, and live music. You'll find a diverse range of restaurants and food trucks offering everything from Texas barbecue to globally-inspired cuisine. Tulsa also has a dynamic culture and food scene, with an emphasis on Southern comfort food and a growing craft beer industry.
Sports Teams
Austin has one major professional sports team, Austin FC in Major League Soccer. On the other hand, while Tulsa does not have major pro sports teams, the city takes great pride in its minor league teams like the Tulsa Drillers (baseball) and Tulsa Roughnecks (soccer).


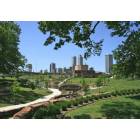
 Austin, TX
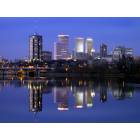
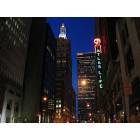
 Tulsa, OK