Austin, Texas, and Virginia Beach, Virginia, are two vibrant U.S cities offering different amenities and attractions to both residents and visitors. While Austin is famed for its thriving technology industry and music scene, Virginia Beach is known for its stunning coastline and military presence. Various factors shape the quality of life in these two cities, including cost of living, education, and safety measures, which differ significantly. This article aims to compare these cities across various elements such as crime and safety, weather, cost of living, education, and much more.
Distance between
Austin, TX and
Virginia Beach, VA : 1,322.5 miles
Austin's population is larger by 111%. Its population has grown by 307,615 people (46.9%) since 2000. The population of Virginia Beach has grown by 32,415 people (7.6%) during that time.
Based on FBI crime data, both Austin and Virginia Beach are safer than most U.S. cities of their size. However, Virginia Beach tends to have a lower crime rate than Austin, making it safer for both residents and tourists. Austin has been working to improve its safety measures, including increasing police patrols in high-risk areas but still features higher crime rates compared to Virginia Beach.
City-data.com crime index counts serious crimes and violent crime more heavily. It adjusts for the number of visitors and daily workers commuting into cities. (higher means more crime, U.S. average = 301.1)
City-data.com crime index counts serious crimes and violent crime more heavily. It adjusts for the number of visitors and daily workers commuting into cities. (higher means more crime, U.S. average = 301.1)
Sex Offenders
According to our data, there are 1,411 registered sex offenders living in Austin and 706 registered sex offenders living in . The ratio of residents to sex offenders in Austin is 672 to 1; the ratio in Virginia Beach is 641 to 1. The number of registered sex offenders compared to the number of residents in Austin is near to than in Virginia Beach.
Cost of Living
Austin, being one of the fastest-growing cities, has a higher cost of living compared to Virginia Beach, driven predominantly by housing costs. The cost of groceries, utilities, transportation, and health care is also slightly higher in Austin than in Virginia Beach, making Virginia Beach more affordable overall.
Income Tax
While Austin residents enjoy the benefit of no state income tax, they face high property and sales taxes. Virginia Beach, on the other hand, has state income tax, but relatively lower property and sales taxes.
Property Tax
Austin has higher property taxes to support public services, including schools. Virginia Beach property taxes are considerably lower, making homeownership more affordable.
Sales Tax
Texas, including Austin, does not levy state income tax, but it has a high sales tax. Virginia has a lower sales tax rate, but Virginia Beach residents have to pay state income tax.
Income
Type
Austin
Virginia Beach
Estimated median household income
$79,542
$81,634
Estimated per capita income
$53,937
$42,498
Cost of living index (U.S. average is 100)
96.4
97
If you make $50,000 in Austin, you will have to make $50,311 in Virginia Beach to maintain the same standard of living.
Geographical Conditions
Austin is characterized by rolling hills and lakes, while Virginia Beach is a coastal city with beautiful beaches and proximity to rivers and bays.
When it comes to education, both cities are well-matched. Austin is home to several top-rated schools and the University of Texas, making it a great place for academics. Virginia Beach also boasts robust public and private school systems, with slightly better high school graduation rates than Austin.
Austin has a thriving economy, known for its tech industry with many high-tech workers and entrepreneurs. Virginia Beach's economy heavily relies on military, public sector jobs, tourism, and agriculture. While Austin typically has a lower unemployment rate, Virginia Beach's job market offers more stability due to its diverse economy.
Biggest Employers
Austin's largest employers are tech giants like Dell, IBM, and Apple. The city's reputation as a tech hub draws skilled workers from all over the country. Virginia Beach's biggest employers are the city's school system, the Navy, and the tourism industry.
There were 4,180 building permits issued in Austin in 2012 (2467 more than in 2011) compared to 335 building permits issued in Virginia Beach in 2012 (200 less than in 2011).
In Austin (Travis County), 60.2% voted for Democrats and 36.2% for Republicans in 2012 Presidential Election. In Virginia Beach (Virginia Beach city), 48.1% voted for Democrats and 50.7% for Republicans.
Elections
Type
Democrats
Republicans
Other
Year
Austin
Virginia Beach
Austin
Virginia Beach
Austin
Virginia Beach
2020
71.7%
51.6%
26.5%
46.2%
1.8%
2.2%
2016
65.8%
44.8%
27.2%
48.4%
7.0%
6.8%
2012
60.2%
48.1%
36.2%
50.7%
3.6%
1.2%
2008
63.8%
49.3%
34.4%
50.1%
1.8%
0.6%
2004
56.1%
40.4%
42.1%
59.3%
1.8%
0.4%
2000
41.7%
41.8%
47.0%
56.1%
11.3%
2.1%
1996
52.4%
41.4%
40.0%
50.6%
7.7%
8.0%
Breakdown of population affiliated with a religious congregation
Type
Adherents
Congregations
Religion
Austin
Virginia Beach
Austin
Virginia Beach
CATHOLIC CHURCH
17.3%
10.7%
4.5%
4.2%
SOUTHERN BAPTIST CONVENTION
8.0%
4.9%
22.8%
13.6%
EPISCOPAL CHURCH
1.4%
1.4%
2.8%
4.2%
MUSLIM ESTIMATE
1.2%
0.8%
0.7%
0.4%
EVANGELICAL LUTHERAN CHURCH IN AMERICA
1.0%
0.4%
2.5%
1.5%
LUTHERAN CHURCH
0.9%
0.2%
2.1%
0.8%
AMERICAN BAPTIST CHURCHES IN THE USA
0.1%
0.4%
0.1%
0.4%
VINEYARD USA
0.0%
0.4%
0.3%
1.1%
Weather
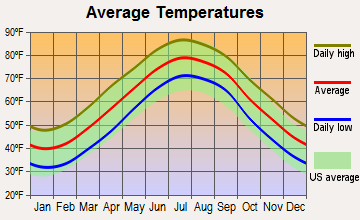
Virginia Beach enjoys mild winters and warm, humid summers due to its coastal location, making it a popular tourist destination during the summer months. On the other hand, Austin experiences hot, humid summers and mild winters. Although Austin tends to have higher temperatures than Virginia Beach, it has more sunny days annually.
Weather and climate
Type
Austin
Virginia Beach
Temperature - Average
68.5°F
59.7°F
Humidity - Average morning or afternoon humidity
75.2%
73%
Humidity - Differences between morning and afternoon humidity
40%
32%
Humidity - Maximum monthly morning or afternoon humidity
89%
83%
Humidity - Minimum monthly morning or afternoon humidity
49%
51%
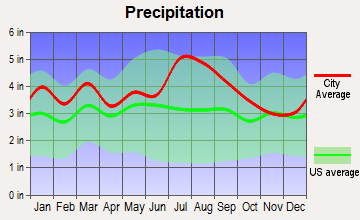
Precipitation - Yearly average
33.7 in
45.9 in
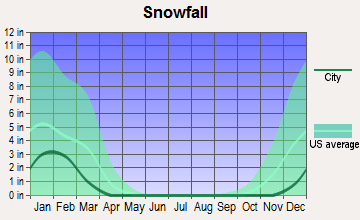
Snowfall - Yearly average
1.4 in
15.4 in
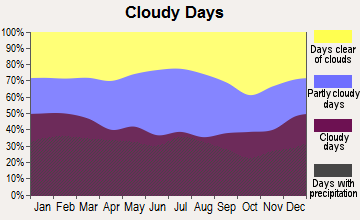
Clouds - Number of days clear of clouds
19.3%
17.6%
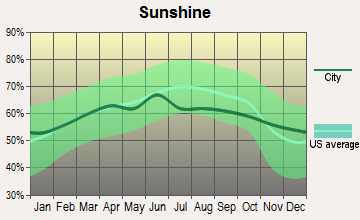
Sunshine amount - Average
63.3%
66.8%
Sunshine amount - Differences during a year
22%
14%
Sunshine amount - Maximum monthly
72%
67%
Sunshine amount - Minimum monthly
50%
53%
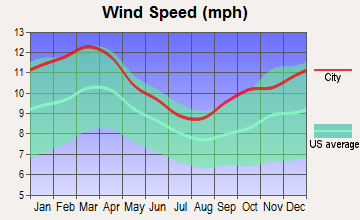
Wind speed - Average
7.2 mph
10.4 mph
Average climate in Austin, Texas
Average climate in Virginia Beach, Virginia
Air pollution
Type
AQI
CO
NO2
OZONE
PB
PM25
SO2
Year
Austin
Virginia Beach
Austin
Virginia Beach
Austin
Virginia Beach
Austin
Virginia Beach
Virginia Beach
Austin
Virginia Beach
Austin
Virginia Beach
2018
76
57
N/A
0.27
4.9
6.3
26.7
31.3
0.002
N/A
8.7
6.1
0.2
0.4
2017
76
60
N/A
0.22
4.6
6.8
29.7
33.2
0.002
N/A
8.3
6.9
0.3
0.3
2016
71
66
N/A
0.21
4.2
6.5
29.5
31.7
0.002
N/A
8.2
6.1
0.2
0.4
2015
78
57
N/A
0.27
4.4
7.3
28.9
33.8
0.002
N/A
8.6
6.4
0.3
0.5
2014
74
59
N/A
0.27
5.2
7.5
28.3
33.8
0.002
N/A
8.7
6.8
0.5
1.1
2013
78
66
0.09
0.28
5.5
7.1
29.5
31.2
0.002
N/A
8.6
6.8
0.5
1.1
2012
86
76
0.13
0.29
5.5
7.8
30.1
34.6
0.002
N/A
8.6
8.1
N/A
1.1
2011
83
66
0.11
0.27
2.6
9.2
33.0
35.1
0.003
N/A
9.1
8.8
N/A
1.7
2010
77
71
0.05
0.25
3.2
4.8
29.4
38.4
0.004
N/A
8.8
N/A
N/A
2.2
2009
76
51
0.05
0.25
2.6
9.7
29.7
31.5
0.012
N/A
9.0
N/A
N/A
2.6
2008
81
77
0.12
0.23
3.2
10.3
30.7
36.2
0.004
N/A
9.7
N/A
N/A
3.3
2007
82
81
0.12
0.18
3.1
12.2
27.1
36.3
0.004
N/A
9.8
N/A
N/A
4.3
2006
89
62
0.14
0.32
3.8
N/A
31.3
36.2
0.004
N/A
10.0
N/A
0.2
3.4
2005
92
67
0.15
0.28
4.4
N/A
29.0
35.4
N/A
N/A
10.7
N/A
0.2
3.4
2004
74
80
0.16
0.30
3.3
15.9
26.8
33.3
N/A
N/A
N/A
N/A
N/A
4.3
2003
85
84
0.26
0.34
4.2
16.2
28.9
34.3
N/A
N/A
N/A
N/A
0.1
3.9
2002
83
99
0.33
0.40
3.9
17.8
27.2
38.0
N/A
N/A
N/A
N/A
N/A
5.9
2001
83
92
0.31
0.42
4.2
18.2
25.5
36.3
N/A
N/A
N/A
N/A
N/A
6.0
2000
86
85
0.28
0.44
4.7
15.7
27.8
36.5
N/A
N/A
N/A
N/A
N/A
6.5
Natural disasters
Type
Austin
Virginia Beach
Tornado activity compared to U.S. average
137.9%
61.5%
Earthquake activity compared to U.S. average
80.4%
35.2%
Natural disasters compared to U.S. average
29%
0%
Transportation
Austin's public transportation is improving, with buses and a commuter rail. Virginia Beach primarily relies on automobiles, with less developed public transportation. However, both cities suffer from traffic congestion during peak hours.
Transport
Type
Austin
Virginia Beach
Amtrak stations
1
1
Amtrak stations nearby
1
2
FAA registered aircraft
911
374
FAA registered aircraft manufacturers and dealers
21
4
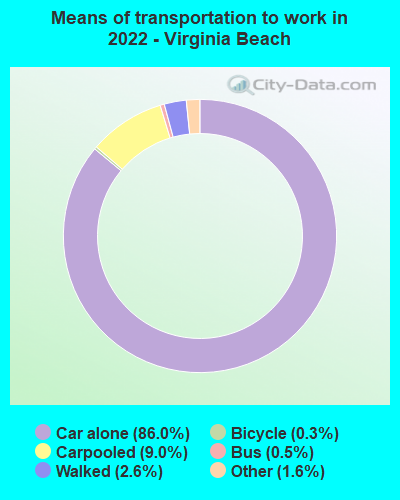
Means of transportation to work
Type
Austin
Virginia Beach
Bicycle
0.8%
0.2%
Bus
1.5%
1%
Carpooled
7.9%
9.5%
Car alone
85.9%
84.2%
Motorcycle
0.3%
0.1%
Taxicab
0.1%
0%
Walked
2%
3.2%
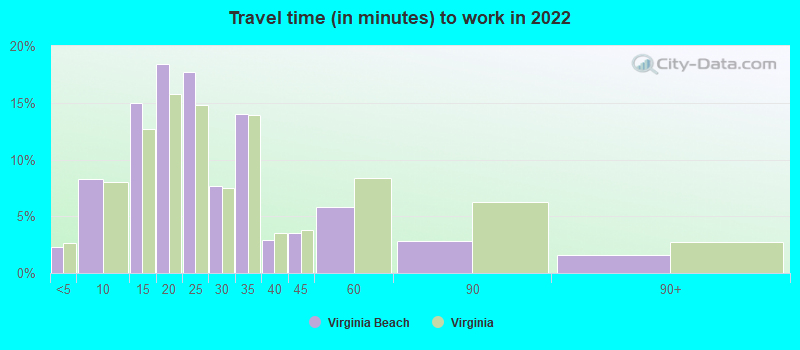
Average travel time to work
Type
Austin
Virginia Beach
Average
29.9 min
24.8 min
Other means
22.7 min
23.7 min
Public transportation
37.9 min
41.9 min
Private vehicle occupancy
Type
Austin
Virginia Beach
Average
1.1
1.1
Drove alone
91.2%
90.3%
In 2 person carpool
6.3%
8%
In 3 person carpool
1.7%
1.3%
In 4 person carpool
0.6%
0.2%
In 7+ person carpool
0.2%
0%
How many people usually rode to work in the car, truck or van.
Real Estate
The real estate market in Austin is booming, with high demand and rapidly rising prices. Virginia Beach's market is more stable and affordable, with a variety of options from beachfront properties to suburban homes.
Neighborhoods
Austin has diverse neighborhoods, from busy Downtown to peaceful Lake Travis. Virginia Beach also offers a variety of neighborhoods, with the Oceanfront attracting tourists and Shore Drive being a popular residential area.
Houses and residents
Type
Austin
Virginia Beach
Houses
469,156
190,981
Average household size (people)
2.4
2.6
Median year apartment built
1997
1988
Median year house/condo built
1988
1983
Length of stay in the house since moving in
12.1 years
13.5 years
Houses occupied
449,399 (95.8%)
182,775 (95.7%)
Houses occupied by owners
196,458 (43.7%)
119,144 (65.2%)
Houses occupied by renters
252,941 (56.3%)
63,631 (34.8%)
Median rent asked for vacant for-rent units
$1,286
$1,833
Median monthly housing costs
$1,521
$1,490
Median price asked for vacant for-sale houses and condos
$549,769
$508,833
Estimated median house or condo value
$482,900
$328,500
Median numbers of rooms
4.4
6
Median number of rooms in apartments
3.4
4.6
Median number of rooms in houses and condos
6
7
Median house price - detached houses
$595,996
$459,164
Median house price - in 2-unit structures
$393,984
$200,674
Median house price - in 3-to-4-unit structures
$262,826
$279,464
Median house price - in 5 or more unit structures
$576,111
$229,647
Median house price - mobile homes
$56,102
$143,239
Median house price - Townhouses or other attached units
$459,657
$261,878
Median house price - All housing units
$571,154
$401,957
Median house age
28
36
Renting percentage
54.9%
34.7%
Housing density (houses/condos per square mile)
1,865.3
769.2
House value disparities
28.4%
29%
Household income disparities
44.8%
40.6%
Median household income for houses/condes with a mortgage
$141,177
$104,941
Median household income for apartments without a mortgage
$86,430
$82,507
Housing units without a mortgage
1,799 (1.3%)
2,373 (2.6%)
Housing units with both a second mortgage and home equity loan
6,421 (4.8%)
9,070 (10%)
Housing units with a mortgage
132,628 (98.7%)
88,748 (97.4%)
Housing units with a home equity loan
206 (0.2%)
287 (0.3%)
Housing units with a second mortgage
8,515 (6.3%)
10,952 (12%)
House/condo owner moved in on average (years ago)
9
10
House/condo renter moved in on average (years ago)
1
1
Housing units lacking complete kitchen facilities
0.9%
1%
Housing units lacking complete plumbing facilities
0.6%
0.4%
Housing units in structures
Housing units in structures
Austin
Virginia Beach
One, detached
43.1%
53.2%
One, attached
5.2%
18.3%
Two
2.4%
1.7%
3 or 4
4.1%
4.6%
5 to 9
7.2%
9.0%
10 to 19
11.0%
4.5%
20 to 49
8.9%
2.1%
50 or more
17.2%
5.4%
Mobile homes
1.0%
1.1%
Median real estate property taxes paid for housing units
Self-employed workers in own not incorporated business
38,777
9,992
State government workers
46,229
6,577
Unpaid family workers
102
251
Industries and Occupations
In Austin, the main industries include technology, pharmaceuticals, and music. Conversely, Virginia Beach's key sectors are military defense, tourism, and agriculture. Both cities offer ample job opportunities but in different sectors.
Both cities offer excellent healthcare facilities. Austin has renowned healthcare systems like Seton and St. David's, while Virginia Beach is home to highly-rated Sentara Healthcare.
Health (county statistics)
Type
Austin
Virginia Beach
General health status score of residents in this county from 1 (poor) to 5 (excellent)
Austin's infrastructure includes an expanding mass transit network and booming construction, especially downtown. Virginia Beach, on the other hand, offers well-maintained highways, bridges, public buildings, parks, and utilities, but the public transport system lag behind Austin.
Infrastructure
Type
Austin
Virginia Beach
Hospitals
65
7
TV stations
20
24
Bank branches located here
264
96
Bank institutions located here
43
16
Main business address for public companies
44
2
Drinking water stations with no reported violations in the past
46
6
Drinking water stations with reported violations in the past
HMDA - Conventional home purchase loans - Applications denied
Year
Austin
Virginia Beach
1999
4,733
0
2000
2,950
0
2001
2,038
0
2002
1,772
0
2003
2,213
941
2004
2,458
1,388
2005
3,121
1,545
2006
3,367
1,502
2007
2,560
1,073
2008
1,747
340
2009
1,067
167
Culture and Food
Austin is known for its vibrant music scene, festivals, and barbeque food. Virginia Beach offers a blend of coastal and Southern culture, with seafood being a staple.
Sports Teams
Austin houses the University of Texas Longhorns sports teams and the Austin FC MLS team. Virginia Beach, while not having any major league professional teams, has a thriving local sports scene.


 Austin, TX
 Virginia Beach, VA