Austin, Texas, and Winston-Salem, North Carolina, both offer unique lifestyles with their individual pros and cons. In Austin, you'll encounter a vibrant culture, a booming tech industry, and a warmer climate. However, the cost of living is relatively high compared to Winston-Salem, which offers a lower cost of living, a slower pace of life, and a charming historical atmosphere. Here, we will compare these two cities based on various factors, keeping in mind the needs of both prospective residents and visitors.
Distance between
Austin, TX and
Winston-Salem, NC : 1,085.5 miles
Austin's population is larger by 285%. Its population has grown by 307,615 people (46.9%) since 2000. The population of Winston-Salem has grown by 64,544 people (34.7%) during that time.
Austin boasts a bit of a higher crime rate than Winston-Salem, but it's important to consider the specific neighborhoods when considering safety. Both cities have areas that are considered safer than others. For those looking to relocate or visit, it's always a good idea to research specific neighborhoods thoroughly. In general, Austin is expanding rapidly, which can sometimes lead to growing pains in terms of safety, while Winston-Salem has a more stable population.
City-data.com crime index counts serious crimes and violent crime more heavily. It adjusts for the number of visitors and daily workers commuting into cities. (higher means more crime, U.S. average = 301.1)
City-data.com crime index counts serious crimes and violent crime more heavily. It adjusts for the number of visitors and daily workers commuting into cities. (higher means more crime, U.S. average = 301.1)
Sex Offenders
According to our data, there are 1,407 registered sex offenders living in Austin and 494 registered sex offenders living in . The ratio of residents to sex offenders in Austin is 674 to 1; the ratio in Winston-Salem is 490 to 1. The number of registered sex offenders compared to the number of residents is a smaller in Austin than in Winston-Salem.
Cost of Living
When it comes to cost of living, Austin is significantly higher than Winston-Salem. Housing costs, in particular, are quite high in Austin due to the city's popular tech industry and real estate demand. On the other hand, Winston-Salem offers more affordable housing and overall cost of living, making it a more attractive option for those on a budget.
Income Tax
Texas, and therefore Austin, has no state income tax. This can be a significant advantage for high-earners. On the other side, North Carolina has a flat state income tax rate of 5.25%, which applies to all residents including those in Winston-Salem.
Property Tax
The average property tax rate in Austin is approximately 2.19%, while Winston-Salem has a lower property tax rate at about 0.88%. This can make owning property significantly less expensive in Winston-Salem compared to Austin.
Sales Tax
Texas has a state sales tax of 6.25%, plus a local sales tax which can bring the total to 8.25%. On the other hand, North Carolina has a state sales tax of 4.75%, with additional county tax up to 7.5%. The sales tax in Austin might be higher, but Texas has no state income tax.
Income
Type
Austin
Winston-Salem
Estimated median household income
$79,542
$54,228
Estimated per capita income
$53,937
$34,025
Cost of living index (U.S. average is 100)
96.4
88.3
If you make $50,000 in Winston-Salem, you will have to make $54,587 in Austin to maintain the same standard of living.
Geographical Conditions
Austin is located in Central Texas and is characterized by its hill country, lakes, and rivers. It's ideal for outdoor activities like hiking and boating. Meanwhile, Winston-Salem, located in the Piedmont Triad region of North Carolina, offers a landscape of rolling hills and has the advantage of being just a few hours away from both the mountains and the coast.
Austin is home to the University of Texas, one of the largest universities in the United States, offering a high-quality education. In addition, Austin's school system is decent overall, but, as in any city, quality varies by neighborhood. Winston-Salem is also an education hub with institutions like Wake Forest University and Winston-Salem State University. It has a strong emphasis on arts education, with the UNC School of the Arts based here.
Austin's economy is booming, particularly in the tech industry, with many big names such as Dell, Apple, and Google having a significant presence. Winston-Salem, historically known for tobacco and textile industries, is currently undergoing a transition. The city is witnessing a growth in healthcare, education, and finance industries. So, while Austin may offer more in terms of high-tech job opportunities, Winston-Salem provides its own unique career paths.
Biggest Employers
In Austin, the biggest employers come from a mix of sectors, including tech, education, healthcare, and government, with the State of Texas and the University of Texas leading the way. In contrast, Wake Forest Baptist Medical Center and Novant Health are the largest employers in Winston-Salem.
There were 4,180 building permits issued in Austin in 2012 (2467 more than in 2011) compared to 1,087 building permits issued in Winston-Salem in 2012 (586 more than in 2011).
In Austin (Travis County), 60.2% voted for Democrats and 36.2% for Republicans in 2012 Presidential Election. In Winston-Salem (Forsyth County), 53.2% voted for Democrats and 45.9% for Republicans.
Elections
Type
Democrats
Republicans
Other
Year
Austin
Winston-Salem
Austin
Winston-Salem
Austin
Winston-Salem
2020
71.7%
56.4%
26.5%
42.4%
1.8%
1.2%
2016
65.8%
53.0%
27.2%
42.6%
7.0%
4.4%
2012
60.2%
53.2%
36.2%
45.9%
3.6%
0.9%
2008
63.8%
55.0%
34.4%
44.5%
1.8%
0.6%
2004
56.1%
45.5%
42.1%
54.1%
1.8%
0.4%
2000
41.7%
43.4%
47.0%
56.0%
11.3%
0.6%
1996
52.4%
41.5%
40.0%
52.8%
7.7%
5.7%
Breakdown of population affiliated with a religious congregation
Type
Adherents
Congregations
Religion
Austin
Winston-Salem
Austin
Winston-Salem
CATHOLIC CHURCH
17.3%
4.0%
4.5%
1.4%
SOUTHERN BAPTIST CONVENTION
8.0%
10.3%
22.8%
15.6%
EPISCOPAL CHURCH
1.4%
1.3%
2.8%
1.4%
MUSLIM ESTIMATE
1.2%
0.4%
0.7%
0.7%
EVANGELICAL LUTHERAN CHURCH IN AMERICA
1.0%
0.5%
2.5%
1.1%
LUTHERAN CHURCH
0.9%
0.5%
2.1%
0.7%
SEVENTH DAY ADVENTIST CHURCH
0.2%
0.6%
1.0%
0.9%
AMERICAN BAPTIST CHURCHES IN THE USA
0.1%
1.4%
0.1%
1.1%
Weather
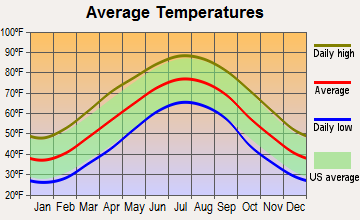
Austin is hotter and drier, with temperatures often exceeding 100 degrees in the summer. Winters are mild, and snow is rare. In contrast, Winston-Salem experiences all four seasons. Summers are warm but not excessively hot, and winters can be chilly with occasional snow. Those who enjoy a more varied climate might find Winston-Salem more to their liking, while those who prefer consistent warmth will likely appreciate Austin's weather.
Weather and climate
Type
Austin
Winston-Salem
Temperature - Average
68.5°F
57.5°F
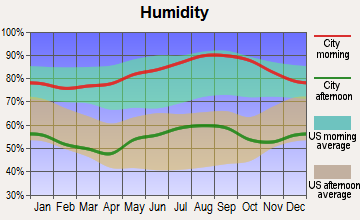
Humidity - Average morning or afternoon humidity
75.2%
72.8%
Humidity - Differences between morning and afternoon humidity
40%
42%
Humidity - Maximum monthly morning or afternoon humidity
89%
88%
Humidity - Minimum monthly morning or afternoon humidity
49%
46%
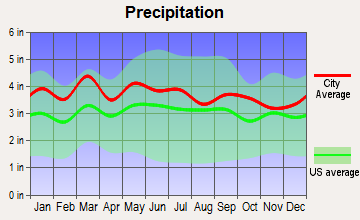
Precipitation - Yearly average
33.7 in
44.5 in
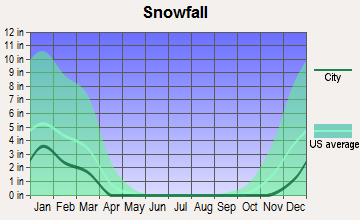
Snowfall - Yearly average
1.4 in
17 in
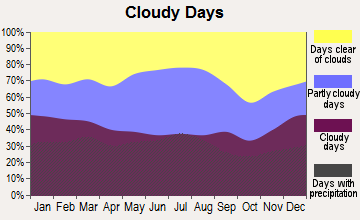
Clouds - Number of days clear of clouds
19.3%
18.3%
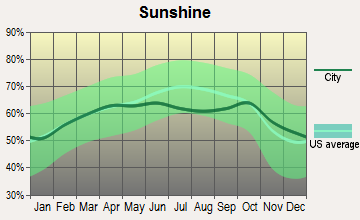
Sunshine amount - Average
63.3%
64.7%
Sunshine amount - Differences during a year
22%
10%
Sunshine amount - Maximum monthly
72%
64%
Sunshine amount - Minimum monthly
50%
54%
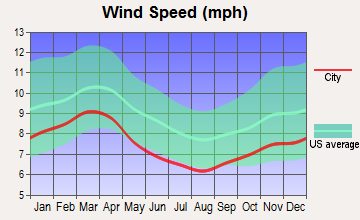
Wind speed - Average
7.2 mph
7.7 mph
Average climate in Austin, Texas
Average climate in Winston-Salem, North Carolina
Air pollution
Type
AQI
CO
NO2
OZONE
PM10
PM25
SO2
Year
Austin
Winston-Salem
Austin
Austin
Winston-Salem
Austin
Winston-Salem
Winston-Salem
Austin
Winston-Salem
Austin
Winston-Salem
2018
76
73
N/A
N/A
4.9
6.7
26.7
32.2
13.9
N/A
8.7
8.7
0.2
0.1
2017
76
69
N/A
N/A
4.6
7.0
29.7
31.9
11.5
N/A
8.3
7.5
0.3
0.1
2016
71
79
N/A
N/A
4.2
6.6
29.5
32.3
12.0
N/A
8.2
7.5
0.2
0.2
2015
78
80
N/A
N/A
4.4
6.8
28.9
32.9
12.3
N/A
8.6
7.9
0.3
0.3
2014
74
79
N/A
N/A
5.2
6.3
28.3
33.2
12.9
N/A
8.7
8.8
0.5
0.4
2013
78
77
0.09
N/A
5.5
6.0
29.5
29.0
12.0
N/A
8.6
8.7
0.5
0.3
2012
86
84
0.13
N/A
5.5
8.9
30.1
31.6
13.5
N/A
8.6
8.5
N/A
0.4
2011
83
84
0.11
N/A
2.6
7.5
33.0
32.2
14.8
N/A
9.1
9.6
N/A
0.5
2010
77
98
0.05
N/A
3.2
9.5
29.4
35.2
16.0
N/A
8.8
11.6
N/A
0.3
2009
76
78
0.05
N/A
2.6
13.3
29.7
28.4
14.2
N/A
9.0
10.8
N/A
3.9
2008
81
97
0.12
N/A
3.2
11.1
30.7
33.7
16.7
N/A
9.7
12.4
N/A
6.3
2007
82
98
0.12
N/A
3.1
11.1
27.1
36.2
19.8
N/A
9.8
13.1
N/A
5.5
2006
89
97
0.14
N/A
3.8
10.3
31.3
32.1
19.4
N/A
10.0
15.1
0.2
5.1
2005
92
78
0.15
N/A
4.4
10.5
29.0
31.1
19.6
N/A
10.7
N/A
0.2
5.1
2004
74
72
0.16
N/A
3.3
12.9
26.8
28.6
19.8
N/A
N/A
N/A
N/A
4.3
2003
85
85
0.26
N/A
4.2
14.8
28.9
32.0
18.9
N/A
N/A
N/A
0.1
5.5
2002
83
92
0.33
N/A
3.9
14.3
27.2
35.4
19.7
N/A
N/A
N/A
N/A
5.0
2001
83
101
0.31
N/A
4.2
16.0
25.5
33.5
21.4
N/A
N/A
N/A
N/A
4.5
2000
86
89
0.28
N/A
4.7
17.1
27.8
32.6
21.2
N/A
N/A
N/A
N/A
4.4
Natural disasters
Type
Austin
Winston-Salem
Tornado activity compared to U.S. average
137.9%
74.6%
Earthquake activity compared to U.S. average
80.4%
74.8%
Natural disasters compared to U.S. average
29%
15%
Transportation
Austin has been investing in its public transit system, but many residents still rely on cars, leading to traffic congestion. On the other hand, Winston-Salem's traffic is a lot less, but public transit options are somewhat limited.
Transport
Type
Austin
Winston-Salem
Amtrak stations
1
1
Amtrak stations nearby
1
2
FAA registered aircraft
911
5
FAA registered aircraft manufacturers and dealers
21
0
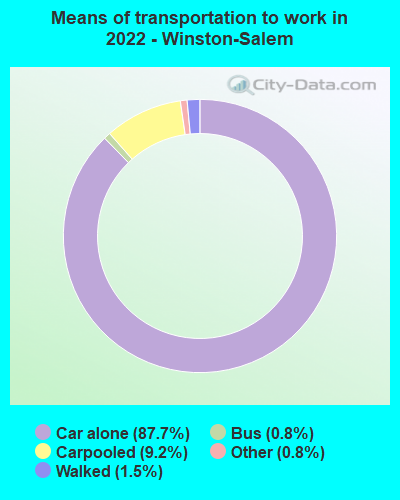
Means of transportation to work
Type
Austin
Winston-Salem
Bicycle
0.8%
0.1%
Bus
1.5%
1.1%
Carpooled
7.9%
8.3%
Car alone
85.9%
88%
Motorcycle
0.3%
0.1%
Taxicab
0.1%
0.3%
Walked
2%
1.4%
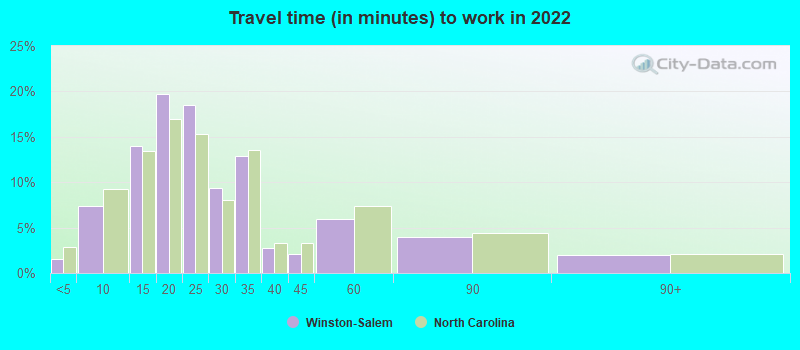
Average travel time to work
Type
Austin
Winston-Salem
Average
29.9 min
25.9 min
Other means
22.7 min
20.5 min
Public transportation
37.9 min
36.3 min
Private vehicle occupancy
Type
Austin
Winston-Salem
Average
1.1
1.1
Drove alone
91.2%
89.9%
In 2 person carpool
6.3%
6.9%
In 3 person carpool
1.7%
2.1%
In 4 person carpool
0.6%
1%
In 7+ person carpool
0.2%
0.1%
How many people usually rode to work in the car, truck or van.
Real Estate
The real estate market in Austin is fiercely competitive with home prices substantially higher than national averages. Winston-Salem, by comparison, has a more affordable and accessible real estate market, with home prices well below the national average.
Neighborhoods
Austin offers a mix of dynamic urban neighborhoods and more laid-back suburban areas. Winston-Salem has a historic charm with older neighborhoods and a well-preserved downtown. Both cities offer diversity in terms of neighborhoods, so potential residents should be able to find an area that suits their lifestyle.
Houses and residents
Type
Austin
Winston-Salem
Houses
469,156
114,871
Average household size (people)
2.4
2.4
Median year apartment built
1997
1981
Median year house/condo built
1988
1979
Length of stay in the house since moving in
12.1 years
13.4 years
Houses occupied
449,399 (95.8%)
101,551 (88.4%)
Houses occupied by owners
196,458 (43.7%)
56,834 (56%)
Houses occupied by renters
252,941 (56.3%)
44,717 (44%)
Median rent asked for vacant for-rent units
$1,286
$1,385
Median monthly housing costs
$1,521
$900
Median price asked for vacant for-sale houses and condos
$549,769
$293,191
Estimated median house or condo value
$482,900
$197,300
Median numbers of rooms
4.4
5.4
Median number of rooms in apartments
3.4
4.1
Median number of rooms in houses and condos
6
6.5
Median house price - detached houses
$595,996
$248,060
Median house price - in 2-unit structures
$393,984
$160,570
Median house price - in 3-to-4-unit structures
$262,826
$197,525
Median house price - in 5 or more unit structures
$576,111
$183,621
Median house price - mobile homes
$56,102
$59,840
Median house price - Townhouses or other attached units
$459,657
$172,289
Median house price - All housing units
$571,154
$238,779
Median house age
28
41
Renting percentage
54.9%
43.7%
Housing density (houses/condos per square mile)
1,865.3
1,055.3
House value disparities
28.4%
37.7%
Household income disparities
44.8%
47.4%
Median household income for houses/condes with a mortgage
$141,177
$79,673
Median household income for apartments without a mortgage
$86,430
$66,938
Housing units without a mortgage
1,799 (1.3%)
1,301 (3.5%)
Housing units with both a second mortgage and home equity loan
6,421 (4.8%)
3,722 (10%)
Housing units with a mortgage
132,628 (98.7%)
36,072 (96.5%)
Housing units with a home equity loan
206 (0.2%)
309 (0.8%)
Housing units with a second mortgage
8,515 (6.3%)
4,187 (11.2%)
House/condo owner moved in on average (years ago)
9
11
House/condo renter moved in on average (years ago)
1
1
Housing units lacking complete kitchen facilities
0.9%
1.8%
Housing units lacking complete plumbing facilities
0.6%
0.7%
Housing units in structures
Housing units in structures
Austin
Winston-Salem
One, detached
43.1%
62.7%
One, attached
5.2%
4.6%
Two
2.4%
1.4%
3 or 4
4.1%
5.8%
5 to 9
7.2%
7.8%
10 to 19
11.0%
7.1%
20 to 49
8.9%
3.5%
50 or more
17.2%
5.1%
Mobile homes
1.0%
2.1%
Median real estate property taxes paid for housing units
Self-employed workers in own not incorporated business
38,777
4,600
State government workers
46,229
3,265
Unpaid family workers
102
727
Industries and Occupations
Austin is known as the "Silicon Hills" due to its thriving tech industry. On the other hand, Winston-Salem's economy is diverse with healthcare and education leading the way. Looking at occupations, Austin has a significant amount of jobs in tech-related fields, whereas Winston-Salem has more in healthcare and education.
In Austin, the healthcare sector is strong, with excellent facilities like the Dell Medical School at the University of Texas. Winston-Salem also excels in healthcare, being home to the Wake Forest Baptist Medical Center, a nationally recognized academic medical center.
Health (county statistics)
Type
Austin
Winston-Salem
General health status score of residents in this county from 1 (poor) to 5 (excellent)
Austin has been grappling with infrastructure issues due to its rapid growth, and traffic congestion can be a significant problem. Meanwhile, Winston-Salem's infrastructure is less strained, with traffic relatively light overall. However, Austin has invested heavily in bike lanes and offers more accessibility for cyclists.
Infrastructure
Type
Austin
Winston-Salem
Hospitals
65
4
TV stations
20
10
Arenas or stadiums
2
1
Bank branches located here
264
22
Bank institutions located here
43
6
Main business address for public companies
44
4
Drinking water stations with no reported violations in the past
46
22
Drinking water stations with reported violations in the past
HMDA - Conventional home purchase loans - Applications denied
Year
Austin
Winston-Salem
1999
4,733
1,470
2000
2,950
940
2001
2,038
600
2002
1,772
769
2003
2,213
564
2004
2,458
564
2005
3,121
664
2006
3,367
738
2007
2,560
591
2008
1,747
270
2009
1,067
158
Culture and Food
Austin is renowned for its vibrant music and food scenes, hosting events like Austin City Limits and South by Southwest. It's also famous for Tex-Mex and barbecue. Winston-Salem, on the other hand, has a rich history and arts scene. It's known for North Carolina-style barbecue and Moravian cookies.
Sports Teams
Austin is home to the Austin FC soccer team, while Winston-Salem does not have any major league sports teams, but hosts minor league baseball and basketball teams. Austin also will be home to a new major league soccer team, Austin FC.


 Austin, TX
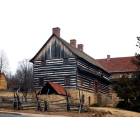
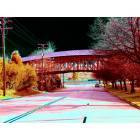
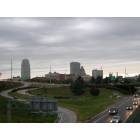
 Winston-Salem, NC