Baltimore and Greensboro are two distinct cities with unique characteristics. Baltimore, with its rich history, robust job market, and bustling city life, offers an urban metropolitan experience. Greensboro, on the other hand, offers a quieter, more affordable, and family-friendly environment. Both cities provide diverse cultural experiences, excellent educational opportunities, and varying climates.
Distance between
Baltimore, MD and
Greensboro, NC : 283.5 miles
Baltimore's population is larger by 93%. Its population has decreased by 74,656 people (11.5%) since 2000. The population of Greensboro has grown by 74,372 people (33.2%) during that time.
Baltimore has had struggles with crime, and its crime rates tend to be higher than the national average. In contrast, Greensboro's crime rates are relatively lower, which may appeal to individuals seeking a safer environment for residing or visiting. Police presence is noticeable in both cities, and community efforts to reduce crime are ongoing.
City-data.com crime index counts serious crimes and violent crime more heavily. It adjusts for the number of visitors and daily workers commuting into cities. (higher means more crime, U.S. average = 301.1)
City-data.com crime index counts serious crimes and violent crime more heavily. It adjusts for the number of visitors and daily workers commuting into cities. (higher means more crime, U.S. average = 301.1)
Sex Offenders
According to our data, there are 1,558 registered sex offenders living in Baltimore and 615 registered sex offenders living in . The ratio of residents to sex offenders in Baltimore is 395 to 1; the ratio in Greensboro is 467 to 1. The number of registered sex offenders compared to the number of residents in Baltimore is near to than in Greensboro.
Cost of Living
The cost of living in Baltimore is higher than the national average but is often balanced by higher salaries of local jobs. In contrast, Greensboro's cost of living is below the national average, making it an affordable option for both residents and tourists.
Income Tax
Baltimore levies a high maximum local income tax of 3.2% on top of Maryland's 5.75% state income tax. Conversely, Greensboro residents are subject to North Carolina's flat state income tax rate of 5.25%.
Property Tax
Baltimore has a high property tax rate of 2.248%, one of the highest in the country. Greensboro's property tax is lower, at approximately 0.77%.
Sales Tax
The sale tax in Baltimore is 6%, while Greensboro has a slightly higher rate at 6.75%.
Income
Type
Baltimore
Greensboro
Estimated median household income
$54,652
$51,825
Estimated per capita income
$35,091
$32,208
Cost of living index (U.S. average is 100)
105.7
91.2
If you make $50,000 in Greensboro, you will have to make $57,950 in Baltimore to maintain the same standard of living.
Geographical Conditions
Baltimore is on the eastern coast of the U.S. with numerous waterways and located near the Chesapeake Bay and the Atlantic Ocean. Greensboro is situated in the Piedmont Triad region, between the Appalachian Mountains and the Atlantic Ocean, offering beautiful landscapes.
Baltimore is home to numerous esteemed schools and universities like Johns Hopkins University and Loyola University Maryland. Greensboro also offers a variety of great education options, including the University of North Carolina at Greensboro and Guilford College.
Baltimore boasts a diverse economy with significant sectors in healthcare, education, and technology. Greensboro's economy is more focused on manufacturing, aviation, and education, showing continuous growth.
Biggest Employers
Major employers in Baltimore include Johns Hopkins University and Hospital, and Under Armour. In Greensboro, major employers are Cone Health System, the Guilford County Schools, and General Dynamics.
There were 191 building permits issued in Baltimore in 2012 (116 more than in 2011) compared to 529 building permits issued in Greensboro in 2012 (235 more than in 2011).
In Baltimore (Baltimore city), 87.4% voted for Democrats and 11.1% for Republicans in 2012 Presidential Election. In Greensboro (Guilford County), 57.8% voted for Democrats and 41.4% for Republicans.
Elections
Type
Democrats
Republicans
Other
Year
Baltimore
Greensboro
Baltimore
Greensboro
Baltimore
Greensboro
2020
87.5%
61.1%
10.7%
37.9%
1.8%
1.1%
2016
84.8%
58.0%
10.5%
38.1%
4.6%
3.9%
2012
87.4%
57.8%
11.1%
41.4%
1.4%
0.8%
2008
87.6%
58.9%
11.7%
40.5%
0.6%
0.5%
2004
82.5%
50.2%
17.1%
49.3%
0.5%
0.4%
2000
82.9%
48.6%
14.2%
50.8%
2.9%
0.7%
1996
79.3%
46.9%
15.5%
45.9%
5.1%
7.2%
Breakdown of population affiliated with a religious congregation
Type
Adherents
Congregations
Religion
Baltimore
Greensboro
Baltimore
Greensboro
CATHOLIC CHURCH
11.0%
3.6%
8.2%
1.0%
EPISCOPAL CHURCH
1.6%
1.2%
4.0%
1.5%
AMERICAN BAPTIST CHURCHES IN THE USA
1.4%
0.1%
2.2%
0.3%
SOUTHERN BAPTIST CONVENTION
1.4%
9.6%
7.3%
16.5%
EVANGELICAL LUTHERAN CHURCH IN AMERICA
1.0%
0.8%
4.3%
2.2%
MUSLIM ESTIMATE
0.6%
0.8%
1.5%
0.7%
SEVENTH DAY ADVENTIST CHURCH
0.5%
0.5%
1.5%
0.7%
LUTHERAN CHURCH
0.4%
0.2%
1.8%
0.7%
INTERNA PENTECO HOLINESS CHURCH
0.2%
0.3%
0.3%
1.5%
Weather
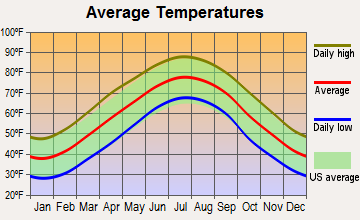
Baltimore experiences a full range of weather, with hot, humid summers and chilly winters with occasional snowfall. Greensboro has a more temperate climate, with milder winters but similarly hot summers. Both cities experience beautiful springs and falls, making them attractive for outdoor enthusiasts.
Weather and climate
Type
Baltimore
Greensboro
Temperature - Average
54.5°F
58.4°F
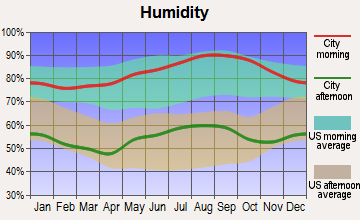
Humidity - Average morning or afternoon humidity
70.4%
72.8%
Humidity - Differences between morning and afternoon humidity
36%
42%
Humidity - Maximum monthly morning or afternoon humidity
84%
88%
Humidity - Minimum monthly morning or afternoon humidity
48%
46%
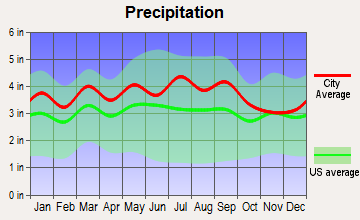
Precipitation - Yearly average
42.9 in
44.3 in
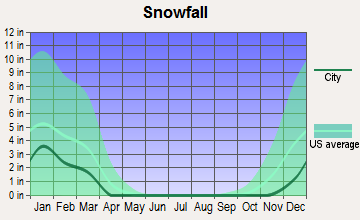
Snowfall - Yearly average
39.6 in
17 in
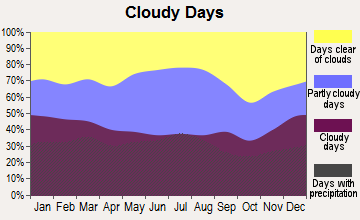
Clouds - Number of days clear of clouds
17.5%
18.3%
Sunshine amount - Average
60.3%
64.7%
Sunshine amount - Differences during a year
16%
10%
Sunshine amount - Maximum monthly
63%
64%
Sunshine amount - Minimum monthly
47%
54%
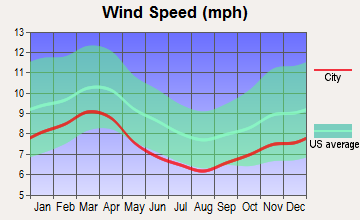
Wind speed - Average
7.9 mph
7.7 mph
Average climate in Baltimore, Maryland
Average climate in Greensboro, North Carolina
Air pollution
Type
AQI
CO
NO2
OZONE
PM10
PM25
SO2
Year
Baltimore
Greensboro
Baltimore
Greensboro
Baltimore
Greensboro
Baltimore
Greensboro
Baltimore
Greensboro
Baltimore
Greensboro
Baltimore
Greensboro
2018
89
69
0.23
N/A
11.8
6.7
28.3
32.1
N/A
16.7
7.9
7.4
0.1
0.2
2017
89
71
0.25
N/A
12.1
7.0
27.7
29.1
N/A
11.9
8.2
7.9
0.2
0.3
2016
102
82
0.26
N/A
13.0
6.6
28.3
31.9
N/A
11.1
7.7
8.5
0.3
0.2
2015
89
74
0.28
N/A
12.4
6.8
28.3
28.8
N/A
12.3
9.5
8.2
0.4
0.3
2014
82
72
0.25
N/A
11.8
6.3
25.7
33.5
N/A
12.9
10.9
9.0
0.6
0.4
2013
86
74
0.22
N/A
10.7
6.0
25.6
28.5
N/A
12.0
9.6
8.3
0.5
0.3
2012
98
83
0.24
N/A
11.3
8.9
25.0
32.5
N/A
13.5
11.2
9.2
0.5
0.4
2011
101
84
0.24
N/A
12.5
7.5
25.1
34.7
N/A
14.8
12.1
9.9
0.8
1.0
2010
110
97
0.24
N/A
13.1
9.5
26.9
35.6
N/A
16.0
12.2
10.4
1.0
0.3
2009
84
81
0.23
N/A
12.2
13.3
23.5
30.4
N/A
14.2
10.4
9.9
1.4
3.9
2008
96
98
0.25
N/A
13.6
11.1
21.6
33.7
N/A
16.7
12.8
12.7
1.8
6.3
2007
107
102
0.21
N/A
13.8
11.1
23.2
37.9
N/A
19.8
14.0
13.7
2.5
5.5
2006
112
90
N/A
N/A
12.0
10.3
24.6
33.6
N/A
19.4
14.7
14.9
N/A
5.1
2005
111
83
N/A
0.70
14.3
10.5
26.3
33.1
23.0
19.6
17.1
N/A
N/A
5.1
2004
108
76
N/A
0.56
15.3
12.9
28.0
24.9
23.1
19.8
16.3
N/A
N/A
4.3
2003
110
88
N/A
0.56
17.8
14.8
22.4
29.3
N/A
18.9
13.9
N/A
N/A
5.5
2002
119
99
N/A
0.65
17.4
14.3
19.4
34.8
N/A
19.7
16.3
N/A
5.8
5.0
2001
104
103
N/A
0.70
18.2
16.0
23.9
31.0
N/A
21.4
N/A
N/A
6.0
4.5
2000
101
90
N/A
0.68
17.0
17.1
22.4
31.2
N/A
21.2
N/A
N/A
6.3
4.4
Natural disasters
Type
Baltimore
Greensboro
Tornado activity compared to U.S. average
117.8%
76.6%
Earthquake activity compared to U.S. average
40.6%
67.4%
Natural disasters compared to U.S. average
0%
20%
Transportation
Baltimore offers an extensive public transit system, including buses, light rail, and a metro system, making commuting easy. Greensboro has a decent bus system and good road infrastructure for commuting.
Transport
Type
Baltimore
Greensboro
Amtrak stations
2
1
Amtrak stations nearby
2
2
FAA registered aircraft
136
300
FAA registered aircraft manufacturers and dealers
2
13
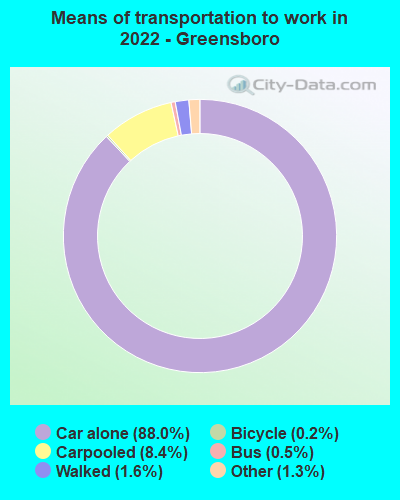
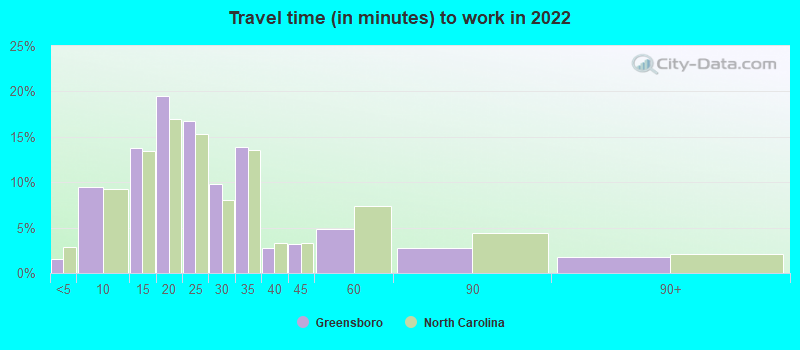
Means of transportation to work
Type
Baltimore
Greensboro
Bicycle
0.4%
0.1%
Bus
6.2%
1%
Carpooled
7.3%
6.8%
Car alone
77.2%
89.4%
Railroad
0.3%
0%
Streetcar
1.2%
0.1%
Subway
0.2%
0%
Taxicab
0.7%
0.2%
Walked
4.5%
1.2%
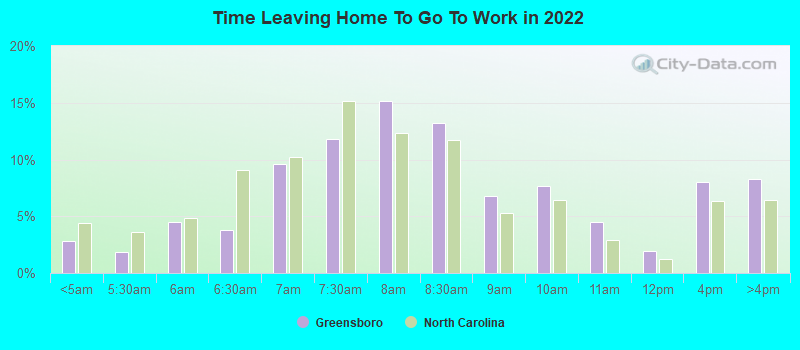
Average travel time to work
Type
Baltimore
Greensboro
Average
32.3 min
24.8 min
Other means
26.3 min
20.9 min
Public transportation
46.8 min
42.2 min
Private vehicle occupancy
Type
Baltimore
Greensboro
Average
1.1
1.1
Drove alone
90.7%
91.9%
In 2 person carpool
7.5%
5.8%
In 3 person carpool
1%
1.5%
In 4 person carpool
0.4%
0.5%
In 5-6 person carpool
0.3%
0.1%
In 7+ person carpool
0.2%
0.2%
How many people usually rode to work in the car, truck or van.
Real Estate
Real estate in Baltimore tends to be pricier, but the market is diverse, offering everything from luxurious condos to historic townhouses. Greensboro's real estate market is less expensive and features numerous suburban communities and upscale apartments.
Neighborhoods
Both cities offer diverse neighborhoods - from the seaside charm of Baltimore's Inner Harbor to Greensboro's historic districts like College Hill.
Houses and residents
Type
Baltimore
Greensboro
Houses
293,487
139,565
Average household size (people)
2.4
2.3
Median year apartment built
1959
1989
Median year house/condo built
1944
1981
Length of stay in the house since moving in
15.7 years
13.6 years
Houses occupied
254,370 (86.7%)
123,955 (88.8%)
Houses occupied by owners
123,249 (48.5%)
69,834 (56.3%)
Houses occupied by renters
131,121 (51.5%)
54,121 (43.7%)
Median rent asked for vacant for-rent units
$1,254
$1,295
Median monthly housing costs
$1,196
$981
Median price asked for vacant for-sale houses and condos
$207,303
$336,309
Estimated median house or condo value
$193,100
$186,200
Median numbers of rooms
5.6
5.3
Median number of rooms in apartments
4.2
4
Median number of rooms in houses and condos
6.5
6.3
Median house price - detached houses
$321,473
$261,886
Median house price - in 2-unit structures
$218,934
$205,442
Median house price - in 3-to-4-unit structures
$142,945
$240,978
Median house price - in 5 or more unit structures
$257,173
$129,256
Median house price - mobile homes
$269,877
$86,037
Median house price - Townhouses or other attached units
$210,096
$221,087
Median house price - All housing units
$246,241
$252,845
Median house age
72
37
Renting percentage
52.3%
47.5%
Housing density (houses/condos per square mile)
3,632.1
1,332.9
House value disparities
38.5%
36.2%
Household income disparities
49.4%
45.9%
Median household income for houses/condes with a mortgage
$85,990
$75,953
Median household income for apartments without a mortgage
$53,334
$62,470
Housing units without a mortgage
2,415 (2.8%)
1,421 (3.1%)
Housing units with both a second mortgage and home equity loan
5,740 (6.6%)
3,736 (8.1%)
Housing units with a mortgage
84,578 (97.2%)
44,909 (96.9%)
Housing units with a home equity loan
579 (0.7%)
227 (0.5%)
Housing units with a second mortgage
8,544 (9.8%)
5,099 (11%)
House/condo owner moved in on average (years ago)
14
12
House/condo renter moved in on average (years ago)
3
1
Housing units lacking complete kitchen facilities
6%
1.8%
Housing units lacking complete plumbing facilities
5.1%
0.5%
Housing units in structures
Housing units in structures
Baltimore
Greensboro
One, detached
16.4%
55.4%
One, attached
49.5%
7.3%
Two
4.5%
1.7%
3 or 4
4.9%
5.4%
5 to 9
5.5%
9.0%
10 to 19
4.8%
8.6%
20 to 49
2.8%
7.0%
50 or more
11.4%
4.3%
Mobile homes
0.2%
1.3%
Boats, RVs, vans, etc.
0.1%
0.0%
Median real estate property taxes paid for housing units
Self-employed workers in own not incorporated business
12,671
6,258
State government workers
20,410
9,041
Unpaid family workers
356
205
Industries and Occupations
Major industries in Baltimore include health care, education, federal agencies, and tech startups. In Greensboro, you'll find industries such as transportation, textiles, food processing, and aviation.
Baltimore is renowned for its healthcare facilities, including the world-renowned Johns Hopkins Hospital. Greensboro has quality healthcare systems too, with Cone Health being a leading provider.
Health (county statistics)
Type
Baltimore
Greensboro
General health status score of residents in this county from 1 (poor) to 5 (excellent)
Baltimore boasts a comprehensive infrastructure with many modern buildings, an efficient public transportation system, and a bustling seaport. Greensboro also has well-planned infrastructure, including a decent road network, but is less urbanized than Baltimore.
Infrastructure
Type
Baltimore
Greensboro
Hospitals
45
16
TV stations
19
10
Arenas or stadiums
3
1
Bank branches located here
215
97
Bank institutions located here
44
19
Main business address for public companies
27
11
Drinking water stations with no reported violations in the past
13
3
Drinking water stations with reported violations in the past
HMDA - Conventional home purchase loans - Applications denied
Year
Baltimore
Greensboro
1999
2,486
1,540
2000
2,058
1,012
2001
1,371
739
2002
1,111
787
2003
1,526
568
2004
2,929
692
2005
4,981
748
2006
5,533
880
2007
3,592
653
2008
1,111
290
2009
381
164
Culture and Food
Baltimore offers diverse cultural experiences with its famous seafood cuisine, historical sites, and an active performing arts scene. Greensboro also boasts a rich culture with Southern cuisine, art galleries, and numerous music festivals.
Sports Teams
Baltimore is home to professional sports teams such as the Baltimore Ravens (NFL) and the Baltimore Orioles (MLB). Greensboro doesn’t have any major league sports teams but is home to minor league and college sports teams.


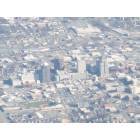
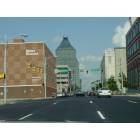

 Baltimore, MD
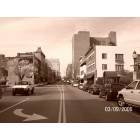
 Greensboro, NC