Baltimore, MD vs Pittsburgh, PA - Advanced U.S. city comparison tool

Baltimore, MD vs Pittsburgh, PA

In essence, Baltimore, MD and Pittsburgh, PA, two iconic cities in the United States, differ based on their crime rates, weather patterns, living costs, education systems, economic activities, infrastructure status, occupational opportunities, renowned employers, real estate conditions, neighborhood charm, transportation options, taxed amounts, cultural practices, sports fanaticism, geographical uniqueness, and health care provision. Each city provides a unique experience for residents and tourists alike, each boasting its unique attractions and challenges.
 
 
Distance between Baltimore, MD and Pittsburgh, PA : 194.6 miles

Baltimore's population is larger by 92%. Its population has decreased by 74,656 people (11.5%) since 2000. The population of Pittsburgh has decreased by 34,132 people (10.2%) during that time.

Population
Type Baltimore Pittsburgh
Population 576,498 300,431
Female / male percentage 53.1% / 46.9%
53.1%
46.9%
51.1% / 48.9%
51.1%
48.9%
Racial makeup - percentage
Ethnicity BaltimorePittsburgh
Black 59.3% 20.8%
White Non-Hispanic 26.8% 63.8%
Hispanic 6.0% 3.5%
Two or more 4.6% 6.1%
Asian 2.5% 5.1%
Racial makeup - absolute values
Ethnicity BaltimorePittsburgh
Black 342,151 62,549
White Non-Hispanic 154,743 191,552
Hispanic 34,810 10,443
Two or more 26,513 18,301
Asian 14,262 15,463
American Indian 468 249
Pacific Islander 316 62

Crime and Safety

Baltimore struggles with a relatively high crime rate, particularly in regard to violent offenses, which can be noticeably higher than the national average. It is, however, essential to understand that like many cities, crime in Baltimore is concentrated in specific areas. Pittsburgh, on the other hand, boasts a lower crime rate, including less violent crimes. Both cities have dedicated law enforcement agencies working hard to improve safety and reduce crime rates.

Crime by year per 100,000 residents
Type City-data.com crime indexRobberies per 100,000Murders per 100,000Rapes per 100,000Assaults per 100,000Burglaries per 100,000Theft per 100,000Auto theft per 100,000Arson per 100,000
Year BaltimorePittsburghBaltimorePittsburghBaltimorePittsburghBaltimorePittsburghBaltimorePittsburghBaltimorePittsburghBaltimorePittsburghBaltimorePittsburghBaltimorePittsburgh
2019 N/A 257.1 0.0 181.3 0.0 8.7 0.0 39.6 0.0 252.5 0.0 353.4 0.0 1,605.7 0.0 178.7 0.0 30.9
2018 N/A 340.2 0.0 230.0 0.0 18.8 0.0 40.0 0.0 289.9 0.0 443.2 0.0 2,331.9 0.0 241.0 0.0 33.7
2017 909.2 356.8 958.7 262.2 55.8 18.0 62.3 29.4 950.2 346.8 1,311.3 526.3 2,773.6 2,365.9 843.3 222.3 42.6 44.5
2016 823.6 402.7 846.7 330.6 51.4 18.8 48.4 33.1 833.9 399.7 1,192.6 604.4 2,725.6 2,387.9 859.8 270.5 41.9 50.6
2015 776.3 377.0 694.2 279.6 55.4 18.6 46.2 26.7 740.1 381.3 1,248.6 715.9 2,842.3 2,312.7 889.5 195.8 41.9 56.1
2014 662.0 406.8 589.7 320.5 33.8 22.4 39.3 29.6 675.7 425.5 1,110.8 692.1 2,888.2 2,326.6 719.5 194.1 34.2 62.4
2013 698.3 379.3 599.7 310.8 37.4 14.6 47.9 25.4 716.3 383.6 1,187.0 706.4 3,042.7 2,359.3 715.0 200.2 44.5 67.6
2012 680.4 387.8 576.4 363.3 34.5 13.1 50.7 15.1 743.6 360.4 1,242.3 812.8 2,781.4 2,438.2 636.6 174.3 38.7 79.5
2011 686.2 398.4 551.5 364.9 31.4 14.3 54.4 21.7 780.3 401.5 1,374.3 870.4 2,713.6 2,234.9 669.9 155.5 49.0 63.2
2010 691.2 450.4 537.2 386.8 35.9 17.9 42.7 21.5 884.4 487.3 1,219.6 958.6 2,624.6 2,495.9 710.0 213.6 51.7 50.1
2009 690.7 474.8 580.3 437.8 37.3 12.5 24.7 37.2 870.6 501.2 1,220.8 900.3 2,620.9 2,605.1 723.9 265.8 54.3 46.8
2008 724.9 544.1 634.5 497.5 36.9 23.2 21.6 43.9 895.6 519.4 1,234.3 1,003.4 2,715.3 2,666.0 868.0 406.4 67.8 31.6
2007 748.6 558.3 624.0 511.2 45.2 16.7 23.4 41.3 938.6 537.5 1,182.4 1,094.9 2,682.0 2,875.6 931.7 492.7 65.2 25.3
2006 774.4 562.0 663.3 530.5 43.3 17.3 21.6 31.4 968.2 490.8 1,193.3 1,143.9 2,894.0 2,975.3 982.2 574.5 67.1 21.6
2005 665.6 410.2 609.9 488.8 42.0 19.0 25.3 35.4 1,077.4 480.1 1,144.6 912.4 3,071.5 3,125.0 969.0 687.2 65.8 16.6
2004 709.6 410.3 638.5 479.3 43.5 13.8 28.7 29.6 1,128.7 596.0 1,258.3 911.0 3,368.5 2,944.4 1,058.2 715.7 67.8 26.0
2003 697.1 428.4 673.2 487.6 41.9 20.0 31.7 40.6 988.3 513.3 1,208.4 948.4 3,541.1 3,164.3 1,063.8 788.8 75.2 28.9

City-data.com crime index counts serious crimes and violent crime more heavily. It adjusts for the number of visitors and daily workers commuting into cities. (higher means more crime, U.S. average = 301.1)


Crime per year
Type City-data.com crime indexRobberiesMurdersRapesAssaultsBurglariesTheftAuto theftArson
Year BaltimorePittsburghBaltimorePittsburghBaltimorePittsburghBaltimorePittsburghBaltimorePittsburghBaltimorePittsburghBaltimorePittsburghBaltimorePittsburghBaltimorePittsburgh
2019 N/A 257.1 0 545 0 26 0 119 0 759 0 1,062 0 4,826 0 537 0 93
2018 N/A 340.2 0 696 0 57 0 121 0 877 0 1,341 0 7,055 0 729 0 102
2017 909.2 356.8 5,879 802 342 55 382 90 5,827 1,061 8,041 1,610 17,008 7,238 5,171 680 261 136
2016 823.6 402.7 5,236 1,000 318 57 299 100 5,157 1,209 7,375 1,828 16,855 7,222 5,317 818 259 153
2015 776.3 377.0 4,313 858 344 57 287 82 4,598 1,170 7,757 2,197 17,658 7,097 5,526 601 260 172
2014 662.0 406.8 3,677 986 211 69 245 91 4,213 1,309 6,926 2,129 18,008 7,157 4,486 597 213 192
2013 698.3 379.3 3,734 956 233 45 298 78 4,460 1,180 7,391 2,173 18,946 7,258 4,452 616 277 208
2012 680.4 387.8 3,605 1,134 216 41 317 47 4,651 1,125 7,770 2,537 17,397 7,610 3,982 544 242 248
2011 686.2 398.4 3,457 1,126 197 44 341 67 4,891 1,239 8,615 2,686 17,010 6,897 4,199 480 307 195
2010 691.2 450.4 3,336 1,190 223 55 265 66 5,492 1,499 7,573 2,949 16,298 7,678 4,409 657 321 154
2009 690.7 474.8 3,707 1,367 238 39 158 116 5,561 1,565 7,798 2,811 16,741 8,134 4,624 830 347 146
2008 724.9 544.1 4,026 1,541 234 72 137 136 5,683 1,609 7,832 3,108 17,230 8,258 5,508 1,259 430 98
2007 748.6 558.3 3,895 1,596 282 52 146 129 5,859 1,678 7,381 3,418 16,742 8,977 5,816 1,538 407 79
2006 774.4 562.0 4,229 1,722 276 56 138 102 6,173 1,593 7,608 3,713 18,451 9,658 6,262 1,865 428 70
2005 665.6 410.2 3,910 1,617 269 63 162 117 6,907 1,588 7,338 3,018 19,691 10,337 6,212 2,273 422 55
2004 709.6 410.3 4,050 1,602 276 46 182 99 7,159 1,992 7,981 3,045 21,366 9,841 6,712 2,392 430 87
2003 697.1 428.4 4,339 1,635 270 67 204 136 6,370 1,721 7,789 3,180 22,824 10,610 6,857 2,645 485 97

City-data.com crime index counts serious crimes and violent crime more heavily. It adjusts for the number of visitors and daily workers commuting into cities. (higher means more crime, U.S. average = 301.1)

Sex Offenders

According to our data, there are 1,558 registered sex offenders living in Baltimore and 699 registered sex offenders living in .
The ratio of residents to sex offenders in Baltimore is 395 to 1; the ratio in Pittsburgh is 434 to 1.
The number of registered sex offenders compared to the number of residents in Baltimore is near to than in Pittsburgh.

Cost of Living

Pittsburgh has a noticeably lower cost of living compared to Baltimore. In terms of housing costs, groceries, and other day-to-day expenses, Pittsburgh stands out as the more affordable city. However, Baltimore offers a greater diversity in terms of dining and shopping experiences, which may justify the slightly higher cost of living.

Income Tax

In Baltimore, the city and state combined income tax can range up to 8.25%, while in Pittsburgh, the income tax rate (city and state combined) amounts to about 3.07% plus a local tax of 3%.

Property Tax

Baltimore's combined city-state property tax rate is higher than Pittsburgh's. Baltimore homeowners might encounter rates of about 2.248%, while Pittsburgh homeowners are looking at rates around 1.50%.

Sales Tax

In Baltimore, Maryland, the combined city and state sales tax rate is 6%. Pittsburgh, Pennsylvania, has a relatively higher combined city and state sales tax rate of 7%.
Income
Type Baltimore Pittsburgh
Estimated median household income $54,652 $57,821
Estimated per capita income $35,091 $39,779
Cost of living index (U.S. average is 100) 105.7 95.2

If you make $50,000 in Pittsburgh, you will have to make $55,515 in Baltimore to maintain the same standard of living.

Geographical Conditions

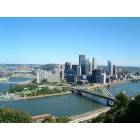
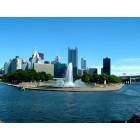
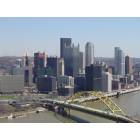
Baltimore is considered a coastal city with the iconic Inner Harbor and Chesapeake Bay nearby. Pittsburgh is known as the "City of Bridges" due to its many rivers and bridges, and its geographical situation in the Appalachian Mountains leads to some hilly terrain.
Geographical information
Type Baltimore Pittsburgh
Land area 80.8 sq. miles 55.6 sq. miles
Population density 7,134.5 people per sq. mile 5,404.9 people per sq. mile
Elevation 100 feet 770 feet
Relative area comparison
Baltimore, MD Pittsburgh, PA
First ancestry reported - percentage
Ancestry BaltimorePittsburgh
German 2.2% 8.0%
Irish 1.8% 6.1%
Italian 1.3% 8.2%
English 1.2% 2.3%
Polish 1.0% 4.2%
Scottish 0.3% 0.7%
Greek 0.3% 0.3%
Russian 0.3% 1.2%
Scotch-Irish 0.2% 0.6%
West Indian 0.2% 0.0%
Hungarian 0.2% 0.5%
French 0.2% 0.2%
Lithuanian 0.1% 0.2%
Dutch 0.1% 0.3%
Ukrainian 0.1% 0.6%
Slovak 0.0% 1.0%
Arab 0.0% 0.2%
Population origin - absolute values
Ancestry BaltimorePittsburgh
German 8,006 10,624
Irish 6,860 8,082
Italian 4,797 10,853
English 4,415 3,119
Polish 3,854 5,549
Russian 1,244 1,554
Scottish 1,175 961
Greek 994 446
West Indian 759 16
French 700 326
Scotch-Irish 679 852
Hungarian 564 677
Ukrainian 406 827
Dutch 316 359
Swedish 305 212
Lithuanian 266 293
Czech 262 220
Norwegian 256 137
Swiss 183 88
Welsh 157 177
Foreign born residents - absolute values
Type Count
Region BaltimorePittsburgh
All 49,825 27,719
Africa 10,854 3,023
Asia 12,475 13,551
Europe 5,198 5,342
Latin America 17,306 4,051
North America 694 931
Oceania 335 229
Foreign born residents - percentage
Type Percentage
Region BaltimorePittsburgh
All 8.6% 9.2%
Africa 1.9% 1.0%
Asia 2.2% 4.5%
Europe 0.9% 1.8%
Latin America 3.0% 1.3%
North America 0.1% 0.3%

Education

Both cities are known for their education institutions. Baltimore is home to prestigious universities like Johns Hopkins University and Loyola University Maryland. Pittsburgh is equally competitive, hosting the University of Pittsburgh and the renowned Carnegie Mellon University. Both cities have strong commitments to education, including public and private schooling for K-12 levels.
School enrollment
Type Baltimore Pittsburgh
Nursery, preschool 6,447 (4.6%) 2,375 (2.9%)
Kindergarten 7,723 (5.5%) 1,644 (2%)
Grade 1 to 4 20,533 (14.7%) 8,939 (11.1%)
Grade 5 to 8 26,356 (18.9%) 10,072 (12.5%)
Grade 9 to 12 24,547 (17.6%) 9,941 (12.3%)
College undergrad 34,734 (24.9%) 32,377 (40.2%)
Graduate or professional 19,148 (13.7%) 15,188 (18.9%)
Students in private schools - absolute values
Type Count
Grade BaltimorePittsburgh
Grades 1 to 8 (elementary and middle school) 5,471 4,439
Grades 9 to 12 (high school) 3,881 2,529
Undergraduate colleges 12,869 14,313
Students in private schools - percentage
Type Percentage
Grade BaltimorePittsburgh
Grades 1 to 8 (elementary and middle school) 11.7% 23.4%
Grades 9 to 12 (high school) 15.8% 25.4%
Undergraduate colleges 37.1% 44.2%
Educational attainment
Type Baltimore Pittsburgh
Less than high school 11.2% 6.2%
High school or equiv. 26.6% 23.9%
Less than 1 year of college 5.3% 4.9%
1 or more years of college 13.3% 8.7%
Associate degree 6% 8.7%
Bachelor's degree 19.3% 24.4%
Master's degree 12.2% 15%
Profess. school degree 3.7% 4.5%
Doctorate degree 2.6% 3.7%
Education level (25-year-olds and older)
Type Baltimore Pittsburgh
Bachelor's degree or higher 37.7% 47.6%
Graduate or professional degree 18.5% 23.2%
High school or higher 88.8% 93.8%

Work and Economy

Baltimore's economy is diverse with strong sectors in health, science, service, and finance. Government jobs are also prevalent given the city's proximity to Washington D.C. Pittsburgh's economy has transitioned from a steel-based industry to one focused on healthcare, education, and technology, with many calling it the new "Silicon Valley" of the east.

Biggest Employers

Johns Hopkins University and its healthcare system are the largest employers in Baltimore. In Pittsburgh, the University of Pittsburgh Medical Center and the University of Pittsburgh are significant contributors to employment.
Employment and residency - absolute values
Kind BaltimorePittsburgh
Work and live in this city 154,463 98,005
Work and live in this county 192,124 140,844
Workers who work outside the city they live in 496,691 236,558
Workers who work outside the county they live in 71,754 7,436
Working at home 63,694 44,982
Not working at home 200,184 103,298
Daytime population change due to commuting 92,625 138,191
Employment and residency - percentage
Kind BaltimorePittsburgh
Work and live in this city 61.9% 69.1%
Work and live in this county 72.8% 95.0%
Workers who work outside the city they live in 38.1% 30.9%
Workers who work outside the county they live in 27.2% 5.0%
Working at home 24.1% 30.3%
Not working at home 75.9% 69.7%
Daytime population change due to commuting 14.2% 41.3%
Geographical mobility: all
Type all
Mobility BaltimorePittsburgh
Same house 1 year ago 85.3% 79.6%
Moved from abroad 0.5% 1.0%
Moved within same county 6.3% 11.1%
Moved from different state 3.7% 5.2%
Moved within same state 4.1% 3.2%
Geographical mobility: Asian
Type Asian
Mobility BaltimorePittsburgh
Same house 1 year ago 70.4% 55.5%
Moved from abroad 4.2% 15.5%
Moved within same county 9.1% 11.3%
Moved from different state 13.2% 16.4%
Moved within same state 3.2% 1.2%
Geographical mobility: Black
Type Black
Mobility BaltimorePittsburgh
Same house 1 year ago 90.0% 89.2%
Moved from abroad 0.1% 0.4%
Moved within same county 5.5% 6.6%
Moved from different state 1.2% 2.1%
Moved within same state 3.3% 1.7%
Geographical mobility: White
Type White
Mobility BaltimorePittsburgh
Same house 1 year ago 82.0% 78.7%
Moved from abroad 0.5% 0.2%
Moved within same county 6.3% 11.7%
Moved from different state 6.8% 5.8%
Moved within same state 4.5% 3.6%
Building permits
Type Average valueCount
City BaltimorePittsburghBaltimorePittsburgh
1997 $100,200 $110,800 17 161
1998 $105,900 $95,800 64 112
1999 $104,300 $92,000 46 178
2000 $85,700 $155,300 219 182
2001 $91,000 $112,300 115 86
2002 $94,500 $144,000 181 145
2003 $73,500 $144,000 206 106
2004 $101,100 $148,600 433 131
2005 $117,100 $221,600 643 65
2006 $164,500 $155,800 332 123
2007 $152,300 $130,400 204 117
2008 $139,700 $196,700 153 185
2009 $111,800 $179,600 137 118
2010 $125,600 $148,300 118 147
2011 $131,000 $220,300 75 284
2012 $134,800 $236,600 164 137
2013 $144,400 $233,900 220 100
2014 $155,900 $238,000 241 89
2015 $141,600 $229,500 219 82
2016 $174,400 $237,100 267 63
2017 $177,200 $235,700 169 66
2018 $157,600 $203,000 99 90
2019 $167,400 $213,000 130 78
2020 $118,500 $199,900 101 167
2021 $137,300 $201,100 191 198

There were 191 building permits issued in Baltimore in 2012 (116 more than in 2011) compared to 198 building permits issued in Pittsburgh in 2012 (86 less than in 2011).

In Baltimore (Baltimore city), 87.4% voted for Democrats and 11.1% for Republicans in 2012 Presidential Election. In Pittsburgh (Allegheny County), 56.5% voted for Democrats and 42.0% for Republicans.

Elections
Type DemocratsRepublicansOther
Year BaltimorePittsburghBaltimorePittsburghBaltimorePittsburgh
2020 87.5% 59.4% 10.7% 39.0% 1.8% 1.5%
2016 84.8% 55.9% 10.5% 39.5% 4.6% 4.6%
2012 87.4% 56.5% 11.1% 42.0% 1.4% 1.5%
2008 87.6% 57.1% 11.7% 41.7% 0.6% 1.2%
2004 82.5% 57.2% 17.1% 42.2% 0.5% 0.6%
2000 82.9% 56.6% 14.2% 40.4% 2.9% 2.9%
1996 79.3% 52.8% 15.5% 37.9% 5.1% 9.3%
Breakdown of population affiliated with a religious congregation
Type AdherentsCongregations
Religion BaltimorePittsburghBaltimorePittsburgh
CATHOLIC CHURCH 11.0% 37.7% 8.2% 15.6%
EPISCOPAL CHURCH 1.6% 0.6% 4.0% 1.7%
AMERICAN BAPTIST CHURCHES IN THE USA 1.4% 1.4% 2.2% 3.7%
SOUTHERN BAPTIST CONVENTION 1.4% 0.2% 7.3% 2.8%
EVANGELICAL LUTHERAN CHURCH IN AMERICA 1.0% 2.0% 4.3% 6.7%
MUSLIM ESTIMATE 0.6% 0.5% 1.5% 0.9%
SEVENTH DAY ADVENTIST CHURCH 0.5% 0.2% 1.5% 0.5%
LUTHERAN CHURCH 0.4% 0.3% 1.8% 1.8%
SALVATION ARMY 0.0% 0.3% 0.0% 0.8%

Weather

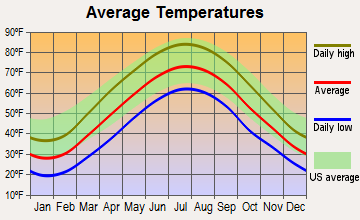
The weather varies in these cities with Baltimore experiencing a more mild and warmer climate due to its coastal location. Summers are humid and winters generally milder. Pittsburgh, further inland and in a different climate zone, has a somewhat harsher climate with relatively cooler winters and summers that are warm but less humid than in Baltimore.
Weather and climate
Type Baltimore Pittsburgh
Temperature - Average 54.5°F 51.3°F
Humidity - Average morning or afternoon humidity 70.4% 73.7%
Humidity - Differences between morning and afternoon humidity 36% 36%
Humidity - Maximum monthly morning or afternoon humidity 84% 86%
Humidity - Minimum monthly morning or afternoon humidity 48% 50%
Precipitation - Yearly average 42.9 in 38.6 in
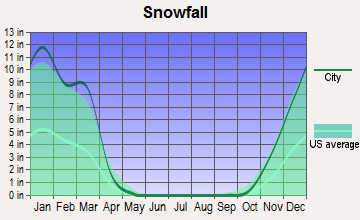
Snowfall - Yearly average 39.6 in 87.7 in
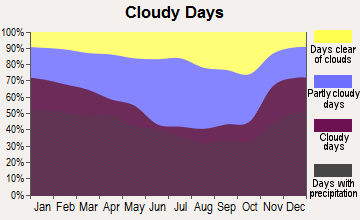
Clouds - Number of days clear of clouds 17.5% 9.8%
Sunshine amount - Average 60.3% 46%
Sunshine amount - Differences during a year 16% 31%
Sunshine amount - Maximum monthly 63% 54%
Sunshine amount - Minimum monthly 47% 23%
Wind speed - Average 7.9 mph 8.5 mph

Average climate in Baltimore, Maryland

Chicago, Illinois average temperatures Chicago, Illinois average precipitation Chicago, Illinois humidity Chicago, Illinois wind speed Chicago, Illinois snowfall Chicago, Illinois sunshine Chicago, Illinois clear and cloudy days
 

Average climate in Pittsburgh, Pennsylvania

Chicago, Illinois average temperatures Chicago, Illinois average precipitation Chicago, Illinois humidity Chicago, Illinois wind speed Chicago, Illinois snowfall Chicago, Illinois sunshine Chicago, Illinois clear and cloudy days
 

Air pollution
Type AQICONO2OZONEPBPM10PM25SO2
Year BaltimorePittsburghBaltimorePittsburghBaltimorePittsburghBaltimorePittsburghPittsburgh BaltimorePittsburghBaltimorePittsburghBaltimorePittsburgh
2018 89 105 0.23 0.26 11.8 5.7 28.3 24.7 N/A N/A N/A 15.1 7.9 11.8 0.1 0.6
2017 89 102 0.25 0.25 12.1 5.7 27.7 26.2 N/A N/A N/A 16.4 8.2 9.5 0.2 0.6
2016 102 100 0.26 0.27 13.0 6.5 28.3 25.9 0.002 N/A N/A 15.6 7.7 10.4 0.3 0.7
2015 89 110 0.28 0.26 12.4 7.5 28.3 24.8 0.007 N/A N/A 18.6 9.5 11.0 0.4 1.0
2014 82 107 0.25 0.30 11.8 9.3 25.7 23.1 0.042 N/A N/A 18.1 10.9 10.4 0.6 1.2
2013 86 99 0.22 0.27 10.7 10.8 25.6 25.1 0.164 N/A N/A 16.6 9.6 10.3 0.5 2.4
2012 98 120 0.24 0.33 11.3 13.0 25.0 25.4 N/A N/A N/A 19.5 11.2 10.3 0.5 2.5
2011 101 118 0.24 0.29 12.5 13.3 25.1 24.5 N/A N/A N/A 16.6 12.1 12.2 0.8 2.6
2010 110 151 0.24 0.37 13.1 13.6 26.9 24.5 N/A N/A N/A 20.2 12.2 12.1 1.0 5.0
2009 84 129 0.23 0.23 12.2 12.9 23.5 23.0 0.017 N/A N/A 18.5 10.4 14.9 1.4 4.0
2008 96 135 0.25 0.26 13.6 16.1 21.6 22.3 0.017 N/A N/A 20.6 12.8 16.7 1.8 4.8
2007 107 140 0.21 0.39 13.8 15.6 23.2 22.8 0.010 N/A N/A 21.7 14.0 19.0 2.5 5.9
2006 112 149 N/A 0.35 12.0 16.2 24.6 20.2 0.028 N/A N/A 19.3 14.7 16.1 N/A 6.6
2005 111 107 N/A 0.33 14.3 19.1 26.3 20.0 0.031 N/A 23.0 20.9 17.1 N/A N/A 7.4
2004 108 93 N/A 0.41 15.3 18.9 28.0 19.7 0.019 N/A 23.1 21.0 16.3 N/A N/A 6.6
2003 110 102 N/A 0.36 17.8 19.6 22.4 21.3 0.032 N/A N/A 21.3 13.9 N/A N/A 8.7
2002 119 111 N/A 0.32 17.4 20.1 19.4 21.7 0.017 N/A N/A 20.2 16.3 N/A 5.8 9.2
2001 104 107 N/A 0.60 18.2 21.2 23.9 21.1 0.017 N/A N/A 26.0 N/A N/A 6.0 8.5
2000 101 102 N/A 0.62 17.0 22.0 22.4 19.8 0.016 N/A N/A 22.8 N/A N/A 6.3 9.1
Natural disasters
Type Baltimore Pittsburgh
Tornado activity compared to U.S. average 117.8% 80.2%
Earthquake activity compared to U.S. average 40.6% 44.6%
Natural disasters compared to U.S. average 0% 15%

Transportation

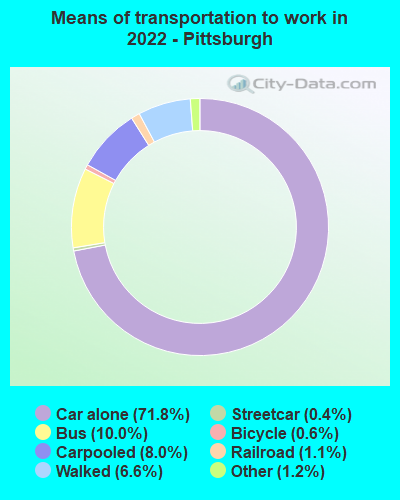
Both cities provide a range of public transportation services. Baltimore has buses, trams, and a metro system, while Pittsburgh offers buses, a light rail system, and the unique Inclines - funiculars that scale the city's steep hills.
Transport
Type Baltimore Pittsburgh
Amtrak stations 2 1
Amtrak stations nearby 2 1
FAA registered aircraft 136 233
FAA registered aircraft manufacturers and dealers 2 3
Means of transportation to work
Type Baltimore Pittsburgh
Bicycle 0.4% 0.8%
Bus 6.2% 9.3%
Carpooled 7.3% 7.4%
Car alone 77.2% 74%
Railroad 0.3% 0.7%
Streetcar 1.2% 0.6%
Subway 0.2% 0.1%
Taxicab 0.7% 0.1%
Walked 4.5% 4.8%
Means of transportation to work
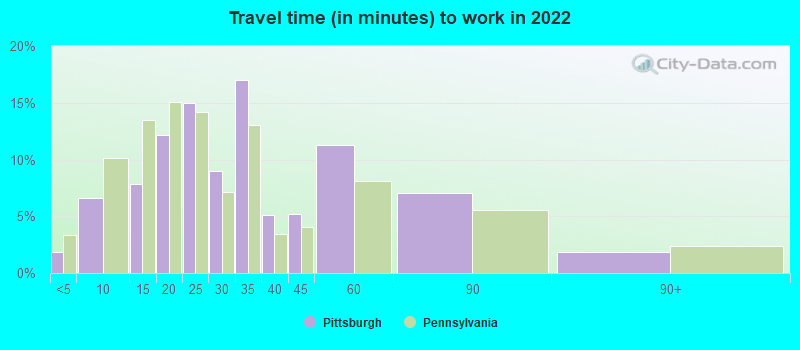
Average travel time to work
Type Baltimore Pittsburgh
Average 32.3 min 31 min
Other means 26.3 min 21.6 min
Public transportation 46.8 min 33.4 min
Travel time to work
Time leaving to work
Travel time to work
Time leaving to work
Private vehicle occupancy
Type Baltimore Pittsburgh
Average 1.1 1.1
Drove alone 90.7% 90.3%
In 2 person carpool 7.5% 8%
In 3 person carpool 1% 0.8%
In 4 person carpool 0.4% 0.5%
In 5-6 person carpool 0.3% 0%
In 7+ person carpool 0.2% 0.3%

How many people usually rode to work in the car, truck or van.

Real Estate

Baltimore grants a robust real-estate market with options ranging from high-end luxury condos to more affordable historic rowhouses. Pittsburgh's real-estate market is also vibrant, offering a wide variety of housing options ranging from metropolitan condos to suburban homes.

Neighborhoods

Baltimore boasts a range of neighborhoods each with unique charm. Fells Point is loved for its waterfront and historic cobblestone streets, while Hampden has a quirky, artsy vibe. Pittsburgh showcases neighborhoods like Shadyside with its lively cafes and boutiques and the Strip District known for its thriving markets and nightlife.
Houses and residents
Type Baltimore Pittsburgh
Houses 293,487 159,435
Average household size (people) 2.4 2.1
Median year apartment built 1959 1954
Length of stay in the house since moving in 15.7 years 16.4 years
Houses occupied 254,370 (86.7%) 136,747 (85.8%)
Houses occupied by owners 123,249 (48.5%) 66,729 (48.8%)
Houses occupied by renters 131,121 (51.5%) 70,018 (51.2%)
Median rent asked for vacant for-rent units $1,254 $1,381
Median monthly housing costs $1,196 $985
Median price asked for vacant for-sale houses and condos $207,303 $325,759
Estimated median house or condo value $193,100 $181,100
Median numbers of rooms 5.6 5.2
Median number of rooms in apartments 4.2 4
Median number of rooms in houses and condos 6.5 6.3
Median house price - detached houses $321,473 $256,260
Median house price - in 2-unit structures $218,934 $174,463
Median house price - in 3-to-4-unit structures $142,945 $299,629
Median house price - in 5 or more unit structures $257,173 $310,273
Median house price - mobile homes $269,877 $187,764
Median house price - Townhouses or other attached units $210,096 $258,331
Median house price - All housing units $246,241 $257,793
Median house age 72 80
Renting percentage 52.3% 52.4%
Housing density (houses/condos per square mile) 3,632.1 2,868.3
House value disparities 38.5% 43.1%
Household income disparities 49.4% 49.5%
Median household income for houses/condes with a mortgage $85,990 $97,230
Median household income for apartments without a mortgage $53,334 $58,579
Housing units without a mortgage 2,415 (2.8%) 2,260 (5.6%)
Housing units with both a second mortgage and home equity loan 5,740 (6.6%) 4,417 (11%)
Housing units with a mortgage 84,578 (97.2%) 37,784 (94.4%)
Housing units with a home equity loan 579 (0.7%) 297 (0.7%)
Housing units with a second mortgage 8,544 (9.8%) 4,975 (12.4%)
House/condo owner moved in on average (years ago) 14 15
House/condo renter moved in on average (years ago) 3 1
Housing units lacking complete kitchen facilities 6% 3%
Housing units lacking complete plumbing facilities 5.1% 2.8%
Housing units in structures
Housing units in structures BaltimorePittsburgh
One, detached 16.4% 43.7%
One, attached 49.5% 15.6%
Two 4.5% 8.9%
3 or 4 4.9% 6.2%
5 to 9 5.5% 4.8%
10 to 19 4.8% 4.3%
20 to 49 2.8% 4.3%
50 or more 11.4% 11.5%
Mobile homes 0.2% 0.6%
Boats, RVs, vans, etc. 0.1% 0.0%
Median real estate property taxes paid for housing units
Type Baltimore Pittsburgh
With mortgages $3,131 (1.5%) $2,022 (1%)
With no mortgages $2,368 (1.5%) $1,487 (1%)
Marital status
Type Baltimore Pittsburgh
Divorced 10% 9%
Never married 50.3% 52.6%
Now married 30.9% 32.1%
Separated 3.1% 1.6%
Widowed 5.8% 4.7%
Class of workers - percentage
Class of Workers BaltimorePittsburgh
Employee of private company 58.2% 61.2%
Private not-for-profit wage and salary workers 14.1% 21.6%
State government workers 7.6% 3.5%
Local government workers 7.2% 5.6%
Federal government workers 5.9% 2.3%
Self-employed workers in own not incorporated business 4.7% 3.9%
Self-employed in own incorporated business 2.2% 1.9%
Unpaid family workers 0.1% 0.0%
Class of workers - absolute values
Class of Workers BaltimorePittsburgh
Employee of private company 157,320 93,994
Federal government workers 15,922 3,467
Local government workers 19,521 8,567
Private not-for-profit wage and salary workers 37,988 33,170
Self-employed in own incorporated business 6,054 2,912
Self-employed workers in own not incorporated business 12,671 5,977
State government workers 20,410 5,427
Unpaid family workers 356 73

Industries and Occupations

Key industries in Baltimore include bio-science, technology, healthcare, and defense. Pittsburgh's economy is diversified with major industries including healthcare, education, technology, robotics, and finance.
Most common male industries
Industry BaltimorePittsburgh
Professional, scientific, and technical services 12.3% 11.7%
Educational services 11.0% 13.2%
Health care and social assistance 10.1% 10.7%
Construction 8.8% 7.7%
Transportation and warehousing 8.6% 3.6%
Public administration 7.7% 3.5%
Retail trade 7.3% 9.4%
Manufacturing 6.3% 9.0%
Administrative and support and waste management services 5.1% 3.9%
Accommodation and food services 5.0% 6.0%
Other services, except public administration 4.4% 3.8%
Finance and insurance 3.3% 7.3%
Real estate and rental and leasing 3.0% 1.8%
Information 2.5% 2.3%
Wholesale trade 2.3% 2.7%
Arts, entertainment, and recreation 1.1% 2.0%
Utilities 0.9% 1.0%
Agriculture, forestry, fishing and hunting 0.3% 0.1%
Mining, quarrying, and oil and gas extraction 0.0% 0.2%
Most common female industries
Industry BaltimorePittsburgh
Health care and social assistance 24.9% 24.6%
Educational services 19.2% 19.5%
Retail trade 9.6% 9.3%
Public administration 9.1% 3.1%
Professional, scientific, and technical services 8.2% 9.7%
Accommodation and food services 4.6% 6.1%
Other services, except public administration 4.3% 6.7%
Manufacturing 4.1% 3.1%
Transportation and warehousing 3.7% 1.8%
Administrative and support and waste management services 3.2% 2.5%
Finance and insurance 2.7% 5.6%
Real estate and rental and leasing 1.5% 1.3%
Arts, entertainment, and recreation 1.4% 2.5%
Information 1.2% 1.7%
Construction 0.9% 0.8%
Wholesale trade 0.8% 1.0%
Agriculture, forestry, fishing and hunting 0.5% 0.2%
Utilities 0.1% 0.4%
Most common male occupations
Occupation BaltimorePittsburgh
Management occupations 9.7% 12.2%
Transportation occupations 7.5% 3.7%
Business and financial operations occupations 7.5% 8.9%
Office and administrative support occupations 7.4% 4.9%
Computer and mathematical occupations 7.0% 9.8%
Material moving occupations 6.1% 4.0%
Building and grounds cleaning and maintenance occupations 5.6% 3.2%
Educational instruction, and library occupations 5.6% 7.4%
Construction and extraction occupations 5.4% 6.8%
Sales and related occupations 4.9% 5.8%
Health diagnosing and treating practitioners and other technical occupations 3.7% 3.6%
Installation, maintenance, and repair occupations 3.6% 1.9%
Food preparation and serving related occupations 3.5% 5.3%
Production occupations 3.4% 4.4%
Life, physical, and social science occupations 3.0% 2.4%
Arts, design, entertainment, sports, and media occupations 2.9% 2.4%
Architecture and engineering occupations 2.7% 3.1%
Firefighting and prevention, and other protective service workers including supervisors 2.3% 2.0%
Community and social service occupations 2.2% 1.8%
Legal occupations 1.9% 1.8%
Most common female occupations
Occupation BaltimorePittsburgh
Office and administrative support occupations 12.3% 13.5%
Educational instruction, and library occupations 11.1% 10.6%
Management occupations 9.8% 8.9%
Sales and related occupations 8.0% 9.7%
Healthcare support occupations 7.1% 5.7%
Health diagnosing and treating practitioners and other technical occupations 7.1% 8.6%
Business and financial operations occupations 6.9% 7.6%
Food preparation and serving related occupations 3.7% 5.6%
Building and grounds cleaning and maintenance occupations 3.7% 1.2%
Personal care and service occupations 3.6% 3.4%
Community and social service occupations 3.3% 3.2%
Production occupations 2.9% 1.7%
Health technologists and technicians 2.8% 2.2%
Life, physical, and social science occupations 2.7% 2.9%
Computer and mathematical occupations 2.5% 3.7%
Material moving occupations 2.5% 1.8%
Arts, design, entertainment, sports, and media occupations 2.2% 2.3%
Legal occupations 2.0% 3.1%
Transportation occupations 2.0% 0.7%
Firefighting and prevention, and other protective service workers including supervisors 1.6% 1.4%
Food environment data per 10,000 residents
Food environment statistics BaltimorePittsburgh
Number of convenience stores (no gas) 1.5 2.4
Number of convenience stores (with gas) 1.6 1.1
Number of full-service restaurants 5.2 8.2
Number of grocery stores 3.1 1.7
Food environment - absolute values
Food environment statistics BaltimorePittsburgh
Number of convenience stores (no gas) 97 297
Number of convenience stores (with gas) 100 133
Number of full-service restaurants 330 993
Number of grocery stores 197 209
Number of supercenters and club stores 0 11
Obesity and diabetes
Food environment statistics rate BaltimorePittsburgh
Adult diabetes rate 12.1% 8.7%
Adult obesity rate 32.1% 26.3%
Low-income preschool obesity rate 12.3% 12.9%

Health Care

Baltimore hosts some of the leading hospitals in the nation such as the Johns Hopkins Hospital and University of Maryland Medical Center. Pittsburgh is also well recognized in the healthcare sector, primarily due to the presence of the University of Pittsburgh Medical Center.
Health (county statistics)
Type Baltimore Pittsburgh
General health status score of residents in this county from 1 (poor) to 5 (excellent) 3.5 3.5
Average weight of females (lbs) 165.6 lbs 162.3 lbs
Average weight of males (lbs) 197.7 lbs 201.2 lbs
Residents visited a dentist within the past year 72.1% 69%
Residents exercised in the past month 73.7% 74.1%
Adult residents drank alcohol in the past 30 days 56.5% 58.2%
Residents smoked 100+ cigarettes in their lives 41.4% 43.8%

Fatal vehicle accidents per 100,000 residents
Type Total count per 100,000Drunk per 100,000Fatal count per 100,000Pedestrian count per 100,000Person count per 100,000Vehicle count per 100,000
Year BaltimorePittsburghBaltimorePittsburghBaltimorePittsburghBaltimorePittsburghBaltimorePittsburghBaltimorePittsburgh
2021 8.2 7.0 0.0 0.0 8.3 7.3 4.3 1.7 16.1 15.6 12.3 12.0
2020 9.8 6.9 2.4 1.0 10.6 7.6 3.1 1.3 23.8 11.2 17.3 9.6
2019 6.9 7.7 1.9 2.3 7.4 8.0 3.9 3.0 16.5 17.0 10.3 13.0
2018 5.5 5.0 0.7 1.3 5.6 5.0 1.8 1.7 13.8 10.0 9.0 8.0
2017 6.1 5.0 1.0 1.3 6.2 5.3 2.8 2.0 12.6 10.3 10.3 7.3
2016 7.5 6.6 1.5 2.0 8.6 7.2 3.2 3.3 19.5 16.1 14.1 11.2
2015 6.3 5.6 1.8 1.6 6.7 6.6 2.9 2.6 15.6 10.5 10.4 7.2
2014 4.7 3.9 0.5 1.3 4.8 3.9 2.7 1.6 11.1 7.2 7.1 4.9
2013 4.3 6.9 1.0 2.9 5.0 7.2 2.4 1.6 6.6 12.8 6.3 9.5
2012 4.3 4.6 0.8 1.6 4.5 4.6 1.8 1.3 9.7 10.1 6.9 8.8
2011 3.7 3.3 1.6 0.7 4.0 3.3 1.9 0.7 8.7 9.1 6.5 4.6
2010 6.0 7.5 2.6 3.9 6.3 8.8 2.1 2.6 16.1 18.3 8.7 10.8
2009 5.8 5.5 1.9 1.3 6.0 5.5 3.0 1.6 16.2 12.5 9.3 7.7
2008 7.2 5.1 2.0 1.0 7.5 5.1 1.9 2.9 17.1 9.6 10.2 6.1
2007 6.6 7.0 2.3 3.8 7.3 7.0 3.0 2.6 16.7 16.0 10.3 11.8
2006 6.6 7.7 2.8 3.2 7.0 8.6 3.3 1.6 17.0 23.0 9.8 14.0
2005 5.2 8.2 1.1 3.8 5.3 8.5 2.2 1.6 14.4 20.6 8.4 12.0
2004 6.1 7.5 2.5 4.4 6.9 8.7 2.2 2.8 19.5 15.3 9.5 9.1
2003 5.3 8.9 1.1 1.5 5.8 9.5 2.5 4.0 14.9 25.5 8.1 13.2
2002 6.1 7.9 1.7 4.6 6.5 8.6 2.0 0.9 15.9 19.5 7.9 12.2
2001 0.8 7.0 0.0 2.7 0.8 7.9 0.2 2.1 2.8 15.4 2.5 9.7
2000 1.2 7.2 0.8 4.2 1.7 8.7 0.2 1.5 5.7 14.6 2.9 9.6
1999 7.0 5.6 2.1 2.4 7.1 5.6 3.5 1.2 19.1 13.1 9.5 8.3
1998 6.7 7.0 1.1 2.1 6.7 7.9 4.6 1.8 20.0 20.5 10.7 9.7
1997 7.1 6.7 1.8 3.8 7.5 8.1 2.7 1.7 22.4 16.8 11.6 8.4
1996 7.1 4.6 1.0 1.4 7.6 4.9 3.6 2.6 18.5 13.5 9.2 7.4
1995 6.8 6.2 1.7 4.8 7.4 8.2 2.8 1.7 19.6 18.7 10.5 11.0
1994 9.1 5.6 1.4 2.8 9.6 7.0 4.7 1.7 23.2 18.1 13.3 9.2
1993 8.7 6.6 0.8 2.2 9.2 7.2 3.1 1.4 21.6 19.3 12.3 11.3
1992 7.0 4.9 1.4 3.6 7.6 5.7 2.5 1.1 17.5 14.2 9.4 6.8
1991 8.5 6.0 0.8 2.5 8.7 6.8 4.9 2.2 21.9 13.9 10.7 7.4
1990 6.5 7.8 0.8 3.0 6.7 8.4 0.0 0.0 16.7 18.1 8.4 11.1
1989 7.8 7.7 1.8 2.4 8.1 8.3 0.0 0.0 21.2 19.2 10.8 11.5
1988 8.0 8.9 2.1 2.6 8.4 8.9 0.0 0.0 23.2 23.6 12.1 12.6
1987 10.1 6.0 3.5 1.6 10.5 6.5 0.0 0.0 26.5 14.2 14.1 8.0
1986 8.2 8.9 2.0 2.3 8.6 10.2 0.0 0.0 21.8 22.7 11.1 11.7
1985 8.8 7.8 3.2 2.3 9.5 8.3 0.0 0.0 18.7 18.9 12.2 10.8
1984 8.2 8.5 2.0 1.5 8.4 8.9 0.0 0.0 19.8 18.9 11.7 11.9
1983 7.0 8.8 4.1 2.2 7.5 9.3 0.0 0.0 17.9 20.6 9.1 13.2
1982 8.0 7.5 3.7 1.7 8.1 8.2 0.0 0.0 20.0 18.6 11.6 10.2
1981 7.8 11.0 2.4 7.2 8.2 11.7 0.0 0.0 18.9 35.1 10.6 16.0
1980 8.1 11.1 2.8 6.4 8.4 12.0 0.0 0.0 17.2 24.8 10.2 13.2
1979 7.3 12.0 1.9 5.5 7.9 12.2 0.0 0.0 16.5 27.9 9.0 15.2
1978 8.4 11.3 1.6 4.7 8.5 11.7 0.0 0.0 19.7 29.3 10.6 15.1
1977 7.9 10.6 0.6 3.1 7.9 12.4 0.0 0.0 18.4 24.1 9.5 13.7
1976 7.6 11.0 1.1 3.0 8.0 11.5 0.0 0.0 17.6 26.0 10.7 16.4
1975 7.4 10.8 1.1 3.0 7.9 11.2 0.0 0.0 17.4 25.4 10.5 16.1

Fatal vehicle accidents
Type Total countDrunkFatal countPedestrian countPerson countVehicle count
Year BaltimorePittsburghBaltimorePittsburghBaltimorePittsburghBaltimorePittsburghBaltimorePittsburghBaltimorePittsburgh
1975 63 51 9 14 67 53 0 0 147 120 89 76
1976 63 51 9 14 67 53 0 0 147 120 89 76
1977 65 48 5 14 65 56 0 0 151 109 78 62
1978 68 50 13 21 69 52 0 0 160 130 86 67
1979 58 52 15 24 63 53 0 0 132 121 72 66
1980 64 47 22 27 66 51 0 0 135 105 80 56
1981 61 46 19 30 64 49 0 0 148 147 83 67
1982 62 31 29 7 63 34 0 0 155 77 90 42
1983 54 36 32 9 58 38 0 0 138 84 70 54
1984 63 34 15 6 64 36 0 0 152 76 90 48
1985 67 31 24 9 72 33 0 0 142 75 93 43
1986 62 35 15 9 65 40 0 0 165 89 84 46
1987 76 23 26 6 79 25 0 0 199 55 106 31
1988 60 34 16 10 63 34 0 0 173 90 90 48
1989 58 29 13 9 60 31 0 0 157 72 80 43
1990 48 29 6 11 49 31 0 0 123 67 62 41
1991 62 22 6 9 64 25 36 8 160 51 78 27
1992 51 18 10 13 55 21 18 4 127 52 68 25
1993 62 24 6 8 66 26 22 5 154 70 88 41
1994 64 20 10 10 67 25 33 6 163 65 93 33
1995 47 22 12 17 51 29 19 6 135 66 72 39
1996 48 16 7 5 51 17 24 9 124 47 62 26
1997 47 23 12 13 49 28 18 6 147 58 76 29
1998 43 24 7 7 43 27 30 6 129 70 69 33
1999 44 19 13 8 45 19 22 4 121 44 60 28
2000 8 24 5 14 11 29 1 5 37 49 19 32
2001 5 23 0 9 5 26 1 7 18 51 16 32
2002 39 26 11 15 42 28 13 3 102 64 51 40
2003 34 29 7 5 37 31 16 13 96 83 52 43
2004 39 24 16 14 44 28 14 9 125 49 61 29
2005 33 26 7 12 34 27 14 5 92 65 54 38
2006 42 24 18 10 45 27 21 5 109 72 63 44
2007 42 22 15 12 47 22 19 8 107 50 66 37
2008 46 16 13 3 48 16 12 9 109 30 65 19
2009 37 17 12 4 38 17 19 5 103 39 59 24
2010 37 23 16 12 39 27 13 8 100 56 54 33
2011 23 10 10 2 25 10 12 2 54 28 40 14
2012 27 14 5 5 28 14 11 4 60 31 43 27
2013 27 21 6 9 31 22 15 5 41 39 39 29
2014 29 12 3 4 30 12 17 5 69 22 44 15
2015 39 17 11 5 42 20 18 8 97 32 65 22
2016 46 20 9 6 53 22 20 10 120 49 87 34
2017 37 15 6 4 38 16 17 6 77 31 63 22
2018 33 15 4 4 34 15 11 5 83 30 54 24
2019 41 23 11 7 44 24 23 9 98 51 61 39
2020 57 21 14 3 62 23 18 4 139 34 101 29
2021 47 21 0 0 48 22 25 5 93 47 71 36
Police full-time law enforcement employees
Year BaltimorePittsburgh
2021 2,843 941
2020 2,940 1,036
2019 2,940 1,064
2018 2,935 999
2017 2,937 903
2016 2,908 976
2015 2,960 948
2014 3,156 975
2013 3,220 923
2012 3,342 947
2011 3,470 943
2010 3,503 954
2009 3,586 976
2008 3,678 912
2007 3,684 912
2006 3,712 910
2005 3,663 943
2004 3,676 959
2003 3,789 981
Police full-time law enforcement employees (per 1,000 residents)
Year BaltimorePittsburgh
2021 4.8 3.0
2020 5.0 3.5
2019 4.9 3.5
2018 4.8 3.3
2017 4.8 3.0
2016 4.7 3.2
2015 4.8 3.1
2014 5.1 3.2
2013 5.2 3.0
2012 5.3 3.0
2011 5.5 3.1
2010 5.6 3.1
2009 5.6 3.1
2008 5.8 2.9
2007 5.9 2.9
2006 5.8 2.8
2005 5.7 2.9
2004 5.8 2.9
2003 5.9 2.9
Local government: full-time employees
Job BaltimorePittsburgh
Elementary and secondary - instruction 10,299 0
Financial administration 484 168
Firefighters 1,548 664
Fire - other 203 19
Health 741 213
Judicial and legal 635 29
Local libraries 417 0
Other and unallocable 504 83
Other government administration 544 177
Parks and recreation 812 69
Police - other 528 112
Police protection - officers 2,661 938
Sewerage 421 0
Solid waste management 444 176
Streets and highways 997 479
Totals for government 24,627 3,258
Water supply 1,484 0
Welfare 133 17
Local government: part-time employees
Job BaltimorePittsburgh
Elementary and secondary - instruction 1,768 0
Health 5 0
Judicial and legal 8 9
Local libraries 88 0
Other and unallocable 51 2
Other government administration 68 20
Parks and recreation 123 67
Police - other 236 81
Solid waste management 1 0
Streets and highways 0 33
Totals for government 2,567 227
Place of birth - Foreign born
Residents BaltimorePittsburgh
All residents 8.0% 8.6%
American Indian / Alaska Native residents 30.0% 7.3%
Asian residents 66.6% 73.7%
Black or African American residents 5.3% 4.7%
Native Hawaiian / Pacific Islander residents 8.6% 48.7%
Other race residents 42.4% 35.0%
Two or more races residents 10.1% 8.9%
White residents 4.3% 4.2%
White alone, not Hispanic / Latino residents 5.7% 4.1%
Place of birth - Native, outside of US
Residents BaltimorePittsburgh
All residents 1.0% 1.6%
American Indian / Alaska Native residents 2.7% 0.0%
Asian residents 1.4% 2.9%
Black or African American residents 0.5% 2.5%
Native Hawaiian / Pacific Islander residents 2.8% 0.0%
Other race residents 4.7% 6.9%
Two or more races residents 4.7% 3.6%
White residents 1.4% 0.8%
White alone, not Hispanic / Latino residents 1.2% 0.7%
Place of birth - Born in state of residence
Residents BaltimorePittsburgh
All residents 65.8% 65.3%
American Indian / Alaska Native residents 43.9% 50.8%
Asian residents 11.0% 9.8%
Black or African American residents 76.8% 70.9%
Native Hawaiian / Pacific Islander residents 5.3% 42.4%
Other race residents 40.9% 32.5%
Two or more races residents 54.2% 62.4%
White residents 51.6% 68.9%
White alone, not Hispanic / Latino residents 50.7% 71.5%
Place of birth - Born in other state
Residents BaltimorePittsburgh
All residents 25.2% 24.5%
American Indian / Alaska Native residents 23.4% 41.9%
Asian residents 21.0% 13.6%
Black or African American residents 17.5% 22.0%
Native Hawaiian / Pacific Islander residents 83.2% 8.9%
Other race residents 11.9% 25.6%
Two or more races residents 31.0% 25.1%
White residents 42.7% 26.1%
White alone, not Hispanic / Latino residents 42.4% 23.8%
English speakers (speaking English at home)
Type Baltimore Pittsburgh
Born in the United States residents 93.3% 92.7%
Foreign born residents 30.1% 22.8%
Native, born elsewhere residents 59.1% 71.2%
Total residents 89.7% 88.8%
Mechanisms of homicide
Mechanism BaltimorePittsburgh
Homicides from 2000 to 2006 1,681 616
Cut / Pierce 159 53
Firearm 1,273 462
Struck by / against 54 0
Suffocation 39 0
Mechanisms of homicide per 1,000,000 residents
Mechanism BaltimorePittsburgh
Homicides from 2000 to 2006 373.3 70.2
Cut / Pierce 35.3 6.0
Firearm 282.7 52.6
Struck by / against 12.0 0
Suffocation 8.7 0
Mechanisms of suicide per 1,000,000 residents
Mechanism BaltimorePittsburgh
Suicides from 2000 to 2006 80.8 116.4
Drowning 0 3.0
Fall 0 4.6
Firearm 32.9 55.1
Poisoning 10.9 18.3
Suffocation 26.2 31.4

Infrastructure

Baltimore is rich in historic architecture and boasts an extensive sea port, making it a hub for commerce. Pittsburgh also has a strong historic architectural presence, but shines in its impressive bridge infrastructure, with over 400 bridges spanning its many rivers and valleys.
Infrastructure
Type Baltimore Pittsburgh
Hospitals 45 41
TV stations 19 22
Arenas or stadiums 3 3
Bank branches located here 215 250
Bank institutions located here 44 27
Main business address for public companies 27 37
Drinking water stations with no reported violations in the past 13 1
Drinking water stations with reported violations in the past 18 10

Schools

School facilities
Type Baltimore Pittsburgh
Private elementary/middle schools 54 36
Private high schools 48 25
Public elementary/middle schools 233 115
Public high schools 70 32
Colleges/Universities 25 37
HMDA - Conventional home purchase loans - Applications denied
Year BaltimorePittsburgh
1999 2,486 576
2000 2,058 539
2001 1,371 443
2002 1,111 378
2003 1,526 523
2004 2,929 614
2005 4,981 761
2006 5,533 807
2007 3,592 671
2008 1,111 347
2009 381 210

Culture and Food

Baltimore is known for its seafood, particularly the Chesapeake Bay blue crab, and its distinct neighborhood festivals. Pittsburgh's cultural scene is vibrant and varied with influences from the city's immigrant past. It's known for unique food creations, such as the Primanti Brothers' sandwich and the Pirogie.

Sports Teams

Both cities have a rich sports culture. Baltimore is home to the NFL's Ravens and MLB's Orioles. In regard to professional sports, Pittsburgh is not far behind with the NFL's Steelers, NHL's Penguins, and the MLB's Pirates.