Baltimore, MD vs Ramapo, NY - Advanced U.S. city comparison tool

Baltimore, MD vs Ramapo, NY

Baltimore, Maryland and Ramapo, New York are diverse and vibrant places to live and visit, each offering its unique charm. Baltimore is a larger city teeming with rich history, robust industries, and a renowned waterfront while Ramapo offers a more calming suburban living with high-quality education and a close community feeling. In comparing these two cities, multiple factors including crime/safety, weather, cost of living, education, work and economy, and more will be discussed.

Discuss "Baltimore" vs "Ramapo" on our local forum with over 2,400,000 registered users
 
 
Distance between Baltimore, MD and Ramapo, NY : 183.2 miles

Baltimore's population is larger by 355%. Its population has decreased by 74,656 people (11.5%) since 2000. The population of Ramapo has grown by 17,690 people (16.2%) during that time.

Population
Type Baltimore Ramapo
Population 576,498 126,595
Female / male percentage 53.1% / 46.9%
53.1%
46.9%
50% / 50%
50%
50%
Racial makeup - percentage
Ethnicity BaltimoreRamapo
Black 59.3% 15.1%
White Non-Hispanic 26.8% 65.6%
Hispanic 6.0% 13.6%
Two or more 4.6% 1.2%
Asian 2.5% 4.0%
American Indian 0.1% 0.2%
Racial makeup - absolute values
Ethnicity BaltimoreRamapo
Black 342,151 19,173
White Non-Hispanic 154,743 83,094
Hispanic 34,810 17,223
Two or more 26,513 1,569
Asian 14,262 5,013
American Indian 468 253
Pacific Islander 316 18

Crime and Safety

Baltimore has historically had higher crime rates than many places in the United States, particularly in the aspect of violent crime. However, the situation is improving with more focus on community policing. Overall, crime in Baltimore varies widely from neighborhood to neighborhood. On the other hand, Ramapo, a smaller and suburban area within Rockland County, experiences much lower crime rates, providing a considerably safer environment for both residents and tourists. It's important for people to stay informed and aware of their surroundings in any city.


Crime by year per 100,000 residents
Type City-data.com crime indexRobberies per 100,000Murders per 100,000Rapes per 100,000Assaults per 100,000Burglaries per 100,000Theft per 100,000Auto theft per 100,000Arson per 100,000
Year BaltimoreRamapoBaltimoreRamapoBaltimoreRamapoBaltimoreRamapoBaltimoreRamapoBaltimoreRamapoBaltimoreRamapoBaltimoreRamapoBaltimoreRamapo
2020 N/A 52.2 0.0 6.3 0.0 0.0 0.0 22.1 0.0 48.3 0.0 53.6 0.0 420.3 0.0 30.5 0.0 5.3
2019 N/A 47.4 0.0 5.3 0.0 1.1 0.0 16.9 0.0 48.6 0.0 38.0 0.0 401.6 0.0 21.1 0.0 4.2
2018 N/A 52.0 0.0 15.8 0.0 0.0 0.0 16.8 0.0 46.3 0.0 35.8 0.0 508.1 0.0 22.1 0.0 1.1
2017 909.2 49.1 958.7 10.6 55.8 0.0 62.3 9.6 950.2 26.6 1,311.3 71.3 2,773.6 632.9 843.3 33.0 42.6 13.8
2016 823.6 58.9 846.7 10.8 51.4 1.1 48.4 11.9 833.9 59.4 1,192.6 68.0 2,725.6 610.0 859.8 36.7 41.9 0.0
2015 776.3 60.4 694.2 8.8 55.4 1.1 46.2 15.4 740.1 61.8 1,248.6 71.7 2,842.3 578.9 889.5 33.1 41.9 1.1
2014 662.0 54.1 589.7 20.3 33.8 0.0 39.3 7.9 675.7 45.0 1,110.8 100.1 2,888.2 603.1 719.5 20.3 34.2 2.3
2013 698.3 51.3 599.7 10.3 37.4 2.3 47.9 5.7 716.3 47.0 1,187.0 100.9 3,042.7 534.4 715.0 14.9 44.5 1.1
2012 680.4 62.8 576.4 15.2 34.5 0.0 50.7 5.9 743.6 72.6 1,242.3 160.3 2,781.4 658.9 636.6 18.7 38.7 2.3
2011 686.2 78.2 551.5 28.4 31.4 0.0 54.4 3.6 780.3 98.3 1,374.3 140.9 2,713.6 876.5 669.9 28.4 49.0 3.6
2010 691.2 64.7 537.2 19.0 35.9 1.2 42.7 2.4 884.4 72.6 1,219.6 111.8 2,624.6 770.9 710.0 19.0 51.7 0.0
2009 690.7 64.0 580.3 17.0 37.3 1.3 24.7 5.2 870.6 58.7 1,220.8 122.7 2,620.9 707.5 723.9 43.1 54.3 6.5
2008 724.9 74.9 634.5 25.2 36.9 1.3 21.6 8.0 895.6 68.9 1,234.3 160.4 2,715.3 759.6 868.0 37.1 67.8 0.0
2007 748.6 57.0 624.0 17.0 45.2 0.0 23.4 1.3 938.6 65.5 1,182.4 128.3 2,682.0 658.6 931.7 30.1 65.2 1.3
2006 774.4 76.3 663.3 26.8 43.3 1.3 21.6 5.4 968.2 80.3 1,193.3 152.5 2,894.0 749.2 982.2 57.5 67.1 1.3
2005 665.6 60.3 609.9 14.8 42.0 0.0 25.3 2.7 1,077.4 67.2 1,144.6 168.0 3,071.5 723.2 969.0 30.9 65.8 1.3
2004 709.6 71.5 638.5 28.5 43.5 1.4 28.7 4.1 1,128.7 50.2 1,258.3 177.6 3,368.5 851.3 1,058.2 48.8 67.8 12.2
2003 697.1 81.1 673.2 34.3 41.9 1.4 31.7 8.2 988.3 82.2 1,208.4 222.0 3,541.1 770.1 1,063.8 32.9 75.2 16.4

City-data.com crime index counts serious crimes and violent crime more heavily. It adjusts for the number of visitors and daily workers commuting into cities. (higher means more crime, U.S. average = 301.1)


Crime per year
Type City-data.com crime indexRobberiesMurdersRapesAssaultsBurglariesTheftAuto theftArson
Year BaltimoreRamapoBaltimoreRamapoBaltimoreRamapoBaltimoreRamapoBaltimoreRamapoBaltimoreRamapoBaltimoreRamapoBaltimoreRamapoBaltimoreRamapo
2019 N/A 47.4 0 5 0 1 0 16 0 46 0 36 0 380 0 20 0 4
2018 N/A 52.0 0 15 0 0 0 16 0 44 0 34 0 483 0 21 0 1
2017 909.2 49.1 5,879 10 342 0 382 9 5,827 25 8,041 67 17,008 595 5,171 31 261 13
2016 823.6 58.9 5,236 10 318 1 299 11 5,157 55 7,375 63 16,855 565 5,317 34 259 0
2015 776.3 60.4 4,313 8 344 1 287 14 4,598 56 7,757 65 17,658 525 5,526 30 260 1
2014 662.0 54.1 3,677 18 211 0 245 7 4,213 40 6,926 89 18,008 536 4,486 18 213 2
2013 698.3 51.3 3,734 9 233 2 298 5 4,460 41 7,391 88 18,946 466 4,452 13 277 1
2012 680.4 62.8 3,605 13 216 0 317 5 4,651 62 7,770 137 17,397 563 3,982 16 242 2
2011 686.2 78.2 3,457 24 197 0 341 3 4,891 83 8,615 119 17,010 740 4,199 24 307 3
2010 691.2 64.7 3,336 16 223 1 265 2 5,492 61 7,573 94 16,298 648 4,409 16 321 0
2009 690.7 64.0 3,707 13 238 1 158 4 5,561 45 7,798 94 16,741 542 4,624 33 347 5
2008 724.9 74.9 4,026 19 234 1 137 6 5,683 52 7,832 121 17,230 573 5,508 28 430 0
2007 748.6 57.0 3,895 13 282 0 146 1 5,859 50 7,381 98 16,742 503 5,816 23 407 1
2006 774.4 76.3 4,229 20 276 1 138 4 6,173 60 7,608 114 18,451 560 6,262 43 428 1
2005 665.6 60.3 3,910 11 269 0 162 2 6,907 50 7,338 125 19,691 538 6,212 23 422 1
2004 709.6 71.5 4,050 21 276 1 182 3 7,159 37 7,981 131 21,366 628 6,712 36 430 9
2003 697.1 81.1 4,339 25 270 1 204 6 6,370 60 7,789 162 22,824 562 6,857 24 485 12

City-data.com crime index counts serious crimes and violent crime more heavily. It adjusts for the number of visitors and daily workers commuting into cities. (higher means more crime, U.S. average = 301.1)

Cost of Living

The cost of living in Baltimore is generally less expensive than in Ramapo. Housing, groceries, health services, and utilities are relatively cheaper in Baltimore than in Ramapo. However, Ramapo's higher living costs typically provide access to top-rated schools, safer neighborhoods, and a range of professional opportunities within and near the city.

Income Tax

Both Baltimore and Ramapo have progressive income tax systems. Baltimore residents pay state-level income tax ranging from 2% to 5.75% based on income level, plus a fixed city income tax rate of 3.2%. In Ramapo, residents pay New York State income tax rates varying from 4% to 8.82%, with no additional municipal income tax.

Property Tax

Baltimore has a city property tax rate of 1.1%, in addition to Maryland's state property tax. Ramapo, as part of Rockland County, has a median property tax rate of 1.62%, higher than most U.S. counties due its proximity to NYC and the quality of local schools and services.

Sales Tax

Baltimore adopts Maryland's state-wide sales tax of 6%, with no extra city-level sales tax. Conversely, residents in Ramapo have to manage with a higher combined city and state sales tax which is roughly 8.4%, due to New York's state-level sales tax of 4% and Rockland County's sales tax of 4.4%.

Income
Type Baltimore Ramapo
Estimated median household income $54,652 $87,980
Estimated per capita income $35,091 $31,559
Cost of living index (U.S. average is 100) 105.7 161

If you make $50,000 in Baltimore, you will have to make $76,159 in Ramapo to maintain the same standard of living.

Geographical Conditions

Set on the Patapsco River's tidal arm, Baltimore offers majestic waterfront views and numerous marinas. In contrast, Ramapo is characterized by a pristine natural setting, featuring rolling hills and the stunning Ramapo Mountains.

Geographical information
Type Baltimore Ramapo
Land area 80.8 sq. miles 61.2 sq. miles
Population density 7,134.5 people per sq. mile 2,067.1 people per sq. mile
Elevation 100 feet 314 feet
Relative area comparison
Baltimore, MD Ramapo, NY
First ancestry reported - percentage
Ancestry BaltimoreRamapo
German 2.2% 5.2%
Irish 1.8% 7.9%
Italian 1.3% 9.2%
English 1.2% 2.8%
Polish 1.0% 5.6%
Russian 0.3% 4.6%
Greek 0.3% 0.4%
Scottish 0.3% 0.6%
West Indian 0.2% 8.9%
French 0.2% 0.7%
Hungarian 0.2% 2.5%
Scotch-Irish 0.2% 0.3%
Ukrainian 0.1% 0.7%
Swedish 0.1% 0.3%
Lithuanian 0.1% 0.3%
Czech 0.1% 0.6%
Norwegian 0.1% 0.2%
Dutch 0.1% 0.7%
Portuguese 0.0% 0.2%
Arab 0.0% 0.5%
Population origin - absolute values
Ancestry BaltimoreRamapo
German 8,006 5,711
Irish 6,860 8,638
Italian 4,797 9,987
English 4,415 3,082
Polish 3,854 6,124
Russian 1,244 4,997
Scottish 1,175 656
Greek 994 434
West Indian 759 9,716
French 700 728
Scotch-Irish 679 336
Hungarian 564 2,708
Ukrainian 406 807
Dutch 316 748
Swedish 305 348
Lithuanian 266 375
Czech 262 603
Norwegian 256 249
Swiss 183 182
Welsh 157 105
Foreign born residents - absolute values
Type Count
Region BaltimoreRamapo
All 49,825 24,848
Africa 10,854 643
Asia 12,475 5,639
Europe 5,198 5,782
Latin America 17,306 12,350
North America 694 399
Oceania 335 35
Foreign born residents - percentage
Type Percentage
Region BaltimoreRamapo
All 8.6% 22.8%
Africa 1.9% 0.6%
Asia 2.2% 5.2%
Europe 0.9% 5.3%
Latin America 3.0% 11.3%
North America 0.1% 0.4%

Education

Baltimore offers a wider variety of schooling options being a larger city, including esteemed colleges like Johns Hopkins University. However, public education has been a struggle. In comparison, Ramapo has excellent public schools and residents also have access to myriad top-rated colleges within nearby New York City. This makes Ramapo quite attractive to families regarding education.

School enrollment
Type Baltimore Ramapo
Nursery, preschool 6,447 (4.6%) 2,935 (8%)
Kindergarten 7,723 (5.5%) 2,209 (6%)
Grade 1 to 4 20,533 (14.7%) 8,516 (23.1%)
Grade 5 to 8 26,356 (18.9%) 8,353 (22.7%)
Grade 9 to 12 24,547 (17.6%) 8,400 (22.8%)
College undergrad 34,734 (24.9%) 5,063 (13.7%)
Graduate or professional 19,148 (13.7%) 1,368 (3.7%)
Students in private schools - absolute values
Type Count
Grade BaltimoreRamapo
Grades 1 to 8 (elementary and middle school) 5,471 9,068
Grades 9 to 12 (high school) 3,881 4,145
Undergraduate colleges 12,869 2,624
Students in private schools - percentage
Type Percentage
Grade BaltimoreRamapo
Grades 1 to 8 (elementary and middle school) 11.7% 53.8%
Grades 9 to 12 (high school) 15.8% 49.3%
Undergraduate colleges 37.1% 51.8%
Educational attainment
Type Baltimore Ramapo
Less than high school 11.2% 18.5%
High school or equiv. 26.6% 22.4%
Less than 1 year of college 5.3% 5.1%
1 or more years of college 13.3% 12.5%
Associate degree 6% 7.1%
Bachelor's degree 19.3% 19.5%
Master's degree 12.2% 10.2%
Profess. school degree 3.7% 3.4%
Doctorate degree 2.6% 1.4%
Education level (25-year-olds and older)
Type Baltimore Ramapo
Bachelor's degree or higher 37.7% 34.5%
Graduate or professional degree 18.5% 15.1%
High school or higher 88.8% 81.5%

Work and Economy

Baltimore's economy is fueled by several industries, with health and education at the forefront, due to large employers such as Johns Hopkins University and Health System. It also has thriving tech and defense industries. Conversely, Ramapo, situated within commuting distance of NYC, boasts a variety of working opportunities in numerous sectors, including finance, tech, and media.

Biggest Employers

The Johns Hopkins University and Health System comprise the largest employers in Baltimore, whereas in Ramapo, the East Ramapo Central School District is the biggest employer, closely followed by Rockland County Government.

Building permits
Type Average valueCount
City BaltimoreRamapoBaltimoreRamapo
1997 $100,200 $127,400 17 59
1998 $105,900 $127,600 64 74
1999 $104,300 $156,300 46 80
2000 $85,700 $168,900 219 48
2001 $91,000 $155,700 115 47
2002 $94,500 $234,300 181 27
2003 $73,500 $250,000 206 24
2004 $101,100 $389,300 433 21
2005 $117,100 $258,700 643 47
2006 $164,500 $214,100 332 116
2007 $152,300 $189,200 204 214
2008 $139,700 $187,300 153 174
2009 $111,800 $264,800 137 16
2010 $125,600 $465,200 118 14
2011 $131,000 $220,300 75 6
2012 $134,800 $236,600 164 4
2013 $144,400 $233,900 220 7
2014 $155,900 $241,000 241 18
2015 $141,600 $255,300 219 17
2016 $174,400 $253,100 267 19
2017 $177,200 $253,600 169 18
2018 $157,600 $253,500 99 17
2019 $167,400 $253,500 130 15
2020 $118,500 $253,500 101 14
2021 $137,300 $253,500 191 17

There were 191 building permits issued in Baltimore in 2012 (116 more than in 2011) compared to 17 building permits issued in Ramapo in 2012 (11 more than in 2011).

In Baltimore (Baltimore city), 87.4% voted for Democrats and 11.1% for Republicans in 2012 Presidential Election. In Ramapo (Rockland County), 52.9% voted for Democrats and 46.2% for Republicans.

Elections
Type DemocratsRepublicansOther
Year BaltimoreRamapoBaltimoreRamapoBaltimoreRamapo
2020 87.5% 50.7% 10.7% 48.9% 1.8% 0.4%
2016 84.8% 51.4% 10.5% 45.2% 4.6% 3.4%
2012 87.4% 52.9% 11.1% 46.2% 1.4% 0.9%
2008 87.6% 52.8% 11.7% 46.9% 0.6% 0.3%
2004 82.5% 49.0% 17.1% 49.7% 0.5% 1.3%
2000 82.9% 56.8% 14.2% 39.6% 2.9% 3.6%
1996 79.3% 56.2% 15.5% 36.0% 5.1% 7.8%
Breakdown of population affiliated with a religious congregation
Type AdherentsCongregations
Religion BaltimoreRamapoBaltimoreRamapo
CATHOLIC CHURCH 11.0% 35.1% 8.2% 6.8%
EPISCOPAL CHURCH 1.6% 0.7% 4.0% 3.2%
AMERICAN BAPTIST CHURCHES IN THE USA 1.4% 0.1% 2.2% 1.0%
SOUTHERN BAPTIST CONVENTION 1.4% 0.6% 7.3% 2.3%
EVANGELICAL LUTHERAN CHURCH IN AMERICA 1.0% 0.5% 4.3% 1.3%
MUSLIM ESTIMATE 0.6% 1.5% 1.5% 1.0%
SEVENTH DAY ADVENTIST CHURCH 0.5% 0.5% 1.5% 2.6%
LUTHERAN CHURCH 0.4% 0.0% 1.8% 0.3%

Weather

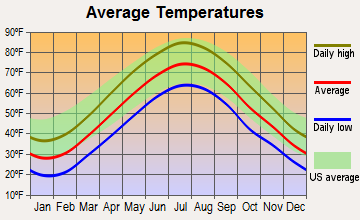
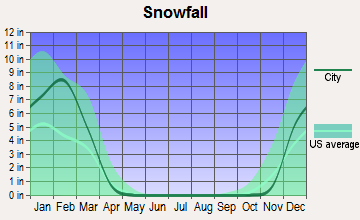
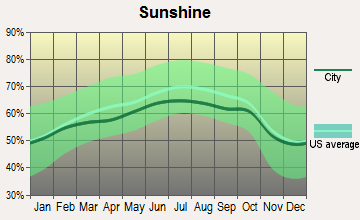
Baltimore tends to have a hotter and more humid climate, especially during the summer months, with mild, crisp falls and springs. Winter months can be quite cold, with moderate snowfall. Ramapo, on the other hand, has a nearly similar yearly climate pattern to Baltimore's but with slightly heavier snowfall during the winter months. Within comfortability ranges, both places offer a decent climate for different outdoor activities.

Weather and climate
Type Baltimore Ramapo
Temperature - Average 54.5°F 51.7°F
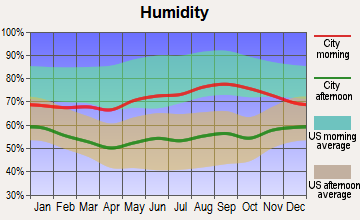
Humidity - Average morning or afternoon humidity 70.4% 67.3%
Humidity - Differences between morning and afternoon humidity 36% 28.2%
Humidity - Maximum monthly morning or afternoon humidity 84% 76.3%
Humidity - Minimum monthly morning or afternoon humidity 48% 48.1%
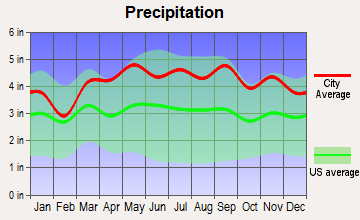
Precipitation - Yearly average 42.9 in 50.1 in
Snowfall - Yearly average 39.6 in 56.5 in
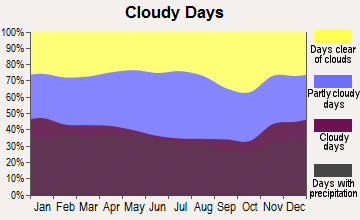
Clouds - Number of days clear of clouds 17.5% 16.8%
Sunshine amount - Average 60.3% 60.1%
Sunshine amount - Differences during a year 16% 20%
Sunshine amount - Maximum monthly 63% 64%
Sunshine amount - Minimum monthly 47% 43.9%
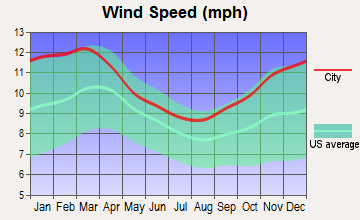
Wind speed - Average 7.9 mph 9.4 mph

Average climate in Baltimore, Maryland

Chicago, Illinois average temperatures Chicago, Illinois average precipitation Chicago, Illinois humidity Chicago, Illinois wind speed Chicago, Illinois snowfall Chicago, Illinois sunshine Chicago, Illinois clear and cloudy days
 

Average climate in Ramapo, New York

Chicago, Illinois average temperatures Chicago, Illinois average precipitation Chicago, Illinois humidity Chicago, Illinois wind speed Chicago, Illinois snowfall Chicago, Illinois sunshine Chicago, Illinois clear and cloudy days
 

Air pollution
Type AQICONO2OZONEPM10PM25SO2
Year BaltimoreRamapoBaltimoreRamapoBaltimoreRamapoBaltimoreRamapoBaltimoreRamapoBaltimoreRamapoBaltimoreRamapo
2018 89 99 0.23 0.29 11.8 16.7 28.3 28.0 N/A N/A 7.9 6.1 0.1 0.6
2017 89 90 0.25 0.11 12.1 16.6 27.7 28.4 N/A N/A 8.2 5.9 0.2 0.6
2016 102 92 0.26 0.26 13.0 17.3 28.3 29.2 N/A N/A 7.7 6.3 0.3 0.8
2015 89 99 0.28 0.27 12.4 18.8 28.3 28.5 N/A N/A 9.5 7.6 0.4 1.5
2014 82 90 0.25 0.34 11.8 19.1 25.7 28.1 N/A N/A 10.9 7.0 0.6 1.7
2013 86 93 0.22 0.39 10.7 19.4 25.6 28.3 N/A N/A 9.6 7.8 0.5 1.9
2012 98 95 0.24 0.44 11.3 19.0 25.0 28.3 N/A N/A 11.2 7.6 0.5 3.2
2011 101 104 0.24 0.46 12.5 20.9 25.1 28.5 N/A N/A 12.1 8.8 0.8 4.7
2010 110 102 0.24 0.44 13.1 18.4 26.9 30.8 N/A N/A 12.2 8.2 1.0 2.6
2009 84 99 0.23 0.46 12.2 20.9 23.5 24.1 N/A N/A 10.4 9.2 1.4 3.5
2008 96 99 0.25 0.45 13.6 22.0 21.6 23.5 N/A N/A 12.8 11.3 1.8 4.2
2007 107 116 0.21 0.52 13.8 24.5 23.2 24.2 N/A N/A 14.0 12.5 2.5 5.4
2006 112 93 N/A 0.51 12.0 22.2 24.6 23.4 N/A N/A 14.7 N/A N/A 5.7
2005 111 106 N/A 0.60 14.3 24.7 26.3 23.1 23.0 N/A 17.1 N/A N/A 7.2
2004 108 92 N/A 0.59 15.3 23.5 28.0 21.8 23.1 N/A 16.3 N/A N/A 7.0
2003 110 92 N/A 0.68 17.8 24.2 22.4 22.8 N/A N/A 13.9 N/A N/A 7.1
2002 119 112 N/A 0.65 17.4 24.2 19.4 24.7 N/A N/A 16.3 N/A 5.8 6.9
2001 104 115 N/A 0.68 18.2 27.2 23.9 25.2 N/A 22.6 N/A N/A 6.0 7.7
2000 101 101 N/A 0.69 17.0 29.9 22.4 22.4 N/A 22.2 N/A N/A 6.3 7.6
Natural disasters
Type Baltimore Ramapo
Tornado activity compared to U.S. average 117.8% 65.4%
Earthquake activity compared to U.S. average 40.6% 31.9%
Natural disasters compared to U.S. average 0% 23%

Transportation

Baltimore offers a range of public transportation options, including buses, light rail, and subway. It's also bike-friendly and pedestrian-friendly in certain areas. Ramapo residents rely heavily on personal vehicles, although bus services are available with a commuter rail connection to NYC.

Transport
Type Baltimore Ramapo
Amtrak stations 2 0
Amtrak stations nearby 2 2
FAA registered aircraft 136 0
FAA registered aircraft manufacturers and dealers 2 0
Means of transportation to work
Type Baltimore Ramapo
Bicycle 0.4% 0.3%
Bus 6.2% 7.7%
Carpooled 7.3% 13.1%
Car alone 77.2% 67.4%
Railroad 0.3% 1.8%
Streetcar 1.2% 0%
Subway 0.2% 0.2%
Taxicab 0.7% 1.3%
Walked 4.5% 3.9%
Means of transportation to work
Average travel time to work
Type Baltimore Ramapo
Average 32.3 min 33.2 min
Travel time to work
Time leaving to work
Travel time to work
Time leaving to work

Real Estate

Real estate in Baltimore presents a broad range, from high-end waterfront properties to affordable options in various neighborhoods. Conversely, Ramapo offers mostly detached single-family homes, reflecting its suburban character. Housing costs are generally higher in Ramapo due to its proximity to NYC and wealthier surrounding neighborhoods.

Neighborhoods

Baltimore neighborhoods range from historical areas like Fells Point to upscale ones like Harbor East. Each neighborhood exhibits a unique culture. Ramapo, on the other hand, offers a suburban environment where residents commonly know each other, enhancing the community feel.

Houses and residents
Type Baltimore Ramapo
Houses 293,487 32,422
Average household size (people) 2.4 3.6
Houses occupied 254,370 (86.7%) 31,561 (97.3%)
Houses occupied by owners 123,249 (48.5%) 20,193 (64%)
Houses occupied by renters 131,121 (51.5%) 11,368 (36%)
Median rent asked for vacant for-rent units $1,254 $1,574
Median price asked for vacant for-sale houses and condos $207,303 $706,132
Estimated median house or condo value $193,100 $473,589
Median number of rooms in apartments 4.2 4.2
Median number of rooms in houses and condos 6.5 7.1
Renting percentage 52.3% 40.2%
Housing density (houses/condos per square mile) 3,632.1 529.4
Household income disparities 49.4% 45.4%
Housing units without a mortgage 2,415 (2.8%) 4,126 (24.5%)
Housing units with both a second mortgage and home equity loan 5,740 (6.6%) 35 (0.2%)
Housing units with a mortgage 84,578 (97.2%) 12,701 (75.5%)
Housing units with a home equity loan 579 (0.7%) 1,604 (9.5%)
Housing units with a second mortgage 8,544 (9.8%) 1,110 (6.6%)
Housing units lacking complete kitchen facilities 6% 0.7%
Housing units lacking complete plumbing facilities 5.1% 0.6%
Housing units in structures
Housing units in structures BaltimoreRamapo
One, detached 16.4% 55.6%
One, attached 49.5% 6.9%
Two 4.5% 6.8%
3 or 4 4.9% 8.8%
5 to 9 5.5% 6.2%
10 to 19 4.8% 4.0%
20 to 49 2.8% 3.9%
50 or more 11.4% 7.8%
Mobile homes 0.2% 0.1%
Boats, RVs, vans, etc. 0.1% 0.0%
Marital status
Type Baltimore Ramapo
Divorced 10% 5.6%
Never married 50.3% 27.8%
Now married 30.9% 59.1%
Separated 3.1% 1.9%
Widowed 5.8% 5.5%
Class of workers - percentage
Class of Workers BaltimoreRamapo
Employee of private company 58.2% 62.0%
Private not-for-profit wage and salary workers 14.1% 11.5%
State government workers 7.6% 4.3%
Local government workers 7.2% 9.1%
Federal government workers 5.9% 1.3%
Self-employed workers in own not incorporated business 4.7% 6.4%
Self-employed in own incorporated business 2.2% 5.1%
Unpaid family workers 0.1% 0.3%
Class of workers - absolute values
Class of Workers BaltimoreRamapo
Employee of private company 157,320 28,264
Federal government workers 15,922 607
Local government workers 19,521 4,128
Private not-for-profit wage and salary workers 37,988 5,264
Self-employed in own incorporated business 6,054 2,307
Self-employed workers in own not incorporated business 12,671 2,937
State government workers 20,410 1,977
Unpaid family workers 356 127

Industries and Occupations

Key industries in Baltimore include healthcare, education, and defense. Notably, cyber security and biotechnology sectors have seen significant growth. In comparison, Ramapo's economy centers around retail, healthcare, and education, reflecting its suburban characteristics.

Food environment data per 10,000 residents
Food environment statistics BaltimoreRamapo
Number of convenience stores (no gas) 1.5 1.0
Number of convenience stores (with gas) 1.6 1.2
Number of full-service restaurants 5.2 9.7
Number of grocery stores 3.1 3.2
Food environment - absolute values
Food environment statistics BaltimoreRamapo
Number of convenience stores (no gas) 97 29
Number of convenience stores (with gas) 100 36
Number of full-service restaurants 330 288
Number of grocery stores 197 95
Number of supercenters and club stores 0 2
Obesity and diabetes
Food environment statistics rate BaltimoreRamapo
Adult diabetes rate 12.1% 8.7%
Adult obesity rate 32.1% 24.1%
Low-income preschool obesity rate 12.3% 11.0%

Health Care

Baltimore is a significant healthcare hub led by top-ranked facilities such as Johns Hopkins Hospital. Ramapo residents have access to quality healthcare, with many renowned medical centers within a short drive, including the Good Samaritan Hospital.


Fatal vehicle accidents per 100,000 residents
Type Total count per 100,000Drunk per 100,000Fatal count per 100,000Pedestrian count per 100,000Person count per 100,000Vehicle count per 100,000
Year BaltimoreRamapoBaltimoreRamapoBaltimoreRamapoBaltimoreRamapoBaltimoreRamapoBaltimoreRamapo
2021 8.2 2.4 0.0 0.0 8.3 2.4 4.3 0.0 16.1 7.9 12.3 4.7
2020 9.8 1.6 2.4 0.0 10.6 4.0 3.1 0.8 23.8 10.3 17.3 1.6
2019 6.9 1.6 1.9 0.0 7.4 1.6 3.9 0.8 16.5 1.6 10.3 1.6
2018 5.5 2.4 0.7 0.0 5.6 2.4 1.8 1.6 13.8 4.0 9.0 4.0
2017 6.1 1.6 1.0 0.0 6.2 1.6 2.8 3.2 12.6 2.4 10.3 2.4
2016 7.5 1.6 1.5 0.0 8.6 1.6 3.2 1.6 19.5 3.2 14.1 1.6
2015 6.3 1.6 1.8 0.0 6.7 2.4 2.9 0.8 15.6 7.1 10.4 4.0
2014 4.7 3.2 0.5 0.0 4.8 3.2 2.7 0.8 11.1 10.3 7.1 5.5
2013 4.3 2.4 1.0 1.6 5.0 2.4 2.4 0.8 6.6 2.4 6.3 2.4
2012 4.3 0.8 0.8 0.8 4.5 0.8 1.8 0.0 9.7 2.4 6.9 1.6
2011 3.7 4.0 1.6 0.8 4.0 4.0 1.9 1.6 8.7 11.1 6.5 4.0
2010 6.0 2.4 2.6 0.0 6.3 4.0 2.1 0.0 16.1 5.5 8.7 4.0
2009 5.8 0.0 1.9 0.0 6.0 0.0 3.0 0.0 16.2 0.0 9.3 0.0
2008 7.2 1.7 2.0 0.0 7.5 1.7 1.9 0.0 17.1 6.1 10.2 2.6
2007 6.6 1.8 2.3 0.0 7.3 1.8 3.0 0.9 16.7 2.6 10.3 1.8
2006 6.6 6.2 2.8 1.8 7.0 6.2 3.3 2.6 17.0 19.4 9.8 7.9
2005 5.2 1.8 1.1 0.0 5.3 1.8 2.2 1.8 14.4 3.6 8.4 1.8
2004 6.1 7.2 2.5 0.9 6.9 7.2 2.2 1.8 19.5 24.2 9.5 12.6
2003 5.3 7.2 1.1 0.9 5.8 7.2 2.5 3.6 14.9 15.4 8.1 8.1
2002 6.1 3.6 1.7 0.0 6.5 3.6 2.0 1.8 15.9 7.3 7.9 4.5
2001 0.8 3.7 0.0 0.0 0.8 3.7 0.2 0.9 2.8 7.3 2.5 4.6
2000 1.2 2.8 0.8 0.0 1.7 2.8 0.2 0.9 5.7 4.6 2.9 2.8
1999 7.0 4.0 2.1 2.0 7.1 5.0 3.5 3.0 19.1 9.9 9.5 5.0
1998 6.7 0.0 1.1 0.0 6.7 0.0 4.6 0.0 20.0 0.0 10.7 0.0
1997 7.1 7.1 1.8 0.0 7.5 9.1 2.7 1.0 22.4 27.3 11.6 11.1
1996 7.1 0.0 1.0 0.0 7.6 0.0 3.6 0.0 18.5 0.0 9.2 0.0
1995 6.8 0.0 1.7 0.0 7.4 0.0 2.8 0.0 19.6 0.0 10.5 0.0
1994 9.1 0.0 1.4 0.0 9.6 0.0 4.7 0.0 23.2 0.0 13.3 0.0
1993 8.7 0.0 0.8 0.0 9.2 0.0 3.1 0.0 21.6 0.0 12.3 0.0
1992 7.0 0.0 1.4 0.0 7.6 0.0 2.5 0.0 17.5 0.0 9.4 0.0
1991 8.5 0.0 0.8 0.0 8.7 0.0 4.9 0.0 21.9 0.0 10.7 0.0
1990 6.5 0.0 0.8 0.0 6.7 0.0 0.0 0.0 16.7 0.0 8.4 0.0
1989 7.8 0.0 1.8 0.0 8.1 0.0 0.0 0.0 21.2 0.0 10.8 0.0
1988 8.0 0.0 2.1 0.0 8.4 0.0 0.0 0.0 23.2 0.0 12.1 0.0
1987 10.1 0.0 3.5 0.0 10.5 0.0 0.0 0.0 26.5 0.0 14.1 0.0
1986 8.2 0.0 2.0 0.0 8.6 0.0 0.0 0.0 21.8 0.0 11.1 0.0
1985 8.8 0.0 3.2 0.0 9.5 0.0 0.0 0.0 18.7 0.0 12.2 0.0
1984 8.2 0.0 2.0 0.0 8.4 0.0 0.0 0.0 19.8 0.0 11.7 0.0
1983 7.0 0.0 4.1 0.0 7.5 0.0 0.0 0.0 17.9 0.0 9.1 0.0
1982 8.0 0.0 3.7 0.0 8.1 0.0 0.0 0.0 20.0 0.0 11.6 0.0
1981 7.8 0.0 2.4 0.0 8.2 0.0 0.0 0.0 18.9 0.0 10.6 0.0
1980 8.1 2.2 2.8 0.0 8.4 2.2 0.0 0.0 17.2 7.9 10.2 3.4
1979 7.3 1.1 1.9 0.0 7.9 1.1 0.0 0.0 16.5 2.3 9.0 2.3
1978 8.4 0.0 1.6 0.0 8.5 0.0 0.0 0.0 19.7 0.0 10.6 0.0
1977 7.9 0.0 0.6 0.0 7.9 0.0 0.0 0.0 18.4 0.0 9.5 0.0
1976 7.6 0.0 1.1 0.0 8.0 0.0 0.0 0.0 17.6 0.0 10.7 0.0
1975 7.4 0.0 1.1 0.0 7.9 0.0 0.0 0.0 17.4 0.0 10.5 0.0

Fatal vehicle accidents
Type Total countDrunkFatal countPedestrian countPerson countVehicle count
Year BaltimoreRamapoBaltimoreRamapoBaltimoreRamapoBaltimoreRamapoBaltimoreRamapoBaltimoreRamapo
1975 63 0 9 0 67 0 0 0 147 0 89 0
1976 63 0 9 0 67 0 0 0 147 0 89 0
1977 65 0 5 0 65 0 0 0 151 0 78 0
1978 68 0 13 0 69 0 0 0 160 0 86 0
1979 58 1 15 0 63 1 0 0 132 2 72 2
1980 64 2 22 0 66 2 0 0 135 7 80 3
1981 61 0 19 0 64 0 0 0 148 0 83 0
1982 62 0 29 0 63 0 0 0 155 0 90 0
1983 54 0 32 0 58 0 0 0 138 0 70 0
1984 63 0 15 0 64 0 0 0 152 0 90 0
1985 67 0 24 0 72 0 0 0 142 0 93 0
1986 62 0 15 0 65 0 0 0 165 0 84 0
1987 76 0 26 0 79 0 0 0 199 0 106 0
1988 60 0 16 0 63 0 0 0 173 0 90 0
1989 58 0 13 0 60 0 0 0 157 0 80 0
1990 48 0 6 0 49 0 0 0 123 0 62 0
1991 62 0 6 0 64 0 36 0 160 0 78 0
1992 51 0 10 0 55 0 18 0 127 0 68 0
1993 62 0 6 0 66 0 22 0 154 0 88 0
1994 64 0 10 0 67 0 33 0 163 0 93 0
1995 47 0 12 0 51 0 19 0 135 0 72 0
1996 48 0 7 0 51 0 24 0 124 0 62 0
1997 47 7 12 0 49 9 18 1 147 27 76 11
1998 43 0 7 0 43 0 30 0 129 0 69 0
1999 44 4 13 2 45 5 22 3 121 10 60 5
2000 8 3 5 0 11 3 1 1 37 5 19 3
2001 5 4 0 0 5 4 1 1 18 8 16 5
2002 39 4 11 0 42 4 13 2 102 8 51 5
2003 34 8 7 1 37 8 16 4 96 17 52 9
2004 39 8 16 1 44 8 14 2 125 27 61 14
2005 33 2 7 0 34 2 14 2 92 4 54 2
2006 42 7 18 2 45 7 21 3 109 22 63 9
2007 42 2 15 0 47 2 19 1 107 3 66 2
2008 46 2 13 0 48 2 12 0 109 7 65 3
2009 37 0 12 0 38 0 19 0 103 0 59 0
2010 37 3 16 0 39 5 13 0 100 7 54 5
2011 23 5 10 1 25 5 12 2 54 14 40 5
2012 27 1 5 1 28 1 11 0 60 3 43 2
2013 27 3 6 2 31 3 15 1 41 3 39 3
2014 29 4 3 0 30 4 17 1 69 13 44 7
2015 39 2 11 0 42 3 18 1 97 9 65 5
2016 46 2 9 0 53 2 20 2 120 4 87 2
2017 37 2 6 0 38 2 17 4 77 3 63 3
2018 33 3 4 0 34 3 11 2 83 5 54 5
2019 41 2 11 0 44 2 23 1 98 2 61 2
2020 57 2 14 0 62 5 18 1 139 13 101 2
2021 47 3 0 0 48 3 25 0 93 10 71 6
Police full-time law enforcement employees
Year BaltimoreRamapo
2021 2,843 118
2020 2,940 0
2019 2,940 126
2018 2,935 0
2017 2,937 121
2016 2,908 117
2015 2,960 123
2014 3,156 127
2013 3,220 129
2012 3,342 128
2011 3,470 130
2010 3,503 136
2009 3,586 143
2008 3,678 144
2007 3,684 143
2006 3,712 138
2005 3,663 141
2004 3,676 139
2003 3,789 136
Police full-time law enforcement employees (per 1,000 residents)
Year BaltimoreRamapo
2021 4.8 1.2
2020 5.0 0.0
2019 4.9 1.3
2018 4.8 0.0
2017 4.8 1.3
2016 4.7 1.3
2015 4.8 1.4
2014 5.1 1.4
2013 5.2 1.5
2012 5.3 1.5
2011 5.5 1.5
2010 5.6 1.6
2009 5.6 1.9
2008 5.8 1.9
2007 5.9 1.9
2006 5.8 1.8
2005 5.7 1.9
2004 5.8 1.9
2003 5.9 1.9
Mechanisms of suicide per 1,000,000 residents
Mechanism BaltimoreRamapo
Suicides from 2000 to 2006 80.8 37.8
Firearm 32.9 15.2
Poisoning 10.9 0
Suffocation 26.2 10.3

Infrastructure

Baltimore city boasts a wide array of older architectural styles, contributing to its historical charm. The city is constantly working to update its infrastructure. On the other hand, Ramapo, primarily residential, focuses on maintaining the suburban infrastructure conducive to quality family living.

Infrastructure
Type Baltimore Ramapo
TV stations 19 27
Nuclear power plants nearby 0 2

Culture and Food

Baltimore is known for its rich history and cultural diversity, reflected in an array of international cuisine, festivals, and art events. The city particularly celebrates its maritime heritage with local specialties like crab cakes. Ramapo, while smaller, has an intimate and diverse community feel with cultural events and a variety of restaurants serving global cuisine.

Sports Teams

Sports enthusiasts in Baltimore can enjoy games from the Baltimore Ravens(NFL) and the Baltimore Orioles(MLB). Ramapo residents, while they don't have local professional teams, are within a convenient commute to enjoy numerous New York City-based professional teams including the NY Knicks(NBA), NY Giants(NFL), and NY Yankees(MLB).