Comparing the urban living of Bronx, NY with the laid-back coastal city of San Diego, CA can present a wide-ranging contrast. Both cities have distinct offerings and living experiences. On one hand, is Bronx with its multicultural lifestyle, gritty urban living infused with arts and culture, and strong neighborhood ties contrasts with San Diego's sun-soaked beaches, outdoor-oriented lifestyle, high-tech economy, and relaxed Southern California vibe. The following comparison focuses on key aspects such as crime/safety, cost of living, and more to facilitate a comprehensive understanding of life in both cities.
Historically, crime has been high in the Bronx but rates have decreased significantly in recent years. Efforts from community and law enforcement have improved safety but crime still remains a concern for both residents and visitors. On the contrary, San Diego has lower crime rates and is considered one of the safest cities in the US, particularly for a city of its size.
Cost of Living
Living costs are high in both cities. However, San Diego is generally more expensive in terms of housing, groceries, and healthcare. Bronx, though cheaper, still carries a high price tag, especially compared to the national average, mainly due to its proximity to Manhattan.
Income Tax
Both New York and California have high state income taxes. However, California's highest rate is slightly elevated at 13.3% compared to New York's 8.82%. Hence, high-earning individuals may face higher taxes in San Diego.
Property Tax
The property tax rate in New York City is about 0.90%, while San Diego's property tax rate is slightly lower on average, usually hovering around 0.77%.
Sales Tax
New York City which includes Bronx has a sales tax rate of 8.875%. In contrast, San Diego's sales tax is slightly higher at 7.75%. However, expenses in San Diego tend to be higher, which might offset this difference in taxes.
Income
Type
Bronx
San Diego
Estimated median household income
$43,011
$93,042
Estimated per capita income
$23,354
$48,380
Cost of living index (U.S. average is 100)
172.8
126.4
If you make $50,000 in San Diego, you will have to make $68,354 in Bronx to maintain the same standard of living.
Geographical Conditions
Bronx is mostly flat but features several parks, including the famed Bronx Zoo and New York Botanical Garden. It's a densely urbanized borough of New York City. San Diego offers diverse geography, including numerous beaches, canyons, and the nearby mountains and desert for outdoor enthusiasts.
Geographical information
Type
Bronx
San Diego
Land area
42 sq. miles
324.3 sq. miles
Population density
32,928 people per sq. mile
4,259.7 people per sq. mile
Elevation
120 feet
40 feet
Relative area comparison
Bronx, NY San Diego, CA
Education
Educational opportunities abound in both cities. Bronx, being a part of New York City, has a good mix of public and private schools, and several colleges including Fordham University and the City University of New York. San Diego is home to various high-ranking universities such as the University of California, San Diego, and San Diego State University.
Bronx is still trying to catch up with the economic development of other New York boroughs, but industries such as health care, education, and retail trade are prominent. San Diego's economy, on the other hand, is boosted by industries like defense/military, tourism, international trade, and manufacturing.
Biggest Employers
In the Bronx, the biggest employers are health-related, including Montefiore Medical Center and Bronx-Lebanon Hospital. In San Diego, the U.S. Navy, the University of California San Diego, and Sharp HealthCare are among the top employers.
In Bronx (Bronx County), 91.9% voted for Democrats and 8.1% for Republicans in 2012 Presidential Election. In San Diego (San Diego County), 52.6% voted for Democrats and 45.0% for Republicans.
Elections
Type
Democrats
Republicans
Other
Year
Bronx
San Diego
Bronx
San Diego
Bronx
San Diego
2020
83.7%
60.3%
16.0%
37.5%
0.3%
2.1%
2016
88.6%
56.3%
9.5%
36.6%
2.0%
7.1%
2012
91.9%
52.6%
8.1%
45.0%
0.0%
2.4%
2008
89.0%
54.2%
11.0%
44.0%
0.0%
1.8%
2004
82.9%
46.7%
16.5%
52.9%
0.6%
0.4%
2000
86.5%
45.8%
11.8%
49.8%
1.7%
4.5%
1996
85.8%
44.1%
10.5%
45.6%
3.7%
10.3%
Breakdown of population affiliated with a religious congregation
Type
Adherents
Congregations
Religion
Bronx
San Diego
Bronx
San Diego
CATHOLIC CHURCH
25.5%
25.9%
11.5%
6.7%
MUSLIM ESTIMATE
2.8%
0.7%
3.9%
1.1%
AMERICAN BAPTIST CHURCHES IN THE USA
0.7%
0.1%
4.4%
1.5%
SEVENTH DAY ADVENTIST CHURCH
0.7%
0.5%
6.5%
2.0%
EPISCOPAL CHURCH
0.4%
0.4%
3.7%
2.0%
EVANGELICAL LUTHERAN CHURCH IN AMERICA
0.2%
0.4%
2.6%
2.0%
SOUTHERN BAPTIST CONVENTION
0.2%
1.1%
2.4%
12.0%
LUTHERAN CHURCH
0.1%
0.4%
0.6%
2.2%
Weather
Bronx experiences a variety of seasons with hot summers and cold, snowy winters. The weather in San Diego is more predictable and pleasant, characterized by a year-round temperate climate with mild winters and warm summers, thereby offering beaches and outdoor activities for locals and tourists alike.
Weather and climate
Type
Bronx
San Diego
Temperature - Average
54.7°F
64.4°F
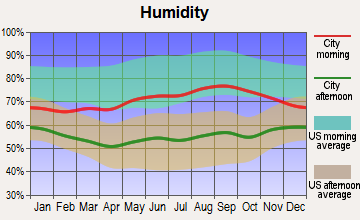
Humidity - Average morning or afternoon humidity
67.2%
74%
Humidity - Differences between morning and afternoon humidity
26.4%
22%
Humidity - Maximum monthly morning or afternoon humidity
75.6%
80%
Humidity - Minimum monthly morning or afternoon humidity
49.2%
58%
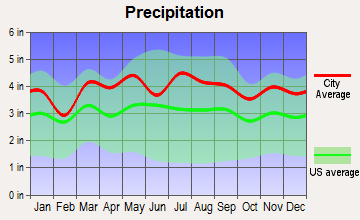
Precipitation - Yearly average
47 in
11 in
Snowfall - Yearly average
54.5 in
0 in
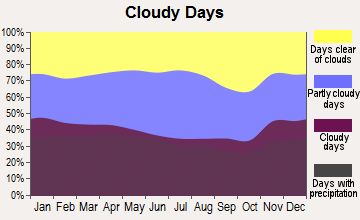
Clouds - Number of days clear of clouds
16.5%
24.3%
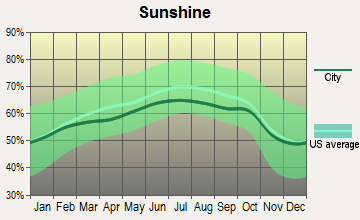
Sunshine amount - Average
60.2%
74.8%
Sunshine amount - Differences during a year
20%
19%
Sunshine amount - Maximum monthly
64%
75%
Sunshine amount - Minimum monthly
44%
56%
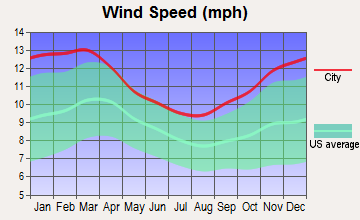
Wind speed - Average
10.7 mph
6.9 mph
Average climate in Bronx, New York
Average climate in San Diego, California
Air pollution
Type
AQI
CO
NO2
OZONE
PB
PM10
PM25
SO2
Year
Bronx
San Diego
Bronx
San Diego
Bronx
San Diego
Bronx
San Diego
Bronx
San Diego
Bronx
San Diego
Bronx
San Diego
Bronx
San Diego
2018
102
101
0.31
0.53
15.8
11.2
24.4
32.6
N/A
0.007
N/A
N/A
7.4
10.5
0.6
0.1
2017
100
115
0.04
0.63
15.7
12.7
24.6
32.7
N/A
0.007
N/A
N/A
7.0
10.8
0.6
0.1
2016
98
105
0.30
0.46
16.4
13.0
24.6
30.4
N/A
0.006
N/A
N/A
7.2
11.4
0.8
0.1
2015
105
111
0.28
0.43
18.0
13.2
23.6
29.9
N/A
0.005
N/A
N/A
8.6
11.9
1.4
0.1
2014
99
105
0.32
0.44
18.0
11.6
23.6
31.1
N/A
0.007
N/A
N/A
8.4
11.1
1.7
0.1
2013
103
138
0.39
0.50
18.9
12.4
23.5
27.4
N/A
0.019
N/A
N/A
9.3
12.3
2.1
0.2
2012
104
110
0.44
0.53
18.8
12.7
23.9
28.0
N/A
0.019
N/A
N/A
9.7
13.6
3.1
0.2
2011
113
122
0.46
0.51
20.9
13.5
22.1
29.0
N/A
0.034
N/A
N/A
11.6
14.0
4.5
1.5
2010
113
109
0.53
0.52
20.2
14.0
23.7
29.3
N/A
0.019
N/A
N/A
10.8
13.9
4.7
1.0
2009
107
121
0.53
0.64
22.3
15.6
19.5
26.9
N/A
0.014
N/A
N/A
10.8
15.1
5.4
2.7
2008
114
127
0.53
0.71
23.3
16.1
19.9
28.4
0.013
N/A
N/A
67.3
12.1
N/A
5.9
2.6
2007
122
157
0.60
0.71
24.6
16.4
19.1
28.0
0.016
0.012
N/A
64.6
13.2
N/A
7.0
2.8
2006
120
123
0.50
0.81
25.0
18.9
18.9
27.1
0.018
0.056
N/A
64.8
12.8
N/A
7.0
3.4
2005
115
112
0.60
0.90
27.0
19.2
17.8
24.4
N/A
0.049
N/A
N/A
N/A
N/A
9.3
3.7
2004
109
120
0.62
0.93
25.6
18.4
16.7
25.9
0.030
0.055
N/A
N/A
N/A
N/A
8.8
4.6
2003
110
124
0.75
0.88
27.4
19.4
17.1
25.4
0.022
0.049
26.9
N/A
N/A
N/A
8.9
3.8
2002
124
125
0.67
0.86
27.9
20.9
17.4
25.9
0.008
0.039
25.0
N/A
N/A
N/A
8.6
3.6
2001
126
132
0.66
0.93
30.0
20.4
17.8
26.5
0.020
0.048
22.8
N/A
N/A
N/A
10.0
3.4
2000
115
134
0.68
1.02
29.4
22.3
16.0
23.8
0.022
0.054
22.2
N/A
N/A
N/A
10.2
3.6
Natural disasters
Type
Bronx
San Diego
Tornado activity compared to U.S. average
58.3%
6.7%
Earthquake activity compared to U.S. average
31%
5,835%
Natural disasters compared to U.S. average
14%
39%
Transportation
In the Bronx, public transportation via subways and buses dominates, making commuting efficient, though sometimes crowded. San Diego also has a comprehensive public transit system but given its spread-out nature, cars are more commonly used for commuting.
Transport
Type
Bronx
San Diego
Amtrak stations
0
1
Amtrak stations nearby
3
2
FAA registered aircraft
39
852
FAA registered aircraft manufacturers and dealers
0
33
Means of transportation to work
Type
Bronx
San Diego
Bicycle
0.2%
0.6%
Bus
15.6%
2%
Carpooled
9.3%
9.4%
Car alone
27%
81.7%
Ferryboat
0%
0.1%
Motorcycle
0%
0.3%
Railroad
2%
0.5%
Streetcar
0.2%
0%
Subway
34.6%
0.1%
Taxicab
1.3%
0.1%
Walked
7.2%
3.6%
Average travel time to work
Type
Bronx
San Diego
Average
44.2 min
27.4 min
Real Estate
Real estate is expensive in both cities. However, San Diego's real estate is pricier with options ranging from oceanfront properties to condos. The Bronx offers more affordable options, especially in older, established neighborhoods.
Neighborhoods
Bronx is known for its diverse neighborhoods such as Riverdale, Throgs Neck, and Morris Park. Each neighborhood has its unique vibe and cultural mix. San Diego features equally diverse but more sprawling neighborhoods like La Jolla, North Park, and Gaslamp Quarter, which offer a more laid-back and spacious living environment.
Houses and residents
Type
Bronx
San Diego
Houses
490,659
555,456
Average household size (people)
2.8
2.6
Houses occupied
463,212 (94.4%)
521,000 (93.8%)
Houses occupied by owners
90,522 (19.5%)
251,507 (48.3%)
Houses occupied by renters
372,690 (80.5%)
269,493 (51.7%)
Median rent asked for vacant for-rent units
$1,273
$2,096
Median price asked for vacant for-sale houses and condos
$708,992
$957,871
Estimated median house or condo value
$465,000
$768,800
Median number of rooms in apartments
3.7
3.7
Median number of rooms in houses and condos
5.1
5.9
Renting percentage
80.7%
51.7%
Housing density (houses/condos per square mile)
11,675
1,712.6
Household income disparities
50.2%
42.3%
Housing units without a mortgage
12,021 (34%)
2,803 (1.6%)
Housing units with both a second mortgage and home equity loan
105 (0.3%)
12,495 (6.9%)
Housing units with a mortgage
23,339 (66%)
177,643 (98.4%)
Housing units with a home equity loan
2,053 (5.8%)
694 (0.4%)
Housing units with a second mortgage
2,159 (6.1%)
16,654 (9.2%)
Housing units lacking complete kitchen facilities
1.4%
0.8%
Housing units lacking complete plumbing facilities
Self-employed workers in own not incorporated business
16,572
39,709
State government workers
14,515
29,438
Unpaid family workers
1,000
808
Industries and Occupations
Healthcare and education dominate the employment scenario in the Bronx. Meanwhile, San Diego's economy is diverse with key industries being defense/military, tourism, international trade, and research and manufacturing, particularly in biotechnology and healthcare.
In terms of healthcare, both cities have excellent facilities. Bronx hosts some top-rated hospitals like Montefiore Medical Center. San Diego also has renowned medical centers, such as UC San Diego Health System and Alvarado Hospital Medical Center.
Health (county statistics)
Type
Bronx
San Diego
General health status score of residents in this county from 1 (poor) to 5 (excellent)
Both cities have robust infrastructures. Bronx's infrastructure is more urban, with a dense network of subways and buses, high-rise apartment buildings, and iconic structures like Yankee Stadium. San Diego's infrastructure is sprawling and diverse, including high-tech industries, military bases, tourist attractions like Balboa Park and the San Diego Zoo.
Infrastructure
Type
Bronx
San Diego
Hospitals
57
26
TV stations
30
13
Bank branches located here
118
255
Bank institutions located here
24
40
Main business address for public companies
2
92
Drinking water stations with no reported violations in the past
1
5
Drinking water stations with reported violations in the past
4
20
Schools
School facilities
Type
Bronx
San Diego
Private elementary/middle schools
54
39
Private high schools
20
22
Public elementary/middle schools
285
221
Public high schools
155
71
Colleges/Universities
9
36
Culture and Food
Cultural and food scenes in both cities are rich and diverse. The Bronx boasts a broad mix of cultures, with food and art scenes deeply influenced by African-American, Latin, and Caribbean cultures. San Diego's culture is a mix of Mexican heritage, surfer lifestyle, and military influence. Food culture is centered around Mexican cuisine, fresh seafood, and craft beer.
Sports Teams
Bronx is the home of the world-famous Major League Baseball team, the New York Yankees. San Diego has the MLB's Padres, the NFL's now-departed Chargers, as well as various minor league and college teams.


 Bronx, NY
 San Diego, CA