Comparing Bronx, New York (NY) to South Aurora, Colorado (CO) presents two contrasting profiles of life in the US. The Bronx has a vibrant, bustling metropolis with a unique blend of cultures, while South Aurora provides suburban comfort with access to beautiful natural scenery. Each location has its unique factors to consider, including crime and safety, weather, cost of living, education, economy, infrastructure, real estate, transportation, taxes, culture and food, sports, geography, and health care.
The crime rate in the Bronx, NY generally surpasses that of South Aurora, CO. The Bronx has been known for its high crime rates, though initiatives implemented over the years have seen crime levels drop. However, South Aurora prides itself on lower crime rates, generally offering a safer living environment. For tourists, common sense precautionary measures are advised in both areas.
Cost of Living
Living in the Bronx, NY involves a higher cost of living compared to South Aurora, CO. Everything from groceries, housing, utilities, and entertainment is costlier in the Bronx, attributed mainly to its location within one of the world's major cities. South Aurora, while not cheap, offers a more affordable cost of living, particularly in terms of housing.
Income Tax
The income tax in Bronx, NY is progressive, ranging from 4.00% to 10.90% depending on income. On the contrary, South Aurora, CO follows a flat rate state income tax of 4.63%, which adds to its affordability.
Property Tax
New York City, including the Bronx, has lower property taxes on average compared to the rest of the country, however, the high property values balance this out. In South Aurora, homeowners are subject to Colorado’s relatively low property tax rates, though recent increases in property values have seen overall payments rise.
Sales Tax
The sales tax in Bronx, NY is significantly higher than that in South Aurora, CO. Residents of Bronx face a combined sales tax of 8.875%, while residents of South Aurora are levied a combined sales tax of 4.75%.
Income
Type
Bronx
South Aurora
Estimated median household income
$43,011
$80,212
Estimated per capita income
$23,354
$39,129
Cost of living index (U.S. average is 100)
172.8
110.1
If you make $50,000 in South Aurora, you will have to make $78,474 in Bronx to maintain the same standard of living.
Geographical Conditions
Bronx is located in a metropolitan area with few natural attributes; the primary outdoor area is the Bronx Zoo. South Aurora is set in the scenic surroundings of CO and close to Rocky Mountain National Park—offering a multitude of outdoor activities for residents and tourists.
Geographical information
Type
Bronx
South Aurora
Land area
42 sq. miles
78.4 sq. miles
Population density
32,928 people per sq. mile
4,199.1 people per sq. mile
Relative area comparison
Bronx, NY South Aurora, CO
Education
Bronx, NY hosts a range of educational institutions, including elementary, high schools, and colleges. The educational opportunities are diverse and plentiful, but schools can be heavily populated. South Aurora schools often get higher rankings, but the choices can be limited, particularly for higher education.
The Bronx serves as a center for various industries like healthcare, retail, and education, with Manhattan's job market close by. However, the unemployment rate can be higher than national averages. South Aurora's economy is less diversified, primarily centered on healthcare, retail, and education, but with generally lower unemployment rates.
Biggest Employers
In the Bronx, some of the largest employers are the NYC Department of Education, Montefiore Medical Center, and Mount Sinai Health System. Contrastly, in South Aurora, top employers include the University of Colorado Hospital, Children’s Hospital Colorado and the Cherry Creek School District.
In Bronx (Bronx County), 91.9% voted for Democrats and 8.1% for Republicans in 2012 Presidential Election. In South Aurora (Arapahoe County), 54.4% voted for Democrats and 44.4% for Republicans.
Elections
Type
Democrats
Republicans
Other
Year
Bronx
South Aurora
Bronx
South Aurora
Bronx
South Aurora
2020
83.7%
61.3%
16.0%
36.6%
0.3%
2.1%
2016
88.6%
53.1%
9.5%
38.9%
2.0%
8.1%
2012
91.9%
54.4%
8.1%
44.4%
0.0%
1.3%
2008
89.0%
56.0%
11.0%
43.0%
0.0%
1.0%
2004
82.9%
47.6%
16.5%
51.6%
0.6%
0.8%
2000
86.5%
43.6%
11.8%
51.6%
1.7%
4.8%
1996
85.8%
41.9%
10.5%
50.8%
3.7%
7.3%
Breakdown of population affiliated with a religious congregation
Type
Adherents
Congregations
Religion
Bronx
South Aurora
Bronx
South Aurora
CATHOLIC CHURCH
25.5%
12.1%
11.5%
4.3%
MUSLIM ESTIMATE
2.8%
1.9%
3.9%
1.0%
AMERICAN BAPTIST CHURCHES IN THE USA
0.7%
0.1%
4.4%
1.7%
SEVENTH DAY ADVENTIST CHURCH
0.7%
0.2%
6.5%
2.6%
EPISCOPAL CHURCH
0.4%
0.4%
3.7%
1.7%
EVANGELICAL LUTHERAN CHURCH IN AMERICA
0.2%
2.0%
2.6%
4.3%
SOUTHERN BAPTIST CONVENTION
0.2%
1.6%
2.4%
9.9%
LUTHERAN CHURCH
0.1%
1.0%
0.6%
2.6%
Weather
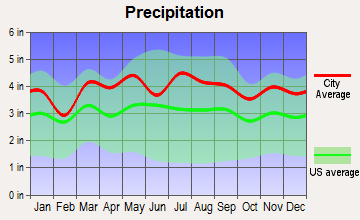
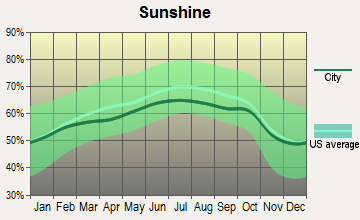
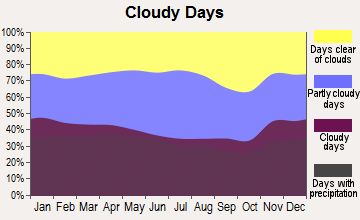
Bronx, NY experiences four seasons with humid summers and cold winters, along with a reasonably high amount of rainfall throughout the year. South Aurora, CO sees dramatic changes, with hot, dry summers, cold winters, and a lower annual rainfall. The area is also known for its 300 days of sunshine a year, which can be a draw for both residents and tourists.
Weather and climate
Type
Bronx
South Aurora
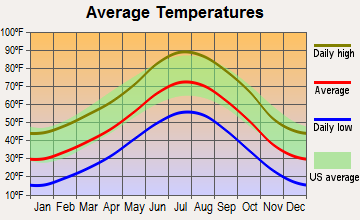
Temperature - Average
54.7°F
49.9°F
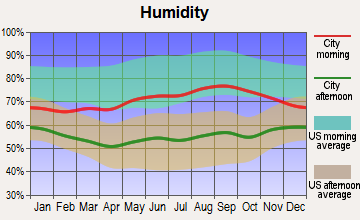
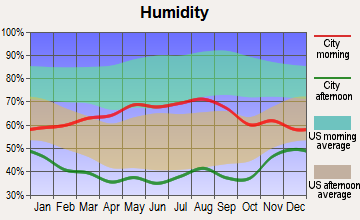
Humidity - Average morning or afternoon humidity
67.2%
50.6%
Humidity - Differences between morning and afternoon humidity
26.4%
20%
Humidity - Maximum monthly morning or afternoon humidity
75.6%
55%
Humidity - Minimum monthly morning or afternoon humidity
49.2%
35%
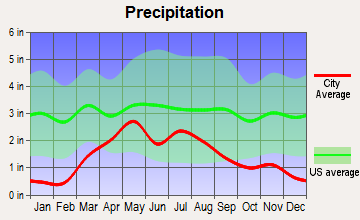
Precipitation - Yearly average
47 in
17.6 in
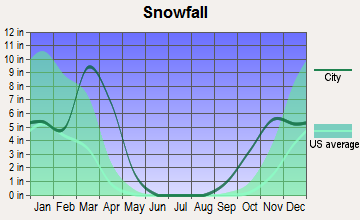
Snowfall - Yearly average
54.5 in
114 in
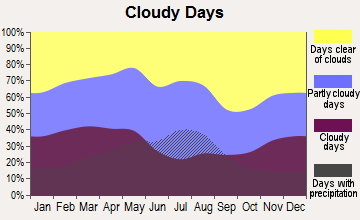
Clouds - Number of days clear of clouds
16.5%
19.2%
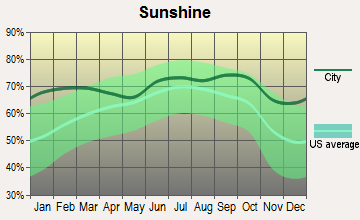
Sunshine amount - Average
60.2%
75.6%
Sunshine amount - Differences during a year
20%
10%
Sunshine amount - Maximum monthly
64%
74%
Sunshine amount - Minimum monthly
44%
64%
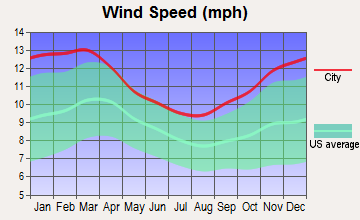
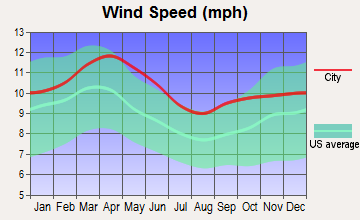
Wind speed - Average
10.7 mph
8.6 mph
Average climate in Bronx, New York
Average climate in South Aurora, Colorado
Air pollution
Type
AQI
CO
NO2
OZONE
PB
PM10
PM25
SO2
Year
Bronx
South Aurora
Bronx
South Aurora
Bronx
South Aurora
Bronx
South Aurora
Bronx
South Aurora
Bronx
South Aurora
Bronx
South Aurora
Bronx
South Aurora
2018
102
99
0.31
0.37
15.8
21.6
24.4
31.9
N/A
N/A
N/A
29.2
7.4
8.5
0.6
0.7
2017
100
95
0.04
0.37
15.7
22.0
24.6
31.8
N/A
N/A
N/A
22.0
7.0
8.4
0.6
0.9
2016
98
90
0.30
0.43
16.4
24.0
24.6
31.3
N/A
N/A
N/A
22.6
7.2
8.1
0.8
1.0
2015
105
101
0.28
0.44
18.0
23.0
23.6
30.2
N/A
N/A
N/A
20.6
8.6
9.6
1.4
1.1
2014
99
94
0.32
0.43
18.0
22.0
23.6
30.3
N/A
N/A
N/A
22.7
8.4
10.1
1.7
1.3
2013
103
84
0.39
0.39
18.9
19.7
23.5
30.7
N/A
N/A
N/A
22.0
9.3
N/A
2.1
1.4
2012
104
90
0.44
0.34
18.8
18.9
23.9
31.4
N/A
N/A
N/A
24.3
9.7
N/A
3.1
1.2
2011
113
91
0.46
0.34
20.9
18.1
22.1
31.5
N/A
N/A
N/A
23.8
11.6
N/A
4.5
1.5
2010
113
81
0.53
0.41
20.2
16.3
23.7
29.3
N/A
N/A
N/A
26.6
10.8
N/A
4.7
1.0
2009
107
79
0.53
0.37
22.3
14.1
19.5
27.3
N/A
0.005
N/A
22.6
10.8
N/A
5.4
1.3
2008
114
85
0.53
0.41
23.3
17.3
19.9
29.1
0.013
0.008
N/A
25.5
12.1
N/A
5.9
1.6
2007
122
96
0.60
0.41
24.6
20.6
19.1
25.7
0.016
0.007
N/A
28.9
13.2
N/A
7.0
1.2
2006
120
89
0.50
0.50
25.0
19.0
18.9
25.4
0.018
0.026
N/A
28.0
12.8
N/A
7.0
1.4
2005
115
86
0.60
0.57
27.0
21.3
17.8
22.7
N/A
0.106
N/A
29.6
N/A
N/A
9.3
1.5
2004
109
82
0.62
0.61
25.6
21.2
16.7
21.6
0.030
0.035
N/A
28.6
N/A
N/A
8.8
1.8
2003
110
106
0.75
0.61
27.4
21.2
17.1
23.4
0.022
0.038
26.9
32.6
N/A
N/A
8.9
1.9
2002
124
86
0.67
0.64
27.9
19.2
17.4
23.0
0.008
0.027
25.0
35.7
N/A
N/A
8.6
2.5
2001
126
95
0.66
0.79
30.0
23.8
17.8
20.8
0.020
0.029
22.8
32.6
N/A
N/A
10.0
2.6
2000
115
93
0.68
0.77
29.4
13.7
16.0
21.7
0.022
0.032
22.2
12.2
N/A
N/A
10.2
2.1
Natural disasters
Type
Bronx
South Aurora
Tornado activity compared to U.S. average
58.3%
137.7%
Earthquake activity compared to U.S. average
31%
797.1%
Natural disasters compared to U.S. average
14%
10%
Transportation
Public transit is abundant in the Bronx with subways, buses, and taxis operating at all hours, making commuting easier. South Aurora, however, is more car-dependent with limited public transit options, meaning individuals may need to own a vehicle for convenient mobility.
Transport
Type
Bronx
South Aurora
Amtrak stations nearby
3
2
FAA registered aircraft
39
0
Means of transportation to work
Type
Bronx
South Aurora
Bicycle
0.2%
0.2%
Bus
15.6%
3.5%
Carpooled
9.3%
12%
Car alone
27%
78.6%
Railroad
2%
0%
Streetcar
0.2%
0%
Subway
34.6%
0%
Taxicab
1.3%
0.1%
Walked
7.2%
1.3%
Average travel time to work
Type
Bronx
South Aurora
Average
44.2 min
27.5 min
Real Estate
Real estate in the Bronx is characterized by high prices and limited availability due to its urban location. South Aurora has a more affordable real estate market with diverse housing options, though its prices have been growing steadily over the years.
Neighborhoods
The Bronx is filled with diverse neighborhoods each reflecting a different culture and lifestyle. South Aurora is dotted with quiet, family-friendly neighborhoods with well-kept lawns and community amenities. Both offer a range of lifestyles to suit different tastes and preferences, though in very different settings.
Houses and residents
Type
Bronx
South Aurora
Houses
490,659
119,373
Average household size (people)
2.8
2.6
Houses occupied
463,212 (94.4%)
115,977 (97.2%)
Houses occupied by owners
90,522 (19.5%)
76,163 (65.7%)
Houses occupied by renters
372,690 (80.5%)
39,814 (34.3%)
Median rent asked for vacant for-rent units
$1,273
$1,519
Median price asked for vacant for-sale houses and condos
$708,992
$836,561
Estimated median house or condo value
$465,000
$439,151
Median number of rooms in apartments
3.7
3.9
Median number of rooms in houses and condos
5.1
7.2
Renting percentage
80.7%
38.4%
Housing density (houses/condos per square mile)
11,675
1,522.9
Household income disparities
50.2%
40.8%
Housing units without a mortgage
12,021 (34%)
6,903 (10.6%)
Housing units with both a second mortgage and home equity loan
105 (0.3%)
358 (0.6%)
Housing units with a mortgage
23,339 (66%)
57,942 (89.4%)
Housing units with a home equity loan
2,053 (5.8%)
5,373 (8.3%)
Housing units with a second mortgage
2,159 (6.1%)
10,116 (15.6%)
Housing units lacking complete kitchen facilities
1.4%
0.4%
Housing units lacking complete plumbing facilities
1.7%
0.4%
Housing units in structures
Housing units in structures
Bronx
South Aurora
One, detached
5.8%
52.4%
One, attached
5.4%
11.6%
Two
8.4%
0.6%
3 or 4
7.4%
3.5%
5 to 9
3.9%
6.9%
10 to 19
6.3%
10.6%
20 to 49
25.4%
5.9%
50 or more
37.2%
7.7%
Mobile homes
0.1%
0.7%
Median real estate property taxes paid for housing units
Self-employed workers in own not incorporated business
16,572
8,665
State government workers
14,515
4,200
Unpaid family workers
1,000
351
Industries and Occupations
The Bronx hosts diverse industries from health services, education, to retail trade. South Aurora has a less diverse economy dominated by healthcare and social assistance, retail trade, and professional, scientific, and technical services.
Health care in the Bronx is well-served with numerous renowned hospitals and clinics, providing access to a wide array of services. In contrast, South Aurora residents have access to high-quality healthcare but with fewer facilities compared to the Bronx.
Health (county statistics)
Type
Bronx
South Aurora
General health status score of residents in this county from 1 (poor) to 5 (excellent)
The metropolitan nature of the Bronx means it is densely populated and heavily built-up, with a wide range of public facilities. On the other hand, South Aurora has a more suburban infrastructure that leans towards providing comfort over mass utility but lacks the degree of public facility diversity that can be found in the Bronx.
Infrastructure
Type
Bronx
South Aurora
TV stations
30
14
Culture and Food
The Bronx is a cultural melting pot offering a diverse selection of cuisines from around the world. South Aurora has a more subdued but still varied food scene, with a mix of familiar chains, local eateries, and ethnic restaurants that reflects the city's growing diversity.
Sports Teams
Bronx is home to the iconic New York Yankees, making it a hive for baseball enthusiasts. South Aurora doesn't have its own sports teams, but residents passionately support Denver's professional teams, including the Denver Broncos (NFL), Colorado Rockies (MLB), and Colorado Avalanche (NHL).
 Bronx, NY
 South Aurora, CO