When comparing the lifestyle, cost, and amenities of Bronx, NY, to Upper San Gabriel Valley, CA, one finds several significant differences. These two regions vary in terms of cost of living, weather, educational opportunities, industries, crime rates, and cultural experiences. The Bronx presents a vibrant, fast-paced lifestyle typical of New York City, but it comes with a higher cost of living and crime rates. In contrast, Upper San Gabriel Valley offers milder weather, healthier industries, and an equally robust cultural scene. If you're interested in relocating or considering a visit, looking into each of these factors in detail can help you decide which suits your needs better.
Crime and safety are major concerns for both residents and tourists. The Bronx has historically struggled with crime but has seen improvements over the years. Nonetheless, it has higher crime rates compared to Upper San Gabriel Valley, particularly in aggravated assaults and robberies. On the other hand, Upper San Gabriel Valley generally boasts lower crime rates, providing a safer environment.
Cost of Living
The cost of living is significantly higher in the Bronx than in Upper San Gabriel Valley. This difference is especially noticeable regarding housing costs, with median home prices over twice as high in the Bronx. Additionally, everyday expenses such as groceries and transportation tend to cost more in the Bronx.
Income Tax
New York City residents face one of the highest income tax rates, ranging from 3.078% to 3.876%. In contrast, California has a progressive income tax structure that ranges from 1% to 13.3%, with the specific rate depending on one's income level.
Property Tax
The Bronx, located in New York City, has an average property tax rate of 0.90%. On the other hand, the average property tax rate in Los Angeles County, which encapsulates Upper San Gabriel Valley, is slightly lower at 0.72%.
Sales Tax
New York State levies a 4% sales tax, with the Bronx adding an additional 4.875%, making 8.875% in total. California imposes a state sales tax of 7.25%, while Upper San Gabriel Valley adds between 0.5% to 1% depending on the specific location, resulting in a total sales tax of 7.75% to 8.25%.
Income
Type
Bronx
Upper San Gabriel Valley
Estimated median household income
$43,011
$80,436
Estimated per capita income
$23,354
$33,562
Cost of living index (U.S. average is 100)
172.8
159.5
If you make $50,000 in Upper San Gabriel Valley, you will have to make $54,169 in Bronx to maintain the same standard of living.
Geographical Conditions
The Bronx is flat but has numerous parks and green spaces, including the famous Bronx Zoo. Upper San Gabriel Valley is more suburban, featuring rolling hills and scenic views, including the Angeles National Forest and San Gabriel Mountains.
Geographical information
Type
Bronx
Upper San Gabriel Valley
Land area
42 sq. miles
49.4 sq. miles
Population density
32,928 people per sq. mile
6,624.2 people per sq. mile
Relative area comparison
Bronx, NY Upper San Gabriel Valley, CA
Education
In terms of education, both areas house reputable educational institutions. The Bronx has access to the renowned New York City public school system and several famous universities. Upper San Gabriel Valley, part of Los Angeles County, offers high-quality public schools and proximity to renowned universities such as Caltech and the Claremont Colleges.
The Bronx boasts a diverse economy, with sectors like healthcare, education, and retail being key employers. However, the unemployment rate is slightly higher here compared to Upper San Gabriel Valley. Upper San Gabriel Valley has a robust economy led by industries like healthcare, tech, and entertainment, which offer ample job opportunities.
Biggest Employers
In the Bronx, the biggest employers are the NYC Department of Education, Montefiore Medical Center, and the City of New York. In contrast, Upper San Gabriel Valley's biggest employers include Huntington Hospital, City of Hope, and the Pasadena Unified School District.
In Bronx (Bronx County), 91.9% voted for Democrats and 8.1% for Republicans in 2012 Presidential Election. In Upper San Gabriel Valley (Los Angeles County), 69.7% voted for Democrats and 27.8% for Republicans.
Elections
Type
Democrats
Republicans
Other
Year
Bronx
Upper San Gabriel Valley
Bronx
Upper San Gabriel Valley
Bronx
Upper San Gabriel Valley
2020
83.7%
71.0%
16.0%
26.9%
0.3%
2.1%
2016
88.6%
72.0%
9.5%
22.5%
2.0%
5.5%
2012
91.9%
69.7%
8.1%
27.8%
0.0%
2.4%
2008
89.0%
69.2%
11.0%
28.8%
0.0%
1.9%
2004
82.9%
63.3%
16.5%
35.7%
0.6%
1.0%
2000
86.5%
63.6%
11.8%
32.4%
1.7%
4.0%
1996
85.8%
59.3%
10.5%
31.0%
3.7%
9.7%
Breakdown of population affiliated with a religious congregation
Type
Adherents
Congregations
Religion
Bronx
Upper San Gabriel Valley
Bronx
Upper San Gabriel Valley
CATHOLIC CHURCH
25.5%
36.1%
11.5%
4.7%
MUSLIM ESTIMATE
2.8%
0.7%
3.9%
1.0%
AMERICAN BAPTIST CHURCHES IN THE USA
0.7%
0.5%
4.4%
3.1%
SEVENTH DAY ADVENTIST CHURCH
0.7%
0.5%
6.5%
2.4%
EPISCOPAL CHURCH
0.4%
0.4%
3.7%
1.4%
SOUTHERN BAPTIST CONVENTION
0.2%
1.0%
2.4%
9.0%
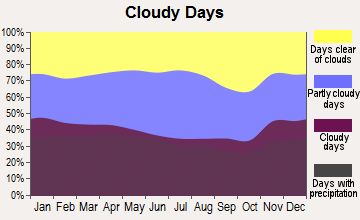
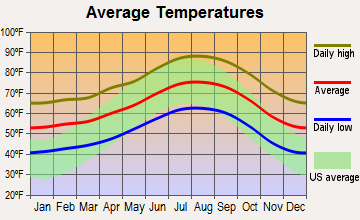
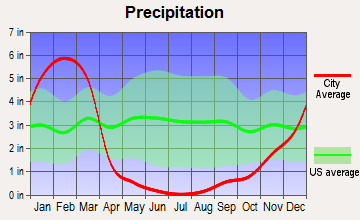
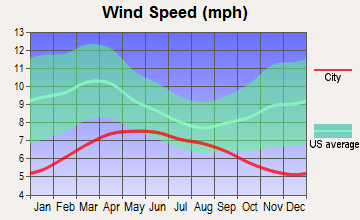
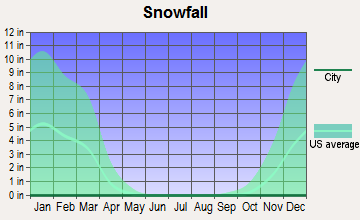
Weather
The weather between the two places is considerably different. The Bronx, NY, experiences a humid subtropical climate with hot summers and cold winters. Extreme weather events like snowstorms are not uncommon. Conversely, Upper San Gabriel Valley enjoys a Mediterranean climate characterized by warm, dry summers, and mild, wet winters, which many find more comfortable.
Weather and climate
Type
Bronx
Upper San Gabriel Valley
Temperature - Average
54.7°F
63.5°F
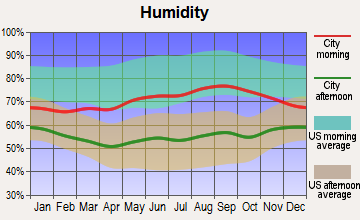
Humidity - Average morning or afternoon humidity
67.2%
62.2%
Humidity - Differences between morning and afternoon humidity
26.4%
17.3%
Humidity - Maximum monthly morning or afternoon humidity
75.6%
67%
Humidity - Minimum monthly morning or afternoon humidity
49.2%
49.7%
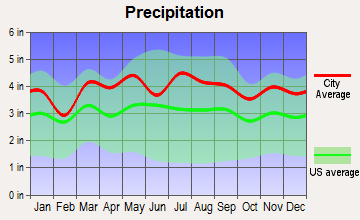
Precipitation - Yearly average
47 in
24.3 in
Snowfall - Yearly average
54.5 in
0 in
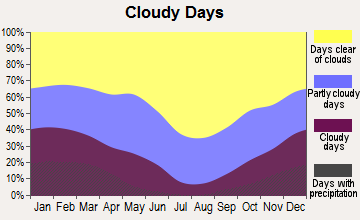
Clouds - Number of days clear of clouds
16.5%
29.4%
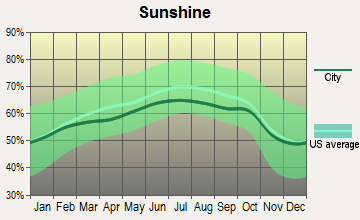
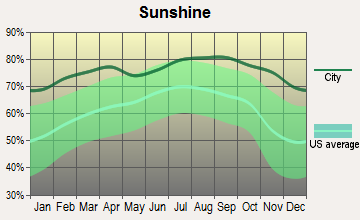
Sunshine amount - Average
60.2%
78.4%
Sunshine amount - Differences during a year
20%
22%
Sunshine amount - Maximum monthly
64%
85%
Sunshine amount - Minimum monthly
44%
63%
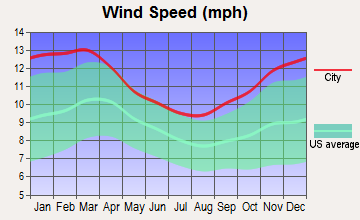
Wind speed - Average
10.7 mph
2.6 mph
Average climate in Bronx, New York
Average climate in Upper San Gabriel Valley, California
Air pollution
Type
AQI
CO
NO2
OZONE
PB
PM10
PM25
SO2
Year
Bronx
Upper San Gabriel Valley
Bronx
Upper San Gabriel Valley
Bronx
Upper San Gabriel Valley
Bronx
Upper San Gabriel Valley
Bronx
Upper San Gabriel Valley
Bronx
Upper San Gabriel Valley
Bronx
Upper San Gabriel Valley
Bronx
Upper San Gabriel Valley
2018
102
142
0.31
0.37
15.8
14.2
24.4
28.5
N/A
0.007
N/A
28.5
7.4
14.1
0.6
0.4
2017
100
146
0.04
0.36
15.7
15.1
24.6
29.8
N/A
0.007
N/A
31.2
7.0
14.0
0.6
0.5
2016
98
136
0.30
0.33
16.4
15.5
24.6
28.1
N/A
0.007
N/A
28.6
7.2
13.0
0.8
0.4
2015
105
143
0.28
0.33
18.0
15.2
23.6
28.4
N/A
0.007
N/A
28.4
8.6
15.2
1.4
0.3
2014
99
141
0.32
0.35
18.0
16.7
23.6
28.0
N/A
0.007
N/A
31.3
8.4
14.9
1.7
0.5
2013
103
144
0.39
0.39
18.9
17.3
23.5
26.6
N/A
0.007
N/A
29.3
9.3
14.4
2.1
0.4
2012
104
148
0.44
0.43
18.8
18.2
23.9
25.9
N/A
0.006
N/A
28.7
9.7
16.5
3.1
0.5
2011
113
146
0.46
0.47
20.9
19.1
22.1
24.8
N/A
0.008
N/A
28.9
11.6
17.6
4.5
0.5
2010
113
133
0.53
0.48
20.2
19.2
23.7
24.6
N/A
0.011
N/A
27.0
10.8
15.5
4.7
0.5
2009
107
153
0.53
0.39
22.3
21.0
19.5
25.4
N/A
0.011
N/A
32.0
10.8
17.2
5.4
0.4
2008
114
155
0.53
0.54
23.3
23.1
19.9
24.9
0.013
0.013
N/A
32.1
12.1
16.9
5.9
0.6
2007
122
135
0.60
0.55
24.6
24.6
19.1
23.1
0.016
0.016
N/A
N/A
13.2
N/A
7.0
1.0
2006
120
128
0.50
0.58
25.0
24.9
18.9
22.8
0.018
0.009
N/A
N/A
12.8
N/A
7.0
1.5
2005
115
128
0.60
0.61
27.0
25.4
17.8
21.3
N/A
0.015
N/A
N/A
N/A
N/A
9.3
1.7
2004
109
134
0.62
0.71
25.6
26.0
16.7
23.8
0.030
0.018
N/A
N/A
N/A
N/A
8.8
2.4
2003
110
143
0.75
0.89
27.4
30.7
17.1
23.3
0.022
0.025
26.9
N/A
N/A
N/A
8.9
1.6
2002
124
137
0.67
0.91
27.9
32.5
17.4
21.9
0.008
0.022
25.0
N/A
N/A
N/A
8.6
2.2
2001
126
143
0.66
1.04
30.0
33.1
17.8
20.1
0.020
0.031
22.8
N/A
N/A
N/A
10.0
2.3
2000
115
151
0.68
1.07
29.4
33.5
16.0
20.1
0.022
0.028
22.2
N/A
N/A
N/A
10.2
1.3
Natural disasters
Type
Bronx
Upper San Gabriel Valley
Tornado activity compared to U.S. average
58.3%
18%
Earthquake activity compared to U.S. average
31%
7,264.5%
Natural disasters compared to U.S. average
14%
57%
Transportation
New York City, including the Bronx, is known for its extensive public transportation system, making commuting effortlessly. Upper San Gabriel Valley also offers public transit options, including buses and light-rail services, but car is the preferred method of transportation in California due to larger distances.
Transport
Type
Bronx
Upper San Gabriel Valley
Amtrak stations nearby
3
3
FAA registered aircraft
39
0
Means of transportation to work
Type
Bronx
Upper San Gabriel Valley
Bicycle
0.2%
1.1%
Bus
15.6%
3.9%
Carpooled
9.3%
16.6%
Car alone
27%
71.1%
Motorcycle
0%
0.1%
Railroad
2%
0.1%
Streetcar
0.2%
0.1%
Subway
34.6%
0%
Taxicab
1.3%
0.1%
Walked
7.2%
3.2%
Average travel time to work
Type
Bronx
Upper San Gabriel Valley
Average
44.2 min
29.1 min
Real Estate
Real estate prices are significantly higher in the Bronx compared to Upper San Gabriel Valley. However, due to high demand, properties in the Bronx can potentially offer a higher return on investment for property owners.
Neighborhoods
The Bronx offers diverse neighborhoods, each with its unique culture, from the artistic hub of South Bronx to upscale Riverdale. Upper San Gabriel Valley boasts diverse, family-friendly neighborhoods too, like Walnut and San Marino, known for their high-quality public schools.
Houses and residents
Type
Bronx
Upper San Gabriel Valley
Houses
490,659
99,295
Average household size (people)
2.8
3.3
Houses occupied
463,212 (94.4%)
96,186 (96.9%)
Houses occupied by owners
90,522 (19.5%)
52,398 (54.5%)
Houses occupied by renters
372,690 (80.5%)
43,788 (45.5%)
Median rent asked for vacant for-rent units
$1,273
$1,771
Median price asked for vacant for-sale houses and condos
$708,992
$1,138,428
Estimated median house or condo value
$465,000
$740,686
Median number of rooms in apartments
3.7
3.7
Median number of rooms in houses and condos
5.1
5.9
Renting percentage
80.7%
44.9%
Housing density (houses/condos per square mile)
11,675
2,008.8
Household income disparities
50.2%
44%
Housing units without a mortgage
12,021 (34%)
11,525 (24.8%)
Housing units with both a second mortgage and home equity loan
105 (0.3%)
137 (0.3%)
Housing units with a mortgage
23,339 (66%)
34,867 (75.2%)
Housing units with a home equity loan
2,053 (5.8%)
3,133 (6.8%)
Housing units with a second mortgage
2,159 (6.1%)
4,036 (8.7%)
Housing units lacking complete kitchen facilities
1.4%
1.5%
Housing units lacking complete plumbing facilities
1.7%
0.9%
Housing units in structures
Housing units in structures
Bronx
Upper San Gabriel Valley
One, detached
5.8%
61.5%
One, attached
5.4%
9.3%
Two
8.4%
2.0%
3 or 4
7.4%
4.2%
5 to 9
3.9%
5.7%
10 to 19
6.3%
5.5%
20 to 49
25.4%
5.5%
50 or more
37.2%
3.6%
Mobile homes
0.1%
2.6%
Boats, RVs, vans, etc.
0.0%
0.1%
Median real estate property taxes paid for housing units
Self-employed workers in own not incorporated business
16,572
10,209
State government workers
14,515
3,180
Unpaid family workers
1,000
401
Industries and Occupations
Healthcare and social services remain the leading industries in the Bronx, followed by retail trade. In Upper San Gabriel Valley, healthcare, tech, and education dominate the job market, providing a wider variety of professional opportunities.
Healthcare is commendable in both areas. The Bronx is home to quality healthcare providers like Montefiore Medical Center, while Upper San Gabriel Valley residents have access to award-winning hospitals like Huntington Hospital and City of Hope.
Health (county statistics)
Type
Bronx
Upper San Gabriel Valley
General health status score of residents in this county from 1 (poor) to 5 (excellent)
New York City's aging infrastructure extends to the Bronx, with some areas showing signs of wear and tear. Conversely, Upper San Gabriel Valley's infrastructure is generally well-maintained and continually updated due to California's recent economic growth.
Infrastructure
Type
Bronx
Upper San Gabriel Valley
TV stations
30
27
Culture and Food
Both locales offer rich cultural experiences. The Bronx, with its broad diversity, provides various ethnic cuisines, alongside a vibrant music and art scene. Upper San Gabriel Valley also boasts a diverse food scene, with emphasis on Asian and Mexican cuisines, alongside a strong community scene marked by various festivals and events throughout the year.
Sports Teams
For sports enthusiasts, the Bronx is home to the world-renowned New York Yankees. Meanwhile, Upper San Gabriel Valley doesn't have its own sports teams, but nearby Los Angeles is home to the Lakers (NBA), Dodgers (MLB), and Rams (NFL).
 Bronx, NY
 Upper San Gabriel Valley, CA