


Relative area comparison
 Brooklyn, NY
 Denver, CO
Brooklyn and Denver, two vastly different cities, each with their own distinct identities. Brooklyn, a vibrant borough of New York City, is known for its rich culture, diverse neighborhoods, and bustling economy. On the other hand, Denver, the Mile High City of the West, lures lovers of outdoor activities against the backdrop of stunning natural beauty. Let's compare these two cities in different aspects to understand the living standards, economic situation, and overall environment.

 | Cities That Are Sports Capitals in the US (413 replies) |
| Cities that are Perceived as Larger or Smaller than they are (262 replies) |
| Which cities have grown or faded in relevance the most throughout your lifetime? (440 replies) |
| Top 10 most urban contiguous 50 sq miles (681 replies) |
| Skyline Game (1986 replies) |
| Walk Score Top 25 City Ranking for American Cities (68 replies) |
Brooklyn, NY and
Denver, CO : 1,629.6 miles
Brooklyn's population is larger by 257%. The population of Denver has grown by 156,827 people (28.3%) during that time.
| Population | ||
| Type | Brooklyn | Denver |
|---|---|---|
| Population | 2,538,705 | 711,463 |
| Female / male percentage | 53.1% / 46.9%
|
49.6% / 50.4%
|
Brooklyn has seen improvements in crime rates over the past decades, but still has pockets of high crime, particularly in certain neighborhoods. The crime rate is generally higher than in Denver, where the crime rate is close to the national average. However, crime distribution varies in different Denver neighborhoods. Visitors and residents alike are encouraged to stay vigilant and maintain personal safety precautions.
The cost of living in Brooklyn is significantly higher than Denver. Everything from housing, groceries, healthcare, and taxes are higher. Denver is more affordable, albeit more expensive than other mid-sized U.S cities, but it gives good value for money considering the median income and quality of life.
New York has one of the highest income tax rates in the U.S, affecting Brooklynites as well. Colorado has a comparatively lower flat income tax rate, meaning all taxpayers pay the same percentage regardless of income.
While New York State’s average property tax rate is lower than Colorado's, Brooklyn residents typically pay more due to the high market values of homes. Denver residents will generally pay less in property taxes.
The combined city and state sales tax in Brooklyn is considerably high, at around 8.875%. Denver has a lower sales tax rate, with a combined city and state tax of approximately 7.72%.
| Income | ||
| Type | Brooklyn | Denver |
|---|---|---|
| Estimated median household income | $67,567 | $81,630 |
| Estimated per capita income | $39,536 | $52,690 |
| Cost of living index (U.S. average is 100) | 185.4 | 111.3 |
If you make $50,000 in Denver, you will have to make $83,288 in Brooklyn to maintain the same standard of living.
Brooklyn offers urban lifestyle interspersed with parks, near the Atlantic coast and East River. Denver offers a completely different environment, located a mile above sea level, foothills of the Rocky Mountains, providing easy access to outdoor activities like hiking, skiing, and mountain biking.
| Geographical information | ||
| Type | Brooklyn | Denver |
|---|---|---|
| Land area | 70.6 sq. miles | 153.4 sq. miles |
| Population density | 35,956 people per sq. mile | 4,639.5 people per sq. mile |
Brooklyn, NY
Denver, CO
Both cities are served by decent educational institutions. Brooklyn, being a part of New York City, has a diverse range of top-rated public and private schools, as well as world-renowned universities such as Columbia University and New York University. Denver also has its share of good public and private schools and is home to the reputable University of Denver and Metropolitan State University of Denver.
| Education level (25-year-olds and older) | ||
| Type | Brooklyn | Denver |
|---|---|---|
| Bachelor's degree or higher | 21.8% | 55% |
| Graduate or professional degree | 8.8% | 22.1% |
| High school or higher | 68.8% | 90.9% |
New York's robust economy provides a wide array of job opportunities in finance, media, fashion, tech, and more. Denver's economy is also strong, with growth in tech, healthcare, and aerospace. The unemployment rate is generally lower in Denver compared to Brooklyn. However, average salaries are higher in Brooklyn, albeit offset by a higher cost of living.
In Brooklyn, the biggest employers are the city and federal government, followed by JPMorgan Chase and the local health networks. Denver is home to several Fortune 500 companies, including Dish Network, Ball Corporation, and DaVita, with the public sector also being a significant employer.
In Brooklyn (Kings County), 82.1% voted for Democrats and 16.9% for Republicans in 2012 Presidential Election. In Denver (Denver County), 73.9% voted for Democrats and 24.3% for Republicans.
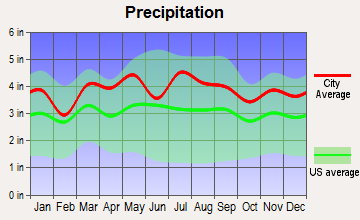
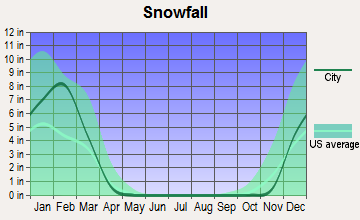
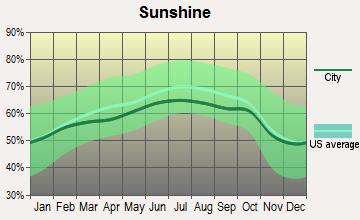
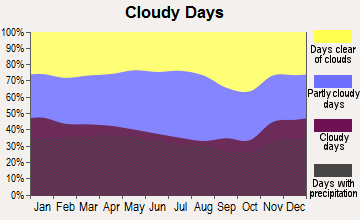
Brooklyn typically experiences a classic four-season climate, with hot, muggy summers and cold, sometimes harsh, winters. Alternatively, Denver's high-altitude location results in a semi-arid, four-season climate, with mild winters and warm, dry summers. Denver receives more sunshine but also experiences occasional snowstorms in the winter.
| Weather and climate | ||
| Type | Brooklyn | Denver |
|---|---|---|
| Temperature - Average | 55.1°F | 49.5°F |
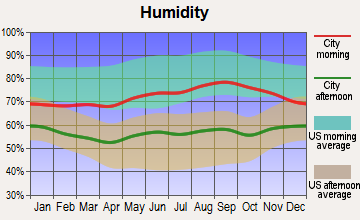
| Humidity - Average morning or afternoon humidity | 68.7% | 50.6% |
| Humidity - Differences between morning and afternoon humidity | 26.1% | 20% |
| Humidity - Maximum monthly morning or afternoon humidity | 76.8% | 55% |
| Humidity - Minimum monthly morning or afternoon humidity | 50.7% | 35% |
| Precipitation - Yearly average | 46.5 in | 17 in |
| Snowfall - Yearly average | 53.4 in | 114 in |
| Clouds - Number of days clear of clouds | 16.7% | 19.2% |
| Sunshine amount - Average | 60.2% | 75.6% |
| Sunshine amount - Differences during a year | 20% | 10% |
| Sunshine amount - Maximum monthly | 64% | 74% |
| Sunshine amount - Minimum monthly | 44% | 64% |
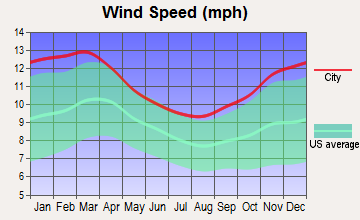
| Wind speed - Average | 10.6 mph | 8.6 mph |
| Natural disasters | ||
| Type | Brooklyn | Denver |
|---|---|---|
| Tornado activity compared to U.S. average | 56.4% | 129.5% |
| Earthquake activity compared to U.S. average | 30.8% | 811.7% |
| Natural disasters compared to U.S. average | 17% | 10% |
Brooklyn's public transportation system includes subways and buses that connect all parts of the borough, with cycling becoming increasingly popular. Denver also has a good network of buses and light rail, and given its outdoor culture, bicycling is also very popular. Traffic can be a problem in both cities, particularly during peak hours.
| Transport | ||
| Type | Brooklyn | Denver |
|---|---|---|
| Amtrak stations | 0 | 2 |
| Amtrak stations nearby | 3 | 2 |
| FAA registered aircraft | 149 | 602 |
| FAA registered aircraft manufacturers and dealers | 2 | 28 |
| Means of transportation to work | ||
| Type | Brooklyn | Denver |
|---|---|---|
| Bicycle | 0.5% | 1.5% |
| Bus | 10.4% | 2.6% |
| Carpooled | 8% | 8.8% |
| Car alone | 22.4% | 81.1% |
| Railroad | 1.4% | 1.2% |
| Streetcar | 0.2% | 0.2% |
| Subway | 44.8% | 0.1% |
| Taxicab | 0.7% | 0.1% |
| Walked | 8.8% | 2.8% |
| Average travel time to work | ||
| Type | Brooklyn | Denver |
|---|---|---|
| Average | 44.5 min | 29.4 min |
Brooklyn real estate is notoriously expensive, with high demand driving up prices for both rentals and homes for sale. Denver's real estate market is also competitive but more affordable, with high rental and home prices driven by strong demand and limited supply.
Brooklyn has diverse neighborhoods ranging from the hipster appeal of Williamsburg to the family-friendly Park Slope. Denver's neighborhoods also have their uniqueness, from the bustling, historic Lower Downtown (LoDo) to the hip Highlands.
| Houses and residents | ||
| Type | Brooklyn | Denver |
|---|---|---|
| Houses | 930,866 | 351,829 |
| Average household size (people) | 2.7 | 2.2 |
| Houses occupied | 880,727 (94.6%) | 326,634 (92.8%) |
| Houses occupied by owners | 238,290 (27.1%) | 164,429 (50.3%) |
| Houses occupied by renters | 642,437 (72.9%) | 162,205 (49.7%) |
| Median rent asked for vacant for-rent units | $1,589 | $1,674 |
| Median price asked for vacant for-sale houses and condos | $1,621,117 | $970,375 |
| Estimated median house or condo value | $793,300 | $541,500 |
| Median number of rooms in apartments | 3.6 | 3.5 |
| Median number of rooms in houses and condos | 5.2 | 6.4 |
| Renting percentage | 72.3% | 50% |
| Housing density (houses/condos per square mile) | 13,184 | 2,294.3 |
| Household income disparities | 48.5% | 44% |
| Housing units without a mortgage | 29,251 (32.9%) | 2,112 (1.7%) |
| Housing units with both a second mortgage and home equity loan | 183 (0.2%) | 9,615 (7.6%) |
| Housing units with a mortgage | 59,793 (67.1%) | 123,690 (98.3%) |
| Housing units with a home equity loan | 4,512 (5.1%) | 273 (0.2%) |
| Housing units with a second mortgage | 5,098 (5.7%) | 12,819 (10.2%) |
| Housing units lacking complete kitchen facilities | 1.5% | 1.3% |
| Housing units lacking complete plumbing facilities | 1.7% | 0.8% |
The largest sectors in Brooklyn include healthcare and social assistance, retail trade, and education services, while in Denver, they are professional and technical services, healthcare, and retail trade. Tech and startup scene is growing in both cities, with Brooklyn taking advantage of its proximity to Manhattan and Denver attracting a younger, educated workforce.
Brooklyn residents have access to top-notch healthcare facilities with world-renowned hospitals like New York-Presbyterian and Mount Sinai. Denver also provides excellent healthcare with renowned hospitals like UCHealth University of Colorado Hospital and Porter Adventist Hospital.
| Health (county statistics) | ||
| Type | Brooklyn | Denver |
|---|---|---|
| General health status score of residents in this county from 1 (poor) to 5 (excellent) | 3.4 | 3.6 |
| Average weight of females (lbs) | 161.8 lbs | 156.3 lbs |
| Average weight of males (lbs) | 185.6 lbs | 190.9 lbs |
| Residents visited a dentist within the past year | 67.1% | 72.3% |
| Residents exercised in the past month | 69.9% | 79.1% |
| Adult residents drank alcohol in the past 30 days | 71.7% | 62.4% |
| Residents smoked 100+ cigarettes in their lives | 39.2% | 41.8% |
Brooklyn has mature infrastructure, with many historical and modern architecture, well-established public services, and robust transportation networks. Denver's infrastructure is smaller but well designed, with a concentration of development in downtown and planned urban development towards sustainable living and public transportation.
| Infrastructure | ||
| Type | Brooklyn | Denver |
|---|---|---|
| Hospitals | 104 | 16 |
| TV stations | 29 | 17 |
| Bank branches located here | 271 | 205 |
| Bank institutions located here | 41 | 43 |
| Main business address for public companies | 9 | 58 |
| Drinking water stations with no reported violations in the past | 12 | 8 |
| Drinking water stations with reported violations in the past | 75 | 36 |
Brooklyn is famous for its cultural diversity, giving rise to a food scene that reflects the flavors of the world. The borough is known for iconic foods like pizza and bagels. Denver's food scene is also growing impressively, with a focus on farm-to-table cuisine, craft beer, and unique specialties like the Denver Omelette. Both cities offer a vibrant, enjoyable culinary experience.
Brooklyn is home to the Brooklyn Nets (NBA) and the minor league baseball team, the Brooklyn Cyclones. Denver boasts several professional sports teams, including the Denver Broncos (NFL), the Colorado Rockies (MLB), the Denver Nuggets (NBA), and the Colorado Avalanche (NHL).