Brooklyn and East Seattle are two diverse and vibrant parts of the United States. Brooklyn, NY, is one of the five boroughs of New York City, known for its cultural diversity, dynamic arts scene, and bustling city life. East Seattle, WA, on the other hand, offers a more relaxed atmosphere with stunning landscapes and a thriving tech industry. The following comparison covers several factors such as crime/safety, weather, cost of living, and more, to provide an extensive understanding of what living or visiting these two places would be like.
Brooklyn has an improved safety situation compared to previous years, with significant decreases in crime rates, although certain neighborhoods still experience periodic crime. East Seattle is generally safer but also has crime in specific areas. As with any city facility, taking personal safety precautions is a must.
Cost of Living
Generally speaking, Brooklyn is more expensive than East Seattle. This is particularly noticeable when it comes to housing prices. However, Seattle's robust tech industry and high wages can offset this difference.
Income Tax
New York City has an additional city income tax on top of the state tax, ranging from 3.078% to 3.876%. Washington state, and therefore East Seattle, does not impose any state or city income tax.
Property Tax
Property taxes in New York City, including Brooklyn, are usually lower than the national average. Conversely, property taxes in East Seattle can be significantly higher, driven by the high property values in the Seattle area.
Sales Tax
New York City's combined city and state sales tax rate is 8.875%, while Washington state's base sales tax rate is 6.5%. However, with local taxes, the total can be as much as 10.4% in parts of King County, including East Seattle.
Income
Type
Brooklyn
East Seattle
Estimated median household income
$67,567
$135,835
Estimated per capita income
$39,536
$77,151
Cost of living index (U.S. average is 100)
185.4
128.6
If you make $50,000 in East Seattle, you will have to make $72,084 in Brooklyn to maintain the same standard of living.
Geographical Conditions
Brooklyn is mostly flat and lies on the western end of Long Island. East Seattle, on the other hand, is hilly with numerous bodies of water and offers jaw-dropping views of the Cascade and Olympic mountains.
Geographical information
Type
Brooklyn
East Seattle
Land area
70.6 sq. miles
217.1 sq. miles
Population density
35,956 people per sq. mile
2,361.6 people per sq. mile
Relative area comparison
Brooklyn, NY East Seattle, WA
Education
Both Brooklyn and East Seattle have a wide selection of educational institutions. Brooklyn is home to various universities and colleges like Brooklyn College, and East Seattle has several noteworthy schools, including the University of Washington.
Brooklyn's economy is diverse, with sectors such as retail, healthcare, manufacturing, and creative arts. East Seattle benefits significantly from the presence of several tech giants like Microsoft and Amazon, driving a strong tech-based economy.
Biggest Employers
Major employers in Brooklyn include JP Morgan Chase and the local Government. In East Seattle, Microsoft and Amazon are the biggest employers, offering numerous high-income jobs.
In Brooklyn (Kings County), 82.1% voted for Democrats and 16.9% for Republicans in 2012 Presidential Election. In East Seattle (King County), 69.0% voted for Democrats and 28.5% for Republicans.
Elections
Type
Democrats
Republicans
Other
Year
Brooklyn
East Seattle
Brooklyn
East Seattle
Brooklyn
East Seattle
2020
76.9%
75.1%
22.2%
22.3%
1.0%
2.6%
2016
79.6%
70.0%
17.5%
21.1%
2.9%
8.9%
2012
82.1%
69.0%
16.9%
28.5%
0.9%
2.5%
2008
79.9%
70.2%
20.1%
28.1%
0.0%
1.7%
2004
75.0%
65.1%
24.3%
33.8%
0.7%
1.1%
2000
81.0%
60.3%
15.7%
34.5%
3.3%
5.2%
1996
80.1%
56.4%
15.1%
31.4%
4.9%
12.2%
Breakdown of population affiliated with a religious congregation
Type
Adherents
Congregations
Religion
Brooklyn
East Seattle
Brooklyn
East Seattle
CATHOLIC CHURCH
24.9%
14.4%
7.5%
4.9%
MUSLIM ESTIMATE
3.8%
0.6%
4.2%
1.4%
AMERICAN BAPTIST CHURCHES IN THE USA
1.9%
0.6%
3.8%
2.9%
SEVENTH DAY ADVENTIST CHURCH
1.0%
0.6%
5.2%
2.3%
EPISCOPAL CHURCH
0.7%
0.8%
2.3%
2.4%
EVANGELICAL LUTHERAN CHURCH IN AMERICA
0.2%
1.3%
2.0%
4.7%
SOUTHERN BAPTIST CONVENTION
0.2%
0.3%
2.4%
3.8%
LUTHERAN CHURCH
0.0%
0.5%
0.6%
2.0%
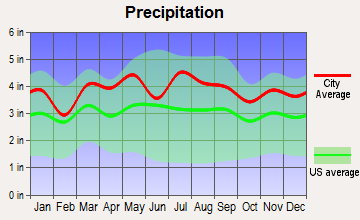
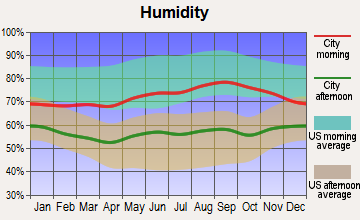
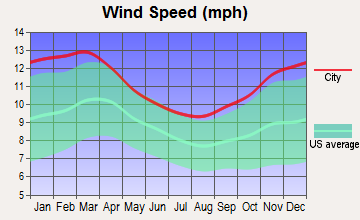
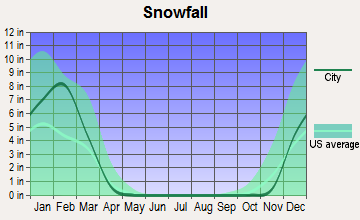
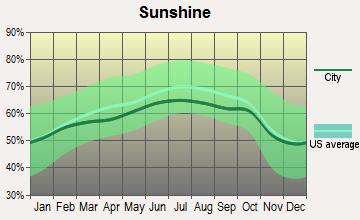
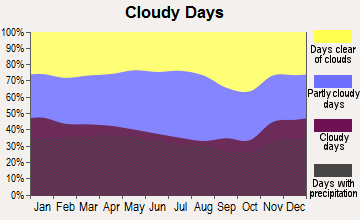
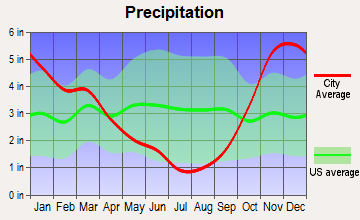
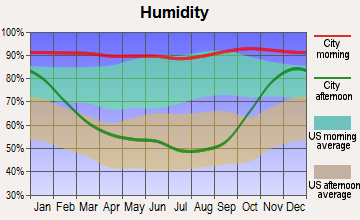
Weather
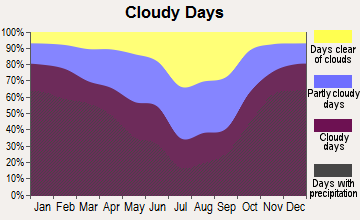
Brooklyn experiences a humid subtropical climate with hot, humid summers and cold, wet winters. East Seattle, on the other hand, has a mild, marine climate, with cool, wet winters and dry, warm summers. Despite the heavy rainfall, Seattle has fewer days with precipitation than many other US cities.
Weather and climate
Type
Brooklyn
East Seattle
Temperature - Average
55.1°F
52.5°F
Humidity - Average morning or afternoon humidity
68.7%
78.5%
Humidity - Differences between morning and afternoon humidity
26.1%
38%
Humidity - Maximum monthly morning or afternoon humidity
76.8%
86%
Humidity - Minimum monthly morning or afternoon humidity
50.7%
48%
Precipitation - Yearly average
46.5 in
36.8 in
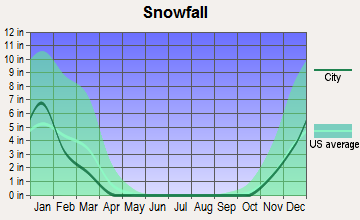
Snowfall - Yearly average
53.4 in
21.4 in
Clouds - Number of days clear of clouds
16.7%
11.7%
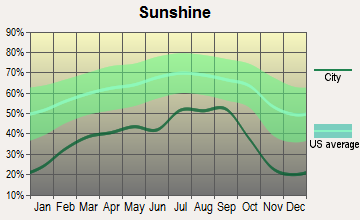
Sunshine amount - Average
60.2%
49.4%
Sunshine amount - Differences during a year
20%
44%
Sunshine amount - Maximum monthly
64%
64%
Sunshine amount - Minimum monthly
44%
20%
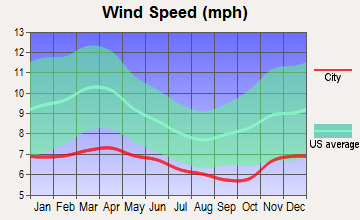
Wind speed - Average
10.6 mph
8.6 mph
Average climate in Brooklyn, New York
Average climate in East Seattle, Washington
Air pollution
Type
AQI
CO
NO2
OZONE
PB
PM10
PM25
SO2
Year
Brooklyn
East Seattle
Brooklyn
East Seattle
Brooklyn
East Seattle
Brooklyn
East Seattle
Brooklyn
East Seattle
Brooklyn
East Seattle
Brooklyn
East Seattle
Brooklyn
East Seattle
2018
93
85
0.31
0.21
16.8
10.6
24.2
21.0
N/A
N/A
N/A
N/A
7.0
5.1
0.4
0.7
2017
95
100
0.25
0.23
17.0
11.1
24.5
21.2
N/A
N/A
N/A
N/A
7.1
4.6
0.3
0.3
2016
93
67
0.31
0.22
17.7
11.9
24.8
20.2
N/A
N/A
N/A
N/A
7.2
3.8
0.5
0.6
2015
100
88
0.38
0.23
18.2
10.8
24.1
19.4
N/A
N/A
N/A
N/A
8.0
5.6
0.7
0.8
2014
95
75
0.38
0.24
18.5
11.5
23.5
19.5
N/A
N/A
N/A
N/A
7.8
5.7
0.9
N/A
2013
96
81
0.41
0.24
18.9
N/A
24.4
17.2
N/A
N/A
N/A
N/A
8.5
5.9
1.0
0.8
2012
98
83
0.44
0.23
18.3
N/A
24.4
19.3
N/A
N/A
N/A
N/A
9.2
5.2
1.6
1.0
2011
107
73
0.43
0.24
20.7
N/A
23.6
18.6
N/A
N/A
N/A
N/A
10.3
5.2
2.4
1.1
2010
112
73
0.43
0.24
19.4
N/A
24.7
18.0
N/A
N/A
N/A
N/A
10.0
4.4
2.3
1.1
2009
104
94
0.43
0.27
21.5
N/A
20.7
18.3
N/A
N/A
N/A
N/A
10.2
6.0
3.1
1.4
2008
109
80
0.47
0.30
22.6
N/A
21.3
17.8
0.013
N/A
N/A
N/A
11.8
5.4
4.1
1.3
2007
121
85
0.53
0.30
23.5
N/A
20.8
17.7
0.016
N/A
N/A
19.0
12.4
6.4
4.8
1.5
2006
116
102
0.61
N/A
24.2
N/A
20.7
18.4
0.018
N/A
N/A
21.1
13.0
7.2
5.7
N/A
2005
107
104
0.74
0.80
26.1
18.3
19.6
N/A
N/A
N/A
N/A
22.9
N/A
7.6
7.5
3.5
2004
106
110
0.74
0.81
25.8
17.9
18.5
N/A
0.030
N/A
N/A
N/A
N/A
8.3
7.1
3.0
2003
107
100
0.81
0.85
27.4
18.5
18.4
N/A
0.021
N/A
26.9
N/A
N/A
8.3
7.4
2.4
2002
122
90
0.76
1.07
27.9
19.3
19.9
N/A
0.008
N/A
26.2
N/A
N/A
10.7
6.5
2.7
2001
121
91
0.80
1.08
29.5
20.5
22.3
N/A
0.020
0.004
27.3
N/A
N/A
11.1
7.8
3.7
2000
115
99
0.92
1.21
29.8
20.9
20.3
N/A
0.022
N/A
22.2
N/A
N/A
12.1
7.4
3.2
Natural disasters
Type
Brooklyn
East Seattle
Tornado activity compared to U.S. average
56.4%
5.5%
Earthquake activity compared to U.S. average
30.8%
1,403%
Natural disasters compared to U.S. average
17%
30%
Transportation
Both cities offer extensive public transportation. Brooklyn's transit system is part of the larger NYC network, and East Seattle has an efficient network including buses, light rail, and ferries.
Transport
Type
Brooklyn
East Seattle
Amtrak stations nearby
3
3
FAA registered aircraft
149
0
FAA registered aircraft manufacturers and dealers
2
0
Means of transportation to work
Type
Brooklyn
East Seattle
Bicycle
0.5%
0.3%
Bus
10.4%
5%
Carpooled
8%
11%
Car alone
22.4%
76.3%
Motorcycle
0%
0.1%
Railroad
1.4%
0%
Streetcar
0.2%
0%
Subway
44.8%
0%
Taxicab
0.7%
0%
Walked
8.8%
1.7%
Average travel time to work
Type
Brooklyn
East Seattle
Average
44.5 min
25 min
Real Estate
The real estate market in Brooklyn is highly competitive with high property values. Conversely, East Seattle offers a more affordable housing market, although prices are rising.
Neighborhoods
Brooklyn is renowned for its vibrant neighborhoods like Williamsburg, DUMBO, and Park Slope, each with unique cultures and aesthetics. East Seattle is composed of residential neighborhoods with picturesque houses and scenic surroundings.
Houses and residents
Type
Brooklyn
East Seattle
Houses
930,866
199,933
Average household size (people)
2.7
2.5
Houses occupied
880,727 (94.6%)
191,630 (95.8%)
Houses occupied by owners
238,290 (27.1%)
128,209 (66.9%)
Houses occupied by renters
642,437 (72.9%)
63,421 (33.1%)
Median rent asked for vacant for-rent units
$1,589
$2,281
Median price asked for vacant for-sale houses and condos
$1,621,117
$820,468
Estimated median house or condo value
$793,300
$877,325
Median number of rooms in apartments
3.6
3.5
Median number of rooms in houses and condos
5.2
7.8
Housing density (houses/condos per square mile)
13,184
920.9
Household income disparities
48.5%
34.9%
Housing units without a mortgage
29,251 (32.9%)
22,582 (20.8%)
Housing units with both a second mortgage and home equity loan
183 (0.2%)
352 (0.3%)
Housing units with a mortgage
59,793 (67.1%)
85,751 (79.2%)
Housing units with a home equity loan
4,512 (5.1%)
11,674 (10.8%)
Housing units with a second mortgage
5,098 (5.7%)
9,796 (9%)
Housing units lacking complete kitchen facilities
1.5%
0.8%
Housing units lacking complete plumbing facilities
1.7%
0.3%
Housing units in structures
Housing units in structures
Brooklyn
East Seattle
One, detached
5.0%
60.2%
One, attached
8.7%
4.5%
Two
18.1%
1.0%
3 or 4
17.1%
3.8%
5 to 9
11.1%
7.4%
10 to 19
6.0%
7.6%
20 to 49
13.6%
5.8%
50 or more
20.3%
7.9%
Mobile homes
0.1%
1.8%
Boats, RVs, vans, etc.
0.0%
0.1%
Median real estate property taxes paid for housing units
Self-employed workers in own not incorporated business
45,971
16,907
State government workers
27,527
10,270
Unpaid family workers
2,234
584
Industries and Occupations
Healthcare, tech, education, retail, and arts dominate in Brooklyn, while East Seattle is heavily dominated by tech, aerospace, healthcare, and shipping.
Both cities have excellent healthcare systems. Brooklyn has many reputable hospitals and healthcare organizations such as Maimonides Medical Center. East Seattle also has top-tier healthcare facilities like the University of Washington Medical Center and Swedish Medical Center.
Health (county statistics)
Type
Brooklyn
East Seattle
General health status score of residents in this county from 1 (poor) to 5 (excellent)
Brooklyn boasts extensive infrastructure, with well-maintained roads, bridges, and a comprehensive public transportation network. East Seattle also has robust infrastructure with a focus on sustainability.
Infrastructure
Type
Brooklyn
East Seattle
TV stations
29
16
Schools
School facilities
Type
Brooklyn
East Seattle
Private elementary/middle schools
151
1
Private high schools
128
1
Public elementary/middle schools
405
2
Public high schools
176
2
Colleges/Universities
48
0
Culture and Food
Brooklyn is known for its diverse culture and food scene, boasting a mix of culinary traditions from around the world. East Seattle also offers a diverse food scene heavily influenced by Asian cuisines, seafood, and local ingredients.
Sports Teams
Brooklyn hosts the Brooklyn Nets(NBA) and the New York Islanders(NHL). In contrast, East Seattle residents support mainstream Seattle teams like the Seahawks(NFL), Mariners(MLB), Sounders(MLS), and the recent addition of the Kraken(NHL).
 Brooklyn, NY
 East Seattle, WA