Brooklyn, NY and Metropolitan Government, TN, also known as Nashville, offer unique living experiences with contrasting environments, opportunities, and lifestyles. Where Brooklyn is part of the hustling bustling lifestyle of New York, Nashville provides a calmer pace with a southern charm. Both cities have their specific attractions for tourists and their unique living environments for residents.
Brooklyn, NY, has recorded a decrease in major crime over the years but still struggles with areas of higher crime rate. Community policing, and an active and responsive NYPD presence contribute to making most Brooklyn neighborhoods safe. Contrarily, Nashville experiences higher-than-average crime rates compared to the national average; however, it has many safe neighborhoods, and local police efforts are being intensified to reduce crime.
Cost of Living
Living in Brooklyn is considerably more expensive than in Nashville. The cost of housing, food, transportation, health care, and other daily necessities are significantly higher. Nashville's cost of living is lower and more affordable, making it a more attractive location for families and individuals on a budget.
Income Tax
New York has a progressive income tax system, with rates ranging from 4% to 8.82%. In contrast, Tennessee has no state income tax on wages and salaries, making Nashville appealing in this regard.
Property Tax
Property tax in Brooklyn is based on the value of the property and ranges between 0.90% and 1.68%. Nashville's property tax rates are usually lower, averaging between 0.70% and 1%.
Sales Tax
New York has a high sales tax at 8.875% which is a combination of the New York state sales tax of 4% and Brooklyn's local tax of 4.875%. Nashville has one of the highest sales taxes in the U.S., rating at 9.25%.
Income
Type
Brooklyn
Metropolitan Government
Estimated median household income
$67,567
$65,348
Estimated per capita income
$39,536
$43,994
Cost of living index (U.S. average is 100)
185.4
97.9
If you make $50,000 in Metropolitan Government, you will have to make $94,688 in Brooklyn to maintain the same standard of living.
Geographical Conditions
Brooklyn is a urban area with beaches, parks, and iconic views of Manhattan's skyline. Nashville is a city in the hills, offers lush greenery, and is known for its beautiful parks and rivers.
Geographical information
Type
Brooklyn
Metropolitan Government
Land area
70.6 sq. miles
502.3 sq. miles
Population density
35,956 people per sq. mile
1,236.2 people per sq. mile
Relative area comparison
Brooklyn, NY Metropolitan Government, TN
Education
Brooklyn boasts world-class educational institutions, with access to a thriving public school system and renowned universities such as Brooklyn College. Nashville also offers a robust education system with good public schools and prestigious universities like Vanderbilt University.
Each city has a distinct economic structure. Brooklyn thrives on sectors such as healthcare, professional services, retail, and education. Nashville's economy is more focused on healthcare, education, music and entertainment, and growing tech and entrepreneurial sectors.
Biggest Employers
For Brooklyn, some of the largest employers are JPMorgan Chase, NewYork-Presbyterian Healthcare System, and Macy's Inc. In Nashville, Vanderbilt University, Nissan North America, and HCA Healthcare are among the biggest employers.
In Brooklyn (Kings County), 82.1% voted for Democrats and 16.9% for Republicans in 2012 Presidential Election. In Metropolitan Government (Davidson County), 58.5% voted for Democrats and 39.9% for Republicans.
Elections
Type
Democrats
Republicans
Other
Year
Brooklyn
Metropolitan Government
Brooklyn
Metropolitan Government
Brooklyn
Metropolitan Government
2020
76.9%
65.0%
22.2%
32.6%
1.0%
2.3%
2016
79.6%
60.1%
17.5%
34.1%
2.9%
5.7%
2012
82.1%
58.5%
16.9%
39.9%
0.9%
1.6%
2008
79.9%
60.0%
20.1%
39.0%
0.0%
1.0%
2004
75.0%
54.9%
24.3%
44.6%
0.7%
0.4%
2000
81.0%
57.9%
15.7%
40.4%
3.3%
1.7%
1996
80.1%
79.3%
15.1%
18.1%
4.9%
2.6%
Breakdown of population affiliated with a religious congregation
Type
Adherents
Congregations
Religion
Brooklyn
Metropolitan Government
Brooklyn
Metropolitan Government
CATHOLIC CHURCH
24.9%
4.9%
7.5%
2.3%
MUSLIM ESTIMATE
3.8%
0.8%
4.2%
1.4%
AMERICAN BAPTIST CHURCHES IN THE USA
1.9%
0.1%
3.8%
0.3%
SEVENTH DAY ADVENTIST CHURCH
1.0%
1.1%
5.2%
1.7%
EPISCOPAL CHURCH
0.7%
1.5%
2.3%
1.8%
SOUTHERN BAPTIST CONVENTION
0.2%
14.1%
2.4%
19.6%
COPTIC ORTHODOX CHURCH
0.1%
1.0%
0.1%
0.5%
PRESBYTERIAN CHURCH IN AMERICA
0.0%
0.8%
0.1%
0.9%
Weather
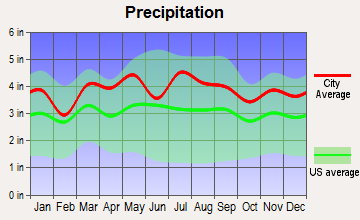
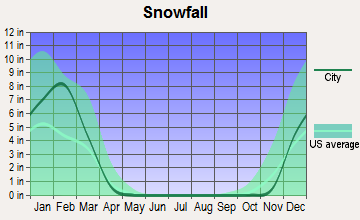
Brooklyn experiences a humid subtropical climate with four distinct seasons, including hot, humid summers and snowy winters. Nashville, on the other hand, also features a humid subtropical climate, but with milder winters and hotter summers, far less snow, and more rainy days.
Weather and climate
Type
Brooklyn
Metropolitan Government
Temperature - Average
55.1°F
58.4°F
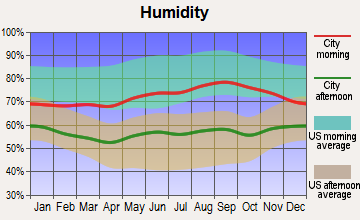
Humidity - Average morning or afternoon humidity
68.7%
75.9%
Humidity - Differences between morning and afternoon humidity
26.1%
38%
Humidity - Maximum monthly morning or afternoon humidity
76.8%
89%
Humidity - Minimum monthly morning or afternoon humidity
50.7%
51%
Precipitation - Yearly average
46.5 in
49 in
Snowfall - Yearly average
53.4 in
17.8 in
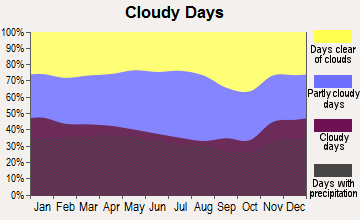
Clouds - Number of days clear of clouds
16.7%
17.1%
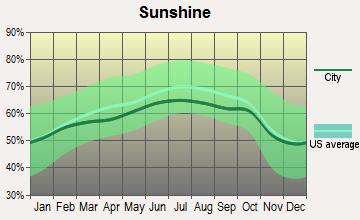
Sunshine amount - Average
60.2%
59.7%
Sunshine amount - Differences during a year
20%
23%
Sunshine amount - Maximum monthly
64%
65%
Sunshine amount - Minimum monthly
44%
42%
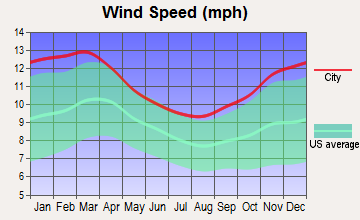
Wind speed - Average
10.6 mph
7.7 mph
Average climate in Brooklyn, New York
Average climate in Metropolitan Government, Tennessee
Air pollution
Type
AQI
CO
NO2
OZONE
PB
PM10
PM25
SO2
Year
Brooklyn
Metropolitan Government
Brooklyn
Metropolitan Government
Brooklyn
Metropolitan Government
Brooklyn
Metropolitan Government
Brooklyn
Metropolitan Government
Brooklyn
Metropolitan Government
Brooklyn
Metropolitan Government
Brooklyn
Metropolitan Government
2018
93
71
0.31
0.40
16.8
13.8
24.2
24.1
N/A
N/A
N/A
15.2
7.0
9.2
0.4
0.2
2017
95
70
0.25
0.38
17.0
14.4
24.5
26.8
N/A
N/A
N/A
15.3
7.1
8.7
0.3
0.1
2016
93
90
0.31
0.42
17.7
16.1
24.8
26.4
N/A
N/A
N/A
N/A
7.2
10.1
0.5
0.0
2015
100
68
0.38
0.43
18.2
15.5
24.1
23.6
N/A
N/A
N/A
N/A
8.0
10.8
0.7
0.1
2014
95
66
0.38
N/A
18.5
N/A
23.5
26.3
N/A
N/A
N/A
N/A
7.8
9.8
0.9
1.4
2013
96
62
0.41
N/A
18.9
N/A
24.4
N/A
N/A
N/A
N/A
N/A
8.5
9.7
1.0
N/A
2012
98
81
0.44
N/A
18.3
N/A
24.4
28.3
N/A
N/A
N/A
N/A
9.2
11.0
1.6
2.3
2011
107
81
0.43
N/A
20.7
N/A
23.6
25.9
N/A
N/A
N/A
N/A
10.3
11.0
2.4
1.7
2010
112
80
0.43
N/A
19.4
N/A
24.7
24.3
N/A
N/A
N/A
N/A
10.0
12.2
2.3
2.2
2009
104
72
0.43
N/A
21.5
N/A
20.7
22.5
N/A
N/A
N/A
N/A
10.2
11.5
3.1
2.4
2008
109
81
0.47
N/A
22.6
N/A
21.3
25.7
0.013
N/A
N/A
N/A
11.8
13.4
4.1
2.5
2007
121
99
0.53
N/A
23.5
N/A
20.8
27.4
0.016
N/A
N/A
N/A
12.4
15.5
4.8
2.7
2006
116
93
0.61
0.69
24.2
N/A
20.7
24.9
0.018
N/A
N/A
N/A
13.0
14.9
5.7
2.9
2005
107
104
0.74
0.56
26.1
N/A
19.6
23.5
N/A
N/A
N/A
N/A
N/A
16.9
7.5
3.1
2004
106
83
0.74
0.61
25.8
N/A
18.5
22.0
0.030
0.006
N/A
N/A
N/A
N/A
7.1
2.6
2003
107
93
0.81
0.67
27.4
N/A
18.4
18.5
0.021
0.005
26.9
N/A
N/A
15.8
7.4
3.8
2002
122
92
0.76
0.68
27.9
N/A
19.9
20.2
0.008
N/A
26.2
N/A
N/A
15.3
6.5
4.3
2001
121
95
0.80
0.90
29.5
N/A
22.3
19.5
0.020
N/A
27.3
N/A
N/A
15.6
7.8
4.5
2000
115
97
0.92
0.75
29.8
N/A
20.3
19.8
0.022
N/A
22.2
N/A
N/A
N/A
7.4
4.1
Natural disasters
Type
Brooklyn
Metropolitan Government
Tornado activity compared to U.S. average
56.4%
169%
Earthquake activity compared to U.S. average
30.8%
296.3%
Natural disasters compared to U.S. average
17%
17%
Transportation
Brooklyn excels in this category with extensive public transportation, including subways, buses, and ferries. Commuting is easy, though crowded. Nashville's public transit system is less comprehensive, heavily relying on car commuting, but efforts are being made to improve this.
Transport
Type
Brooklyn
Metropolitan Government
Amtrak stations nearby
3
1
FAA registered aircraft
149
0
FAA registered aircraft manufacturers and dealers
2
0
Means of transportation to work
Type
Brooklyn
Metropolitan Government
Bicycle
0.5%
0.1%
Bus
10.4%
1.6%
Carpooled
8%
13.3%
Car alone
22.4%
78.6%
Railroad
1.4%
0%
Streetcar
0.2%
0%
Subway
44.8%
0%
Taxicab
0.7%
0.1%
Walked
8.8%
2.3%
Average travel time to work
Type
Brooklyn
Metropolitan Government
Average
44.5 min
23.7 min
Real Estate
Real estate in Brooklyn is pricey, with a competitive market that includes both historic brownstones and modern luxury apartments. Nashville's real estate market is more affordable, offering a range of properties from downtown apartments to spacious homes in suburban areas.
Neighborhoods
Brooklyn is diverse, offering neighborhoods ranging from hipster havens like Williamsburg to quaint, historic areas like Brooklyn Heights. Nashville is known for its friendly neighborhoods like East Nashville and 12 South showcasing southern charm and hospitality.
Houses and residents
Type
Brooklyn
Metropolitan Government
Houses
930,866
252,977
Average household size (people)
2.7
2.3
Houses occupied
880,727 (94.6%)
237,405 (93.8%)
Houses occupied by owners
238,290 (27.1%)
131,384 (55.3%)
Houses occupied by renters
642,437 (72.9%)
106,021 (44.7%)
Median rent asked for vacant for-rent units
$1,589
$1,207
Median price asked for vacant for-sale houses and condos
$1,621,117
$226,967
Estimated median house or condo value
$793,300
$350,700
Median number of rooms in apartments
3.6
4.2
Median number of rooms in houses and condos
5.2
6.4
Housing density (houses/condos per square mile)
13,184
503.7
Household income disparities
48.5%
45.5%
Housing units without a mortgage
29,251 (32.9%)
32,597 (28.1%)
Housing units with both a second mortgage and home equity loan
183 (0.2%)
342 (0.3%)
Housing units with a mortgage
59,793 (67.1%)
83,416 (71.9%)
Housing units with a home equity loan
4,512 (5.1%)
8,009 (6.9%)
Housing units with a second mortgage
5,098 (5.7%)
9,691 (8.4%)
Housing units lacking complete kitchen facilities
1.5%
0.7%
Housing units lacking complete plumbing facilities
1.7%
0.5%
Housing units in structures
Housing units in structures
Brooklyn
Metropolitan Government
One, detached
5.0%
52.7%
One, attached
8.7%
6.9%
Two
18.1%
6.0%
3 or 4
17.1%
4.0%
5 to 9
11.1%
7.1%
10 to 19
6.0%
9.0%
20 to 49
13.6%
4.6%
50 or more
20.3%
8.0%
Mobile homes
0.1%
1.6%
Median real estate property taxes paid for housing units
Self-employed workers in own not incorporated business
45,971
20,090
State government workers
27,527
13,081
Unpaid family workers
2,234
668
Industries and Occupations
In Brooklyn, healthcare, education, and retail dominate the job market, while in Nashville, the healthcare industry leads, with significant contributions from education, music, and a growing tech industry.
Brooklyn offers excellent healthcare services, with multiple highly-ranked hospitals and healthcare facilities. Similarly, Nashville is known for its healthcare industry, hosting some of the country's best hospitals.
Health (county statistics)
Type
Brooklyn
Metropolitan Government
General health status score of residents in this county from 1 (poor) to 5 (excellent)
Despite being older, Brooklyn's infrastructure is well-developed and continually improving, with modern buildings, bridges, parks, and utility systems. Nashville, although not as densely populated or built up, also has good infrastructure with continued developments in its urban and suburban areas.
Infrastructure
Type
Brooklyn
Metropolitan Government
TV stations
29
19
Culture and Food
Brooklyn is a melting pot of global cultures and offers an extensive culinary scene, bustling arts environment, and diverse entertainment. Nashville too is rich in culture, known for its music scene, particularly country music, southern cuisine, and the arts.
Sports Teams
Brooklyn is home to NBA's Brooklyn Nets and NHL's New York Islanders. Nashville houses the NFL's Tennessee Titans, NHL's Nashville Predators, and soccer's Nashville SC.
 Brooklyn, NY
 Metropolitan Government, TN