Central Contra Costa, CA and Fairfield, CA are places with their unique attributes that make them viable options for relocating or visiting. Contra Costa boasts of lower crime rates, a higher cost of living, a wealthier economy, more developed infrastructure, higher ranked education, and a compelling cultural scene. Conversely, Fairfield offers a lower cost of living, sunny weather, robust healthcare facilities, and astonishing natural scenes, making it equally attractive. This piece will provide an in-depth comparison of these places based on various factors.
Central Contra Costa enjoys a relatively lower crime rate compared to Fairfield. However, both places are generally safe to live in or visit. They both have well-equipped police departments dedicated to maintaining peace and order. Crimes are isolated incidents, and they do not define the security status of these places.
Cost of Living
Living in Central Contra Costa is significantly pricier than in Fairfield. This is due to the high cost of housing and other living expenses. However, the higher cost of living correlates with a more affluent lifestyle and access to more amenities and facilities.
Income Tax
Central Contra Costa and Fairfield residents all fall under California's progressive state income tax system.
Property Tax
Property taxes are generally higher in Central Contra Costa due to the higher home values than in Fairfield.
Sales Tax
Central Contra Costa County and Fairfield both adhere to California's base sales tax rate of 7.25%. Other district taxes may increase this rate.
Income
Type
Central Contra Costa
Fairfield
Estimated median household income
$127,452
$90,346
Estimated per capita income
$68,702
$35,688
Cost of living index (U.S. average is 100)
139.1
112.9
If you make $50,000 in Fairfield, you will have to make $61,603 in Central Contra Costa to maintain the same standard of living.
Geographical Conditions
Fairfield is known for its beautiful rolling hills, vineyards, and close proximity to natural attractions like the Suisun Bay. Central Contra Costa also boasts lovely scenery with beautiful hillsides and access to several outdoor activities.
Geographical information
Type
Central Contra Costa
Fairfield
Land area
261.3 sq. miles
37.7 sq. miles
Population density
1,863.4 people per sq. mile
3,179.1 people per sq. mile
Relative area comparison
Central Contra Costa, CA Fairfield, CA
Education
Education in Central Contra Costa is touted to have a higher ranking than Fairfield. There are many options for quality education, including private and public schools. Several universities and colleges are also within close proximity. Conversely, Fairfield also has good schools, boosting the quality of education in the area.
The economy of Central Contra Costa is more robust than that of Fairfield. Major sectors contributing to the economy include tech, biotech, healthcare, and finance services. Fairfield, though having a smaller market, has a noticeably thriving economy driven by healthcare, retail, manufacturing, and public services.
Biggest Employers
Some of the biggest employers in Central Contra Costa include Chevron Corp., Wells Fargo bank, and Kaiser Permanente. In Fairfield, some of the largest employers are Anheuser Busch, InBev, Jelly Belly Candy Company, and Fairfield-Suisun Unified School District.
In Central Contra Costa (Contra Costa County), 66.2% voted for Democrats and 31.1% for Republicans in 2012 Presidential Election. In Fairfield (Solano County), 63.3% voted for Democrats and 34.1% for Republicans.
Elections
Type
Democrats
Republicans
Other
Year
Central Contra Costa
Fairfield
Central Contra Costa
Fairfield
Central Contra Costa
Fairfield
2020
71.8%
63.7%
26.4%
33.5%
1.8%
2.8%
2016
67.5%
60.9%
24.5%
30.9%
8.0%
8.2%
2012
66.2%
63.3%
31.1%
34.1%
2.7%
2.6%
2008
68.0%
63.4%
30.2%
34.8%
1.8%
1.8%
2004
62.6%
57.6%
36.7%
42.1%
0.7%
0.3%
2000
59.0%
57.1%
37.2%
39.3%
3.8%
3.6%
1996
55.7%
55.1%
35.2%
34.7%
9.1%
10.1%
Breakdown of population affiliated with a religious congregation
Type
Adherents
Congregations
Religion
Central Contra Costa
Fairfield
Central Contra Costa
Fairfield
CATHOLIC CHURCH
21.8%
19.6%
5.2%
3.4%
SOUTHERN BAPTIST CONVENTION
1.3%
3.4%
10.0%
11.9%
MUSLIM ESTIMATE
1.0%
0.8%
1.4%
1.0%
EPISCOPAL CHURCH
0.5%
0.3%
2.3%
1.4%
EVANGELICAL LUTHERAN CHURCH IN AMERICA
0.5%
0.3%
2.0%
1.4%
AMERICAN BAPTIST CHURCHES IN THE USA
0.3%
0.6%
2.6%
4.1%
SEVENTH DAY ADVENTIST CHURCH
0.3%
0.3%
1.5%
2.0%
LUTHERAN CHURCH
0.2%
0.3%
2.0%
1.0%
Weather
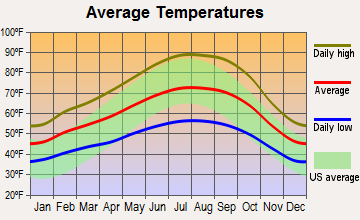
Residents and visitors of Fairfield enjoy a Mediterranean climate characterized by hot, dry summers and mild, wet winters. This provides for great outdoor activities. Central Contra Costa, on the other hand, presents a milder climate with less temperature extremes. It has pleasant temperatures all year round.
Weather and climate
Type
Central Contra Costa
Fairfield
Temperature - Average
59.1°F
60.4°F
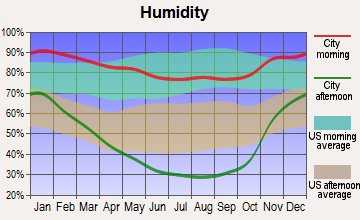
Humidity - Average morning or afternoon humidity
82.2%
71.1%
Humidity - Differences between morning and afternoon humidity
29.3%
47.4%
Humidity - Maximum monthly morning or afternoon humidity
88.1%
86.9%
Humidity - Minimum monthly morning or afternoon humidity
58.8%
39.5%
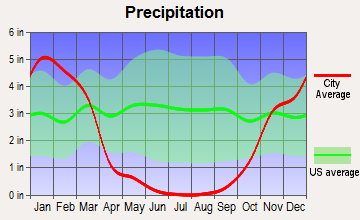
Precipitation - Yearly average
21.8 in
23.5 in
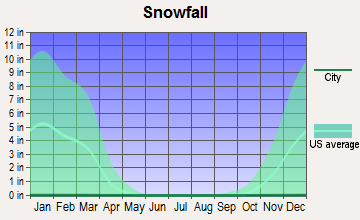
Snowfall - Yearly average
0 in
0 in
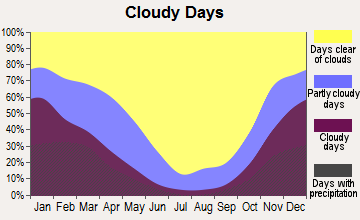
Clouds - Number of days clear of clouds
27.7%
30.7%
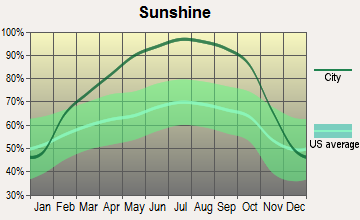
Sunshine amount - Average
73.3%
80.3%
Sunshine amount - Differences during a year
22.4%
39.5%
Sunshine amount - Maximum monthly
77.2%
88.6%
Sunshine amount - Minimum monthly
54.7%
49.1%
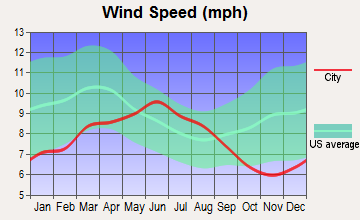
Wind speed - Average
11.1 mph
8.3 mph
Average climate in Central Contra Costa, California
Average climate in Fairfield, California
Air pollution
Type
AQI
CO
NO2
OZONE
PB
PM25
SO2
Year
Central Contra Costa
Fairfield
Central Contra Costa
Fairfield
Central Contra Costa
Fairfield
Central Contra Costa
Fairfield
Central Contra Costa
Fairfield
Central Contra Costa
Fairfield
Central Contra Costa
Fairfield
2018
105
98
0.32
0.34
6.9
6.6
22.1
27.2
0.012
N/A
13.3
12.1
0.6
0.6
2017
102
104
0.30
0.42
7.0
7.2
25.9
27.0
0.008
N/A
11.9
11.5
0.7
0.8
2016
86
78
0.28
0.37
6.5
6.8
25.2
25.3
0.005
N/A
6.5
8.0
0.8
0.7
2015
94
91
0.34
0.42
7.6
7.5
25.8
26.2
0.004
N/A
8.8
9.9
0.5
0.6
2014
95
84
0.35
0.39
7.8
7.6
25.2
25.4
0.005
N/A
6.9
10.0
0.5
0.6
2013
93
88
0.34
0.42
9.3
9.0
21.5
25.2
0.004
N/A
7.8
10.3
0.5
0.6
2012
93
87
0.32
0.41
8.5
8.3
25.2
26.4
0.003
N/A
8.3
9.3
0.3
0.6
2011
99
92
0.35
0.44
9.0
9.0
23.0
25.4
0.003
N/A
9.8
10.9
0.6
0.8
2010
93
87
0.31
0.36
8.6
8.6
23.2
25.1
0.014
N/A
8.5
8.4
0.5
0.5
2009
104
97
0.31
0.33
9.5
9.3
23.7
24.4
0.006
N/A
10.3
9.7
0.6
0.6
2008
120
115
0.36
0.35
10.2
9.4
26.1
25.9
0.006
0.005
12.1
12.7
0.8
1.2
2007
104
104
0.36
0.38
10.7
9.7
24.1
24.2
0.006
N/A
9.7
11.4
0.7
1.3
2006
109
109
0.39
0.43
10.9
10.9
26.0
25.1
N/A
N/A
11.1
11.3
0.8
1.4
2005
104
99
0.43
0.41
11.6
10.5
22.7
22.5
N/A
N/A
10.4
11.0
1.0
1.6
2004
112
110
0.46
0.44
12.4
11.1
22.6
23.4
0.004
N/A
11.9
12.0
1.1
1.5
2003
84
88
0.51
0.48
13.4
11.9
23.1
23.6
N/A
N/A
N/A
N/A
0.7
1.5
2002
88
79
0.51
0.50
14.7
13.2
23.3
23.9
0.008
N/A
N/A
N/A
0.9
1.9
2001
90
89
0.56
0.51
15.4
13.2
22.1
22.0
0.008
N/A
N/A
N/A
1.2
1.5
2000
95
82
0.67
0.58
15.9
13.1
20.8
20.7
0.013
N/A
N/A
N/A
1.6
1.6
Natural disasters
Type
Central Contra Costa
Fairfield
Tornado activity compared to U.S. average
9.4%
9.1%
Earthquake activity compared to U.S. average
7,786.2%
7,782.6%
Natural disasters compared to U.S. average
18%
23%
Transportation
Both Central Contra Costa and Fairfield have efficient public transportation systems, with Central Contra Costa's being a bit more robust due to more bus lines and BART access. Commuting in both areas is generally manageable, with convenient freeway access.
Transport
Type
Central Contra Costa
Fairfield
Amtrak stations nearby
3
3
FAA registered aircraft
0
69
FAA registered aircraft manufacturers and dealers
0
3
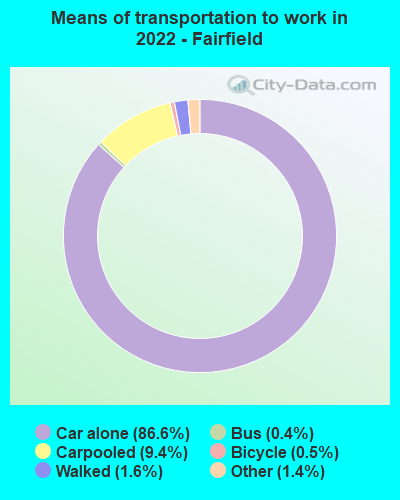
Means of transportation to work
Type
Central Contra Costa
Fairfield
Bicycle
0.5%
0.3%
Bus
1%
0.4%
Carpooled
9.9%
8.6%
Car alone
72.3%
87.7%
Ferryboat
0%
0.1%
Motorcycle
0.2%
0.5%
Railroad
0.8%
0.1%
Subway
7.7%
0.1%
Walked
1.5%
1.7%
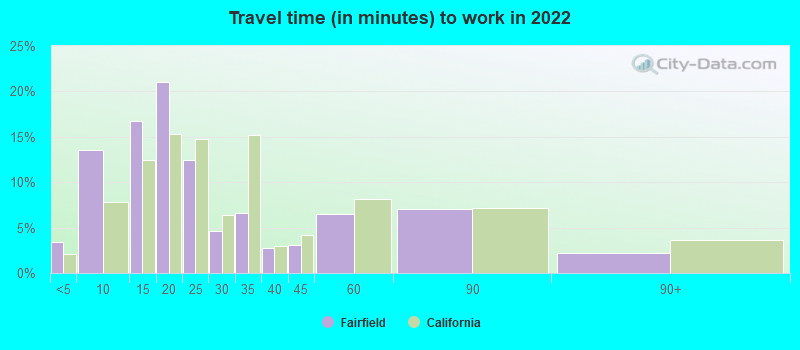
Average travel time to work
Type
Central Contra Costa
Fairfield
Average
31.8 min
29 min
Real Estate
The real estate market in Central Contra Costa is hotter, with housing prices significantly higher compared to Fairfield. Properties in Fairfield provide more affordable options, making it an excellent place for those seeking value for their money.
Neighborhoods
Central Contra Costa offers picturesque neighborhoods with a suburban feel and plenty of parks, restaurants, and shops. Fairfield has diverse neighborhoods from the historical to the modern, catering to a wide range of tastes.
Houses and residents
Type
Central Contra Costa
Fairfield
Houses
183,777
40,027
Average household size (people)
2.5
3
Houses occupied
179,136 (97.5%)
38,097 (95.2%)
Houses occupied by owners
127,889 (71.4%)
22,271 (58.5%)
Houses occupied by renters
51,247 (28.6%)
15,826 (41.5%)
Median rent asked for vacant for-rent units
$2,527
$1,432
Median price asked for vacant for-sale houses and condos
$1,269,474
$404,184
Estimated median house or condo value
Over $1,000,000
$552,300
Median number of rooms in apartments
4.3
4.4
Median number of rooms in houses and condos
6.5
6.6
Renting percentage
30.3%
39.6%
Housing density (houses/condos per square mile)
703.4
1,063
Household income disparities
35.9%
41.1%
Housing units without a mortgage
20,208 (18.2%)
366 (2.2%)
Housing units with both a second mortgage and home equity loan
418 (0.4%)
1,356 (8.3%)
Housing units with a mortgage
90,899 (81.8%)
15,977 (97.8%)
Housing units with a home equity loan
13,612 (12.3%)
0 (0%)
Housing units with a second mortgage
13,614 (12.3%)
1,913 (11.7%)
Housing units lacking complete kitchen facilities
0.5%
0.1%
Housing units lacking complete plumbing facilities
Self-employed workers in own not incorporated business
22,217
3,197
State government workers
6,705
2,846
Unpaid family workers
617
131
Industries and Occupations
In Central Contra Costa, the dominant industries are tech, finance, healthcare, and retail. Fairfield, however, is known for healthcare, manufacturing, and retail as the driving industries. Both offer plenty of job opportunities in these sectors.
Both Central Contra Costa and Fairfield are served by excellent healthcare facilities. Fairfield, however, has a strong healthcare sector contributing significantly to its employment market.
The infrastructure in Central Contra Costa is more developed compared to Fairfield, boasting numerous public parks, libraries, shopping centers, hospitals, and schools. However, Fairfield also possesses a well-developed infrastructure with continual improvements being made.
Infrastructure
Type
Central Contra Costa
Fairfield
TV stations
24
19
Culture and Food
Central Contra Costa has a diverse culture that is rich in arts, music, and entertainment. The food scene offers a variety of worldwide cuisine. Fairfield is culturally diverse too, home to a splendid farm-to-table food scene. The popular Jelly Belly factory is also a cultural and food highlight.
Sports Teams
There are no major sports teams directly in either Central Contra Costa or Fairfield. However, their proximity to San Francisco and Oakland opens access to teams like the San Francisco 49ers, Oakland Athletics, and Golden State Warriors.
 Central Contra Costa, CA
 Fairfield, CA