Comparing Central Contra Costa, CA to Mesa, AZ provides us with a comprehensive image of two very diverse environments. Both offer unique opportunities and possess their own distinct pros and cons. Central Contra Costa is nestled within the bustling Bay Area in California, known for its lush green landscape and relatively cool Mediterranean climate. Mesa, on the other hand, is the third-largest city in Arizona with a warmer desert climate, displaying a blend of urban development and historical richness.
Both Central Contra Costa and Mesa prioritize the safety of their residents. However, Central Contra Costa typically records lower crime rates compared to the national average, providing a comparatively safer atmosphere. Mesa's crime rates are slightly higher, but the city has been taking significant efforts to reduce crime and enhance the safety of its neighborhoods. Tourists typically feel safe in both locales due to their focus on recreational activities and busy city life, which usually disheartens criminal behavior.
Cost of Living
The cost of living is significantly higher in Central Contra Costa, CA, compared to Mesa, AZ due primarily to housing costs. Costs such as groceries, health care, utilities, and transportation are also typically higher in Central Contra Costa. Mesa provides a more affordable lifestyle, which is appealing to many individuals and families considering relocation.
Income Tax
California has a progressive income tax system, making it one of the states with the highest income tax rates, affecting Central Contra Costa residents. Arizona has a relatively lower income tax rate, creating a more tax-friendly environment for those living in Mesa.
Property Tax
Property taxes are higher in Central Contra Costa compared to Mesa, reflective of the higher property values in the Bay Area.
Sales Tax
Sales tax in Central Contra Costa is higher, in line with California's state sales tax of 7.25%. Mesa has a lower sales tax with Arizona's state sales tax of 5.6%.
Income
Type
Central Contra Costa
Mesa
Estimated median household income
$127,452
$69,266
Estimated per capita income
$68,702
$35,439
Cost of living index (U.S. average is 100)
139.1
101
If you make $50,000 in Mesa, you will have to make $68,861 in Central Contra Costa to maintain the same standard of living.
Geographical Conditions
Located by the San Francisco Bay, Central Contra Costa enjoys a lush, hilly landscape with plenty of open spaces. Mesa is located in the wider Phoenix metropolitan area, offering a desert landscape marked by the iconic Superstition Mountains.
Geographical information
Type
Central Contra Costa
Mesa
Land area
261.3 sq. miles
125 sq. miles
Population density
1,863.4 people per sq. mile
4,076.2 people per sq. mile
Relative area comparison
Central Contra Costa, CA Mesa, AZ
Education
The quality of education in both cities is commendable. Central Contra Costa boasts some of the country's highly rated schools and colleges, making it attractive for families. Mesa also provides quality education with an array of public, charter, and private schools, and is home to institutions like Arizona State University's Polytechnic campus, attracting students from around the world.
Both cities have robust economies. Central Contra Costa, as part of the Bay Area, has a strong job market, particularly in industries such as technology, healthcare, and education. Mesa's economy is also diverse with strong sectors in retail, healthcare, and education, and the city has been seeing significant growth in its technology and aerospace sectors.
Biggest Employers
In Central Contra Costa, the biggest employers are sectors such as healthcare with companies like Kaiser Permanente, John Muir Health, and the public sector. In Mesa, the largest employers include Banner Health System, Mesa Public Schools, and the City of Mesa.
In Central Contra Costa (Contra Costa County), 66.2% voted for Democrats and 31.1% for Republicans in 2012 Presidential Election. In Mesa (Maricopa County), 43.6% voted for Democrats and 54.3% for Republicans.
Elections
Type
Democrats
Republicans
Other
Year
Central Contra Costa
Mesa
Central Contra Costa
Mesa
Central Contra Costa
Mesa
2020
71.8%
50.2%
26.4%
48.0%
1.8%
1.8%
2016
67.5%
44.9%
24.5%
47.7%
8.0%
7.5%
2012
66.2%
43.6%
31.1%
54.3%
2.7%
2.1%
2008
68.0%
44.0%
30.2%
54.5%
1.8%
1.5%
2004
62.6%
42.4%
36.7%
57.0%
0.7%
0.6%
2000
59.0%
43.0%
37.2%
53.4%
3.8%
3.6%
1996
55.7%
44.5%
35.2%
47.2%
9.1%
8.2%
Breakdown of population affiliated with a religious congregation
Type
Adherents
Congregations
Religion
Central Contra Costa
Mesa
Central Contra Costa
Mesa
CATHOLIC CHURCH
21.8%
13.6%
5.2%
4.3%
SOUTHERN BAPTIST CONVENTION
1.3%
1.9%
10.0%
6.5%
MUSLIM ESTIMATE
1.0%
0.2%
1.4%
1.0%
EPISCOPAL CHURCH
0.5%
0.3%
2.3%
1.3%
EVANGELICAL LUTHERAN CHURCH IN AMERICA
0.5%
0.8%
2.0%
2.0%
SEVENTH DAY ADVENTIST CHURCH
0.3%
0.4%
1.5%
2.0%
LUTHERAN CHURCH
0.2%
0.5%
2.0%
1.5%
VINEYARD USA
0.0%
0.3%
0.3%
0.6%
Weather
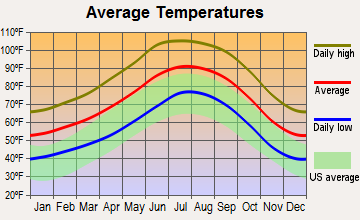
One of the notable differences between the two cities is their weather. Central Contra Costa enjoys a typical Mediterranean climate with warm summers and mild winters. This generally pleasant weather attracts people who enjoy moderate temperatures. On the other hand, Mesa possesses a desert climate with hot, dry summers and mild winters. For individuals or tourists who thrive in warmer conditions, Mesa may be a more appealing option.
Weather and climate
Type
Central Contra Costa
Mesa
Temperature - Average
59.1°F
71.7°F
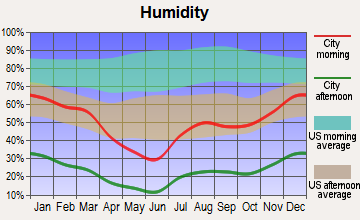
Humidity - Average morning or afternoon humidity
82.2%
37.5%
Humidity - Differences between morning and afternoon humidity
29.3%
48%
Humidity - Maximum monthly morning or afternoon humidity
88.1%
60%
Humidity - Minimum monthly morning or afternoon humidity
58.8%
12%
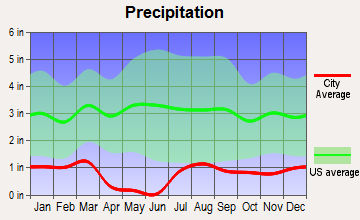
Precipitation - Yearly average
21.8 in
9.5 in
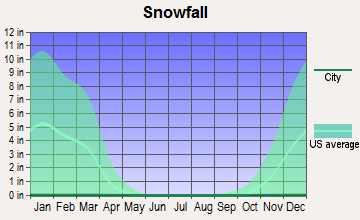
Snowfall - Yearly average
0 in
0 in
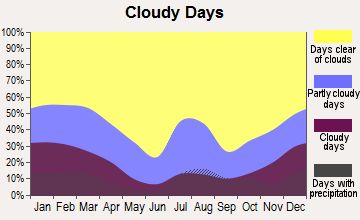
Clouds - Number of days clear of clouds
27.7%
35.2%
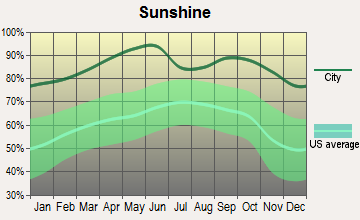
Sunshine amount - Average
73.3%
92.8%
Sunshine amount - Differences during a year
22.4%
16%
Sunshine amount - Maximum monthly
77.2%
95%
Sunshine amount - Minimum monthly
54.7%
79%
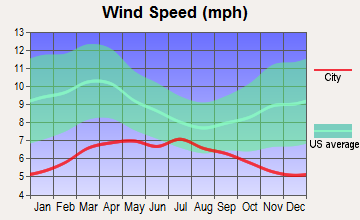
Wind speed - Average
11.1 mph
6.6 mph
Average climate in Central Contra Costa, California
Average climate in Mesa, Arizona
Air pollution
Type
AQI
CO
NO2
OZONE
PB
PM10
PM25
SO2
Year
Central Contra Costa
Mesa
Central Contra Costa
Mesa
Central Contra Costa
Mesa
Central Contra Costa
Mesa
Central Contra Costa
Mesa
Central Contra Costa
Mesa
Central Contra Costa
Mesa
2018
105
200
0.32
0.28
6.9
15.1
22.1
34.8
0.012
N/A
28.1
N/A
13.3
7.5
0.6
0.6
2017
102
128
0.30
0.28
7.0
15.8
25.9
35.1
0.008
N/A
24.5
N/A
11.9
8.2
0.7
1.4
2016
86
121
0.28
0.31
6.5
15.7
25.2
34.6
0.005
N/A
21.5
N/A
6.5
6.8
0.8
0.4
2015
94
104
0.34
0.34
7.6
17.6
25.8
33.4
0.004
N/A
17.7
N/A
8.8
6.8
0.5
0.9
2014
95
135
0.35
0.33
7.8
19.6
25.2
34.0
0.005
N/A
30.8
N/A
6.9
8.4
0.5
1.1
2013
93
141
0.34
0.31
9.3
19.9
21.5
34.8
0.004
N/A
29.3
N/A
7.8
5.8
0.5
0.9
2012
93
159
0.32
0.38
8.5
21.2
25.2
33.7
0.003
N/A
37.9
N/A
8.3
8.1
0.3
1.3
2011
99
205
0.35
0.31
9.0
18.5
23.0
34.1
0.003
N/A
40.4
N/A
9.8
9.5
0.6
0.9
2010
93
100
0.31
0.31
8.6
16.4
23.2
32.9
0.014
N/A
29.5
N/A
8.5
8.3
0.5
1.2
2009
104
109
0.31
0.33
9.5
16.6
23.7
32.3
0.006
N/A
37.8
N/A
10.3
N/A
0.6
1.0
2008
120
106
0.36
0.29
10.2
17.5
26.1
34.2
0.006
N/A
39.9
N/A
12.1
N/A
0.8
1.1
2007
104
134
0.36
0.43
10.7
19.3
24.1
31.0
0.006
N/A
50.6
N/A
9.7
N/A
0.7
1.9
2006
109
138
0.39
0.44
10.9
22.1
26.0
30.9
N/A
N/A
57.5
N/A
11.1
N/A
0.8
1.8
2005
104
109
0.43
0.49
11.6
22.6
22.7
30.0
N/A
N/A
49.1
N/A
10.4
N/A
1.0
1.7
2004
112
97
0.46
0.51
12.4
22.4
22.6
30.4
0.004
N/A
33.4
N/A
11.9
N/A
1.1
1.4
2003
84
99
0.51
0.56
13.4
24.0
23.1
31.7
N/A
N/A
42.6
N/A
N/A
N/A
0.7
1.4
2002
88
110
0.51
0.69
14.7
24.9
23.3
28.0
0.008
N/A
41.8
N/A
N/A
N/A
0.9
1.6
2001
90
105
0.56
0.65
15.4
23.8
22.1
27.2
0.008
N/A
37.8
N/A
N/A
N/A
1.2
1.5
2000
95
117
0.67
0.76
15.9
29.8
20.8
27.1
0.013
N/A
45.6
N/A
N/A
N/A
1.6
1.7
Natural disasters
Type
Central Contra Costa
Mesa
Tornado activity compared to U.S. average
9.4%
18.1%
Earthquake activity compared to U.S. average
7,786.2%
2,348.6%
Natural disasters compared to U.S. average
18%
16%
Transportation
Central Contra Costa's public transit system, part of the broader Bay Area transit network, facilitates easy commuting within the region. Mesa also offers good public transit options including bus and light-rail services connecting residents to the wider Phoenix area. Both cities have a well-managed road network for those preferring to drive.
Transport
Type
Central Contra Costa
Mesa
Amtrak stations nearby
3
2
FAA registered aircraft
0
828
FAA registered aircraft manufacturers and dealers
0
20
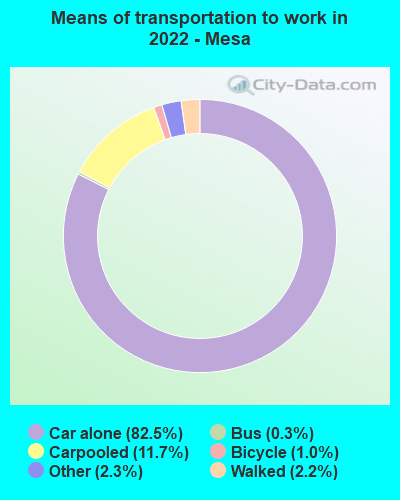
Means of transportation to work
Type
Central Contra Costa
Mesa
Bicycle
0.5%
0.6%
Bus
1%
0.3%
Carpooled
9.9%
14.4%
Car alone
72.3%
79.9%
Motorcycle
0.2%
0.5%
Railroad
0.8%
0%
Subway
7.7%
0%
Walked
1.5%
2.5%
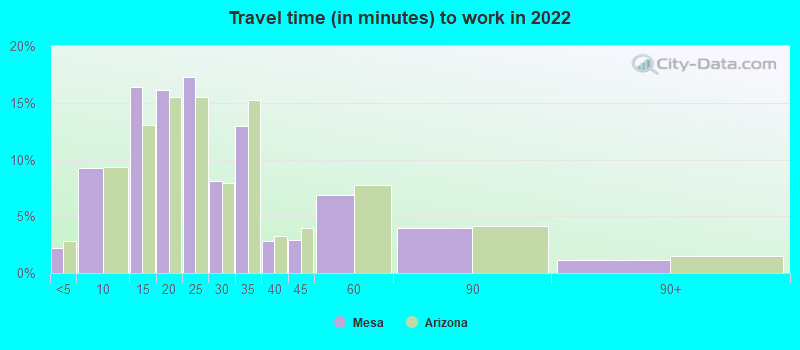
Average travel time to work
Type
Central Contra Costa
Mesa
Average
31.8 min
25 min
Real Estate
Real estate in Central Contra Costa is quite expensive due to its desirable location within the Bay Area. Property values are generally high, reflecting the overall cost of living in the region. Mesa real estate is more affordable in comparison, attracting many people looking for a cost-effective living environment.
Neighborhoods
Both cities offer diverse neighborhoods catering to various lifestyles. Central Contra Costa features upscale, suburban neighborhoods with well-manicured properties, as well as more urban settings. Mesa offers a mix of suburban and downtown living opportunities with neighborhoods that embody small-town vibes and others that reflect urban development.
Houses and residents
Type
Central Contra Costa
Mesa
Houses
183,777
221,995
Average household size (people)
2.5
2.6
Houses occupied
179,136 (97.5%)
199,112 (89.7%)
Houses occupied by owners
127,889 (71.4%)
126,146 (63.4%)
Houses occupied by renters
51,247 (28.6%)
72,966 (36.6%)
Median rent asked for vacant for-rent units
$2,527
$1,890
Median price asked for vacant for-sale houses and condos
$1,269,474
$262,297
Estimated median house or condo value
Over $1,000,000
$350,100
Median number of rooms in apartments
4.3
4
Median number of rooms in houses and condos
6.5
5.9
Renting percentage
30.3%
36.8%
Housing density (houses/condos per square mile)
703.4
1,776.1
Household income disparities
35.9%
42.1%
Housing units without a mortgage
20,208 (18.2%)
1,338 (1.6%)
Housing units with both a second mortgage and home equity loan
418 (0.4%)
5,628 (6.9%)
Housing units with a mortgage
90,899 (81.8%)
80,572 (98.4%)
Housing units with a home equity loan
13,612 (12.3%)
48 (0.1%)
Housing units with a second mortgage
13,614 (12.3%)
7,236 (8.8%)
Housing units lacking complete kitchen facilities
0.5%
0.9%
Housing units lacking complete plumbing facilities
Self-employed workers in own not incorporated business
22,217
10,562
State government workers
6,705
6,039
Unpaid family workers
617
830
Industries and Occupations
Central Contra Costa has a diverse economic landscape with a healthy mix of sectors such as technology, healthcare, finance, and education. Mesa's economy is dominated by sectors including retail, education, healthcare, and a growing technology and aerospace industry.
Both Centra Contra Costa and Mesa are served by commendable healthcare systems. Central Contra Costa is home to renowned medical centers, and Mesa is served by institutions like Banner Health and Dignity Health.
Health (county statistics)
Type
Central Contra Costa
Mesa
General health status score of residents in this county from 1 (poor) to 5 (excellent)
While both cities have good infrastructure, Central Contra Costa may have a slight advantage due to its proximity to San Francisco and other major cities in the Bay Area. The city has well-maintained roads, public facilities, parks, and recreational areas. Mesa also boasts modern infrastructure and is continually investing in its development.
Infrastructure
Type
Central Contra Costa
Mesa
TV stations
24
18
Culture and Food
The culture of both cities is distinct and rich. Central Contra Costa offers a cosmopolitan cultural scene reflective of the Bay Area's diversity, with a plethora of food choices including global cuisine. Mesa offers a blend of cultural experiences reflective of its Southwestern heritage, with a food scene offering excellent Mexican food and more.
Sports Teams
Central Contra Costa residents have access to the Bay Area's rich sports culture, home to teams like the San Francisco 49ers, Golden State Warriors, and Oakland Athletics. Mesa is close to Phoenix, home to the Arizona Cardinals, Phoenix Suns, Arizona Diamondbacks, and the Coyotes.
 Central Contra Costa, CA
 Mesa, AZ