Whether you're thinking of relocating or just visiting, understanding the distinct characteristics of Central Contra Costa, CA, and Stockton, CA, can help you make an informed decision. Each area has its unique qualities, from weather to cost of living, education, economy, and more, providing a tailored experience for both residents and visitors.
Regarding crime and safety, Central Contra Costa generally ranks better than Stockton. According to NeighborhoodScout, Central Contra Costa's crime rate is lower than approximately 59% of California's cities and towns. However, in Stockton, the crime rate is significantly higher than the nation's average, making it safer than only 18% of U.S. cities.
Cost of Living
Living costs in Central Contra Costa are quite high, significantly higher than the U.S. average - this includes costs associated with housing, groceries, utilities, and health. Conversely, Stockton has a moderately high cost of living index, but it is lower than Central Contra Costa and slightly above the national average.
Income Tax
California, where both Central Contra Costa and Stockton are located, has a progressive income tax system, with rates ranging from 1% to 13.3%, based on income level. Both locations fall under the same state tax laws.
Property Tax
Property tax rates in Central Contra Costa County range between 0.76% and 1.09%, while in Stockton (San Joaquin County), they are generally lower, typically around 0.88%.
Sales Tax
The city/state sales tax in Central Contra Costa ranges from 8.25% to 9.25%, depending on the city. In Stockton, it's relatively similar, with a sales tax of 9%.
Income
Type
Central Contra Costa
Stockton
Estimated median household income
$127,452
$69,844
Estimated per capita income
$68,702
$26,811
Cost of living index (U.S. average is 100)
139.1
99.1
If you make $50,000 in Stockton, you will have to make $70,182 in Central Contra Costa to maintain the same standard of living.
Geographical Conditions
Central Contra Costa is characterized by rolling hills, picturesque landscapes, and is close to both the seacoast and mountains. Conversely, Stockton is situated in the Central Valley, surrounded by fertile farmland and lies near the San Joaquin River Delta.
Geographical information
Type
Central Contra Costa
Stockton
Land area
261.3 sq. miles
54.7 sq. miles
Population density
1,863.4 people per sq. mile
5,887.7 people per sq. mile
Relative area comparison
Central Contra Costa, CA Stockton, CA
Education
In terms of education, Central Contra Costa is home to some of the best-rated schools in California. In contrast, Stockton's schools struggle in comparison, with lower ratings. Both areas offer a variety of higher education options, with Central Contra Costa hosting Saint Mary's College and Stockton home to the University of the Pacific.
Central Contra Costa has a strong, diverse economy with key sectors in technology, finance, and healthcare. Stockton's economy is largely dependent on agriculture, manufacturing, and services. Both locations offer ample job opportunities, though wage levels may vary significantly.
Biggest Employers
In Central Contra Costa, some of the major employers include Kaiser Permanente, Wells Fargo, and Bank of the West. Meanwhile, Stockton's biggest employers include San Joaquin County, Stockton Unified School District, and St. Joseph's Medical Center.
In Central Contra Costa (Contra Costa County), 66.2% voted for Democrats and 31.1% for Republicans in 2012 Presidential Election. In Stockton (San Joaquin County), 55.6% voted for Democrats and 41.9% for Republicans.
Elections
Type
Democrats
Republicans
Other
Year
Central Contra Costa
Stockton
Central Contra Costa
Stockton
Central Contra Costa
Stockton
2020
71.8%
55.6%
26.4%
41.8%
1.8%
2.6%
2016
67.5%
53.4%
24.5%
39.2%
8.0%
7.5%
2012
66.2%
55.6%
31.1%
41.9%
2.7%
2.5%
2008
68.0%
54.2%
30.2%
43.6%
1.8%
2.2%
2004
62.6%
46.3%
36.7%
53.7%
0.7%
0.0%
2000
59.0%
47.9%
37.2%
49.1%
3.8%
3.0%
1996
55.7%
46.3%
35.2%
44.9%
9.1%
8.8%
Breakdown of population affiliated with a religious congregation
Type
Adherents
Congregations
Religion
Central Contra Costa
Stockton
Central Contra Costa
Stockton
CATHOLIC CHURCH
21.8%
26.8%
5.2%
4.0%
SOUTHERN BAPTIST CONVENTION
1.3%
1.1%
10.0%
10.2%
MUSLIM ESTIMATE
1.0%
1.5%
1.4%
2.0%
EPISCOPAL CHURCH
0.5%
0.1%
2.3%
0.7%
EVANGELICAL LUTHERAN CHURCH IN AMERICA
0.5%
0.2%
2.0%
0.7%
SEVENTH DAY ADVENTIST CHURCH
0.3%
0.7%
1.5%
3.1%
LUTHERAN CHURCH
0.2%
0.4%
2.0%
1.1%
CHRISTIAN REFORMED CHURCH NORTH AMERICA
0.0%
0.4%
0.3%
1.3%
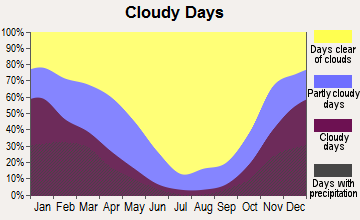
Weather
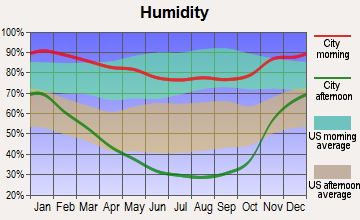
Weather-wise, Central Contra Costa offers a Mediterranean climate with warm, dry summers and cool, wet winters while Stockton experiences hot, dry summers, and mild winters. Both locations offer plenty of sunshine annually and are ideal for those who prefer warm weather.
Weather and climate
Type
Central Contra Costa
Stockton
Temperature - Average
59.1°F
60.9°F
Humidity - Average morning or afternoon humidity
82.2%
63.2%
Humidity - Differences between morning and afternoon humidity
29.3%
59%
Humidity - Maximum monthly morning or afternoon humidity
88.1%
86%
Humidity - Minimum monthly morning or afternoon humidity
58.8%
27%
Precipitation - Yearly average
21.8 in
16.6 in
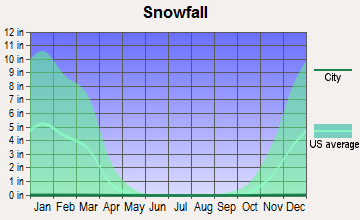
Snowfall - Yearly average
0 in
0 in
Clouds - Number of days clear of clouds
27.7%
30.7%
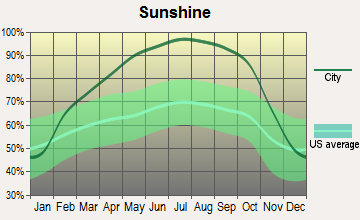
Sunshine amount - Average
73.3%
81.6%
Sunshine amount - Differences during a year
22.4%
44.4%
Sunshine amount - Maximum monthly
77.2%
91.9%
Sunshine amount - Minimum monthly
54.7%
47.5%
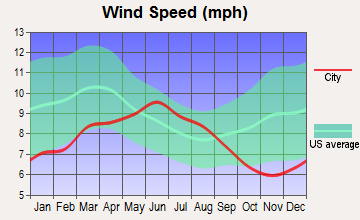
Wind speed - Average
11.1 mph
8.3 mph
Average climate in Central Contra Costa, California
Average climate in Stockton, California
Air pollution
Type
AQI
CO
NO2
OZONE
PB
PM10
PM25
SO2
Year
Central Contra Costa
Stockton
Central Contra Costa
Stockton
Central Contra Costa
Stockton
Central Contra Costa
Stockton
Central Contra Costa
Stockton
Stockton
Central Contra Costa
Stockton
Central Contra Costa
Stockton
2018
105
124
0.32
0.30
6.9
12.2
22.1
23.2
0.012
0.006
30.5
N/A
13.3
16.5
0.6
0.8
2017
102
108
0.30
0.29
7.0
11.3
25.9
23.4
0.008
0.005
27.4
N/A
11.9
12.3
0.7
1.5
2016
86
111
0.28
0.26
6.5
12.2
25.2
21.7
0.005
0.005
22.2
N/A
6.5
12.7
0.8
1.5
2015
94
113
0.34
0.27
7.6
11.9
25.8
24.0
0.004
0.005
26.3
N/A
8.8
12.7
0.5
1.0
2014
95
109
0.35
0.26
7.8
13.4
25.2
26.1
0.005
0.005
26.9
N/A
6.9
11.5
0.5
0.8
2013
93
111
0.34
0.31
9.3
15.5
21.5
23.8
0.004
0.005
29.8
N/A
7.8
15.7
0.5
0.6
2012
93
114
0.32
0.19
8.5
14.4
25.2
24.2
0.003
0.005
24.0
N/A
8.3
12.4
0.3
0.7
2011
99
105
0.35
0.25
9.0
15.5
23.0
22.1
0.003
0.003
23.5
N/A
9.8
12.6
0.6
0.9
2010
93
96
0.31
0.14
8.6
13.9
23.2
21.9
0.014
0.003
14.0
N/A
8.5
9.1
0.5
1.1
2009
104
98
0.31
0.20
9.5
15.3
23.7
21.1
0.006
0.005
15.8
N/A
10.3
6.0
0.6
1.0
2008
120
107
0.36
0.26
10.2
16.8
26.1
22.7
0.006
N/A
24.7
N/A
12.1
10.2
0.8
1.1
2007
104
110
0.36
0.34
10.7
16.4
24.1
21.5
0.006
0.009
19.5
N/A
9.7
12.5
0.7
1.1
2006
109
94
0.39
0.41
10.9
18.4
26.0
22.1
N/A
N/A
N/A
N/A
11.1
N/A
0.8
2.1
2005
104
81
0.43
0.44
11.6
17.2
22.7
20.1
N/A
N/A
N/A
N/A
10.4
N/A
1.0
2.0
2004
112
82
0.46
0.47
12.4
17.1
22.6
19.9
0.004
N/A
25.2
N/A
11.9
N/A
1.1
1.6
2003
84
89
0.51
0.55
13.4
18.4
23.1
19.1
N/A
N/A
26.1
N/A
N/A
N/A
0.7
2.2
2002
88
86
0.51
0.53
14.7
20.5
23.3
18.9
0.008
0.007
29.2
N/A
N/A
N/A
0.9
2.5
2001
90
97
0.56
0.54
15.4
19.4
22.1
19.7
0.008
0.006
28.3
N/A
N/A
N/A
1.2
2.1
2000
95
99
0.67
0.64
15.9
21.2
20.8
18.9
0.013
0.007
25.9
N/A
N/A
N/A
1.6
1.6
Natural disasters
Type
Central Contra Costa
Stockton
Tornado activity compared to U.S. average
9.4%
10.1%
Earthquake activity compared to U.S. average
7,786.2%
8,060.1%
Natural disasters compared to U.S. average
18%
20%
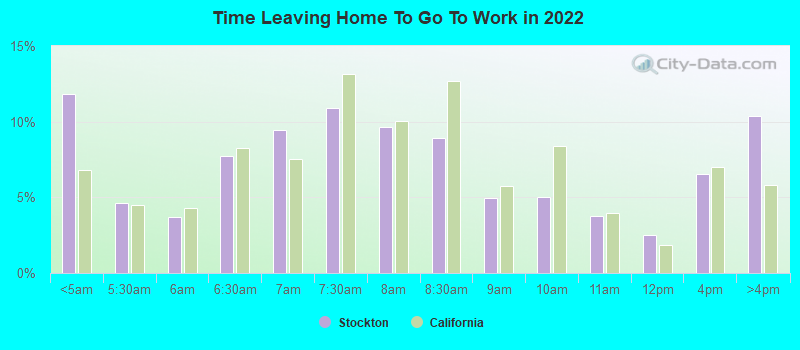
Transportation
Both regions offer multiple options for public transit, including buses, BART (in Central Contra Costa), and the Altamont Corridor Express (in Stockton). Commuting times are reasonable, with many residents in Central Contra Costa commuting to jobs in San Francisco and Oakland, while Stockton residents often work within the city or in nearby Modesto or Sacramento.
Transport
Type
Central Contra Costa
Stockton
Amtrak stations
0
2
Amtrak stations nearby
3
3
FAA registered aircraft
0
146
FAA registered aircraft manufacturers and dealers
0
9
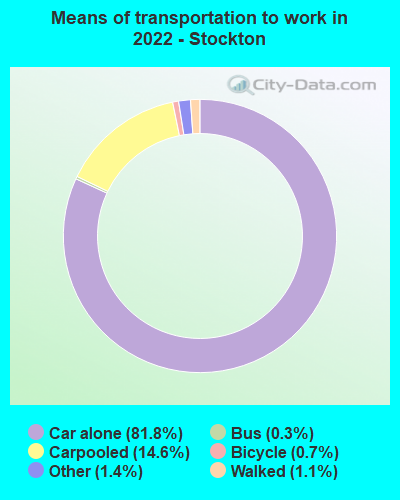
Means of transportation to work
Type
Central Contra Costa
Stockton
Bicycle
0.5%
0.2%
Bus
1%
0.6%
Carpooled
9.9%
13.3%
Car alone
72.3%
83.6%
Ferryboat
0%
0.1%
Motorcycle
0.2%
0.1%
Railroad
0.8%
0.1%
Subway
7.7%
0.1%
Walked
1.5%
1%
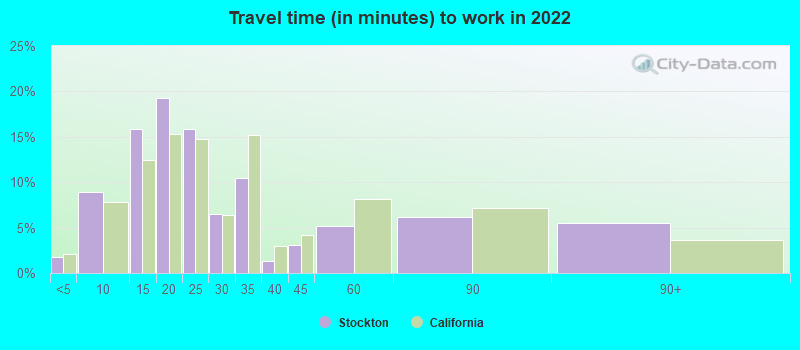
Average travel time to work
Type
Central Contra Costa
Stockton
Average
31.8 min
29.9 min
Real Estate
Real estate in Central Contra Costa is highly sought-after thanks to its proximity to San Francisco, with median home prices significantly above the state average. On the other hand, property prices in Stockton are more affordable but still above the national average.
Neighborhoods
Many neighborhoods in Central Contra Costa are upscale with a suburban feel, while Stockton has a more urban environment with diverse neighborhoods. Both offer a myriad of options for every lifestyle, yet the experience may differ significantly based on the neighborhood's demographics and amenities.
Houses and residents
Type
Central Contra Costa
Stockton
Houses
183,777
102,642
Average household size (people)
2.5
3.2
Houses occupied
179,136 (97.5%)
97,447 (94.9%)
Houses occupied by owners
127,889 (71.4%)
53,081 (54.5%)
Houses occupied by renters
51,247 (28.6%)
44,366 (45.5%)
Median rent asked for vacant for-rent units
$2,527
$586.05
Median price asked for vacant for-sale houses and condos
$1,269,474
$363,278
Estimated median house or condo value
Over $1,000,000
$382,900
Median number of rooms in apartments
4.3
4.4
Median number of rooms in houses and condos
6.5
6.2
Renting percentage
30.3%
48.4%
Housing density (houses/condos per square mile)
703.4
1,876.1
Household income disparities
35.9%
42.3%
Housing units without a mortgage
20,208 (18.2%)
338 (0.9%)
Housing units with both a second mortgage and home equity loan
418 (0.4%)
2,064 (5.6%)
Housing units with a mortgage
90,899 (81.8%)
36,674 (99.1%)
Housing units with a home equity loan
13,612 (12.3%)
329 (0.9%)
Housing units with a second mortgage
13,614 (12.3%)
2,814 (7.6%)
Housing units lacking complete kitchen facilities
0.5%
2.3%
Housing units lacking complete plumbing facilities
Self-employed workers in own not incorporated business
22,217
7,637
State government workers
6,705
6,210
Unpaid family workers
617
95
Industries and Occupations
Technological, healthcare, and financial occupations dominate Central Contra Costa's job market. In Stockton, the key industries are agriculture, manufacturing, and services. Employment growth in both areas is projected to continue, offering positive prospects for job seekers.
Both Central Contra Costa and Stockton provide quality healthcare facilities. Central Contra Costa boasts renowned medical centers like the John Muir Health Walnut Creek and Concord campuses, while Stockton is home to the well-regarded St. Joseph's Medical Center and Dameron Hospital.
Infrastructure in both Central Contra Costa and Stockton is robust, with well-maintained roads, bridges, and public facilities. Both locations are well connected by freeways and offer easy access to major cities like San Francisco and Sacramento.
Infrastructure
Type
Central Contra Costa
Stockton
TV stations
24
14
Culture and Food
Central Contra Costa offers a mix of upscale, cosmopolitan culture with diverse dining options, including Michelin-starred restaurants. Meanwhile, Stockton's cultural scene is vibrant and eclectic, with many family-run eateries featuring diverse cuisines, food festivals, and a thriving music scene.
Sports Teams
While Central Contra Costa doesn't have any major professional sports teams, residents can enjoy a plethora of outdoor recreational activities. Stockton hosts several minor league sports teams, including basketball, baseball, and hockey.
 Central Contra Costa, CA
 Stockton, CA