Both Arlington, VA, and Charlotte, NC, offer unique living experiences to residents and tourists alike. Arlington has a high standard of education, low crime rate, and robust economy but is far more costly. On the other hand, Charlotte boasts a lower cost of living, good weather, and a thriving sports culture. To understand the differences better, we'll look at various aspects, from crime and safety to health care.
Distance between
Charlotte, NC and
Arlington, VA : 326.3 miles
Charlotte's population is larger by 278%. Its population has grown by 338,881 people (62.7%) since 2000. The population of Arlington has grown by 43,512 people (23.0%) during that time.
While neither city is immune to crime, safety tends to favor Arlington, which regularly ranks as one of the safest cities in Virginia and the US at large. Charlotte, on the other hand, has higher crime rates than the national average, which can be a concern for potential residents and tourists. However, certain neighborhoods have notably lower crime rates than others.
Cost of Living
The cost of living in Arlington is considerably higher than the national average, driven mainly by housing costs. Compared to Charlotte, where the cost of living is closer to the national average, residents get more value for their money. Everything from groceries to transportation tends to be cheaper in Charlotte than in Arlington.
Income Tax
Virginia, home to Arlington, has a progressive income tax with rates ranging from 2% to 5.75%. North Carolina, where Charlotte is located, has a flat income tax rate of 5.25%.
Property Tax
Arlington homeowners pay considerably more for property taxes, with an average rate of 0.996% compared to Charlotte's 0.792%.
Sales Tax
The combined city and state sales tax rate is higher in Arlington at 6%. In Charlotte, the combined state and local sales taxes max out at 7.25%.
Income
Type
Charlotte
Arlington
Estimated median household income
$70,869
$125,651
Estimated per capita income
$44,593
$80,996
Cost of living index (U.S. average is 100)
93.2
171.8
If you make $50,000 in Charlotte, you will have to make $92,167 in Arlington to maintain the same standard of living.
Geographical Conditions
Arlington, located in Northern Virginia, adjacent to Washington D.C., is mostly flat, urbanized and densely populated. Charlotte, sitting at the foothills of the Appalachian Mountains, is graced with hills, lakes, and trees, which lends to its picturesque setting.
Arlington boasts one of the highest-ranked education systems in the country, providing excellent public schools plus a strong network of private institutions. Charlotte also offers a wide range of quality public and private schools, though the educational attainment rate tends to be slightly less than in Arlington. Both cities have several colleges and universities within easy reach.
Arlington enjoys a robust and diversified economy, with a notable presence in the government, defense, and technology sectors. It boasts a lower unemployment rate compared to the national average. Charlotte possesses a diversified economy as well, primarily centered around the finance industry, and is regarded as the second-largest banking center in the US.
Biggest Employers
Arlington's largest employers include the Department of Defense, Department of Justice, and Deloitte. In Charlotte, the major employers are Bank of America, Wells Fargo, and Carolinas Healthcare System.
In Charlotte (Mecklenburg County), 60.8% voted for Democrats and 38.3% for Republicans in 2012 Presidential Election. In Arlington (Arlington County), 69.3% voted for Democrats and 29.4% for Republicans.
Elections
Type
Democrats
Republicans
Other
Year
Charlotte
Arlington
Charlotte
Arlington
Charlotte
Arlington
2020
66.8%
80.6%
31.6%
17.1%
1.6%
2.3%
2016
62.3%
75.8%
32.9%
16.6%
4.8%
7.5%
2012
60.8%
69.3%
38.3%
29.4%
0.9%
1.3%
2008
62.0%
71.8%
37.6%
27.2%
0.5%
1.0%
2004
51.7%
67.6%
48.0%
31.3%
0.3%
1.1%
2000
48.4%
60.4%
51.1%
34.3%
0.5%
5.3%
1996
48.6%
60.5%
45.9%
34.6%
5.5%
4.9%
Breakdown of population affiliated with a religious congregation
Type
Adherents
Congregations
Religion
Charlotte
Arlington
Charlotte
Arlington
SOUTHERN BAPTIST CONVENTION
9.0%
1.3%
19.0%
16.8%
CATHOLIC CHURCH
8.5%
14.6%
1.8%
6.2%
AMERICAN BAPTIST CHURCHES IN THE USA
2.3%
0.5%
1.1%
2.7%
EPISCOPAL CHURCH
1.2%
2.0%
1.3%
8.0%
EVANGELICAL LUTHERAN CHURCH IN AMERICA
0.9%
0.6%
1.8%
2.7%
PRESBYTERIAN CHURCH IN AMERICA
0.6%
0.1%
1.9%
1.8%
SEVENTH DAY ADVENTIST CHURCH
0.5%
0.1%
1.5%
1.8%
MUSLIM ESTIMATE
0.3%
1.7%
1.2%
0.9%
Weather
Charlotte provides warmer weather with a humid subtropical climate, offering hot summers and mild winters. It's an ideal location for outdoor activities year-round. In contrast, Arlington experiences a humid subtropical climate characterized by hot, humid summers and generally mild to cool winters, with more significant seasonal changes than Charlotte.
Weather and climate
Type
Charlotte
Arlington
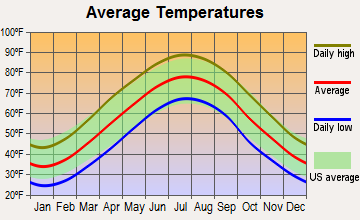
Temperature - Average
61°F
56.6°F
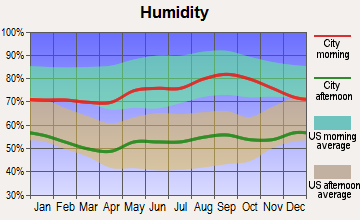
Humidity - Average morning or afternoon humidity
72.3%
68.8%
Humidity - Differences between morning and afternoon humidity
41%
33%
Humidity - Maximum monthly morning or afternoon humidity
87%
81%
Humidity - Minimum monthly morning or afternoon humidity
46%
48%
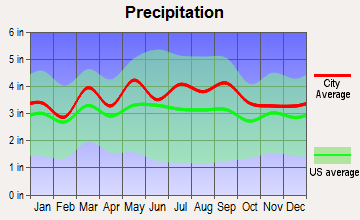
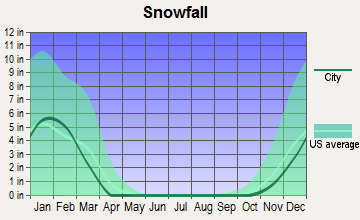
Precipitation - Yearly average
44.5 in
43.4 in
Snowfall - Yearly average
10.2 in
32.4 in
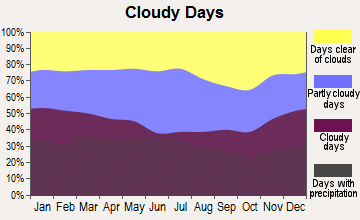
Clouds - Number of days clear of clouds
18.1%
15.9%
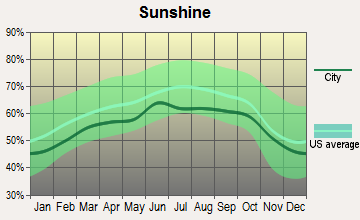
Sunshine amount - Average
69.8%
61.5%
Sunshine amount - Differences during a year
14%
21%
Sunshine amount - Maximum monthly
70%
66%
Sunshine amount - Minimum monthly
56%
45%
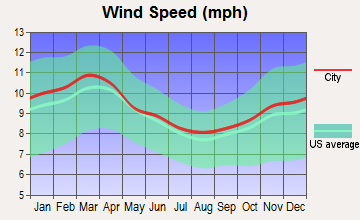
Wind speed - Average
6.9 mph
9.7 mph
Average climate in Charlotte, North Carolina
Average climate in Arlington, Virginia
Air pollution
Type
AQI
CO
NO2
OZONE
PB
PM10
PM25
SO2
Year
Charlotte
Arlington
Charlotte
Arlington
Charlotte
Arlington
Charlotte
Arlington
Charlotte
Arlington
Charlotte
Arlington
Charlotte
Arlington
Charlotte
Arlington
2018
75
88
0.24
0.30
6.3
9.1
27.8
26.2
N/A
N/A
15.5
16.4
8.2
8.4
0.2
0.7
2017
77
84
0.25
0.25
7.0
9.5
28.0
27.7
N/A
N/A
16.3
16.5
8.8
9.0
0.2
0.7
2016
82
98
0.25
0.25
7.6
10.6
28.7
27.5
N/A
0.002
N/A
17.2
8.4
8.7
0.2
0.8
2015
76
91
0.25
0.34
8.1
10.9
27.6
26.7
N/A
0.002
N/A
17.0
8.6
9.5
0.2
1.1
2014
76
85
0.26
0.27
8.5
10.9
26.3
26.2
N/A
0.002
N/A
17.1
9.3
9.3
0.3
1.0
2013
71
90
0.29
0.33
8.4
10.9
25.5
26.6
N/A
0.002
N/A
17.3
8.6
10.1
0.3
0.8
2012
95
104
0.28
0.33
8.7
11.7
27.3
27.9
N/A
0.002
N/A
N/A
9.7
10.9
0.3
1.0
2011
94
105
0.34
0.18
10.1
12.3
28.9
28.4
N/A
0.002
N/A
N/A
11.2
11.0
0.6
1.5
2010
97
114
0.33
0.23
11.8
12.9
28.0
29.8
N/A
0.003
N/A
N/A
11.6
9.7
1.0
2.5
2009
82
90
0.30
0.24
10.0
12.7
25.4
24.7
N/A
0.002
N/A
N/A
11.1
8.1
0.9
2.7
2008
102
103
0.32
0.23
11.2
13.3
27.6
25.8
N/A
0.003
N/A
N/A
13.0
8.9
2.1
4.3
2007
108
113
0.37
0.28
13.9
15.6
29.1
27.7
0.001
0.004
N/A
N/A
14.5
10.4
3.0
4.5
2006
107
114
0.44
0.49
13.9
17.7
27.3
25.9
0.000
0.004
N/A
N/A
14.8
10.9
3.3
4.3
2005
109
105
0.53
0.30
14.6
21.0
30.6
23.6
0.000
0.006
N/A
N/A
15.2
11.7
2.7
5.7
2004
89
114
0.53
0.22
14.6
21.6
28.9
23.5
0.001
0.004
N/A
N/A
N/A
11.3
2.8
5.9
2003
85
108
0.57
0.36
15.6
26.0
27.6
21.7
0.003
N/A
N/A
N/A
N/A
12.2
3.0
6.1
2002
103
131
0.63
0.48
15.3
21.8
32.6
25.9
0.003
N/A
N/A
N/A
N/A
N/A
2.7
6.0
2001
108
111
0.72
0.43
17.5
22.1
32.3
24.1
0.005
0.017
N/A
N/A
N/A
N/A
3.9
7.2
2000
107
110
0.79
0.50
18.0
22.7
32.6
20.2
0.014
N/A
N/A
N/A
N/A
N/A
4.4
10.1
Natural disasters
Type
Charlotte
Arlington
Tornado activity compared to U.S. average
111.5%
110%
Earthquake activity compared to U.S. average
79%
43.5%
Natural disasters compared to U.S. average
9%
14%
Transportation
Both cities have public transportation systems, but Arlington's is more comprehensive due to its proximity to Washington DC. This includes the Metro system and extensive bus routes. Charlotte has a bus system and a growing light rail network, but commuting heavily relies on vehicles.
Transport
Type
Charlotte
Arlington
Amtrak stations
1
0
Amtrak stations nearby
2
3
FAA registered aircraft
439
103
FAA registered aircraft manufacturers and dealers
12
5
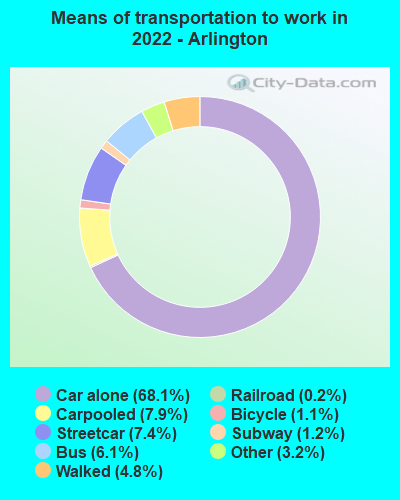
Means of transportation to work
Type
Charlotte
Arlington
Bicycle
0.1%
0.8%
Bus
1.2%
3.6%
Carpooled
8.7%
6.5%
Car alone
86.2%
71.3%
Motorcycle
0.1%
0.1%
Railroad
0.4%
0.4%
Streetcar
0%
7.8%
Subway
0%
1.1%
Taxicab
0.2%
0.4%
Walked
1.5%
6%
Average travel time to work
Type
Charlotte
Arlington
Average
29.6 min
34.8 min
Other means
24.9 min
25.7 min
Public transportation
44.1 min
36.7 min
Private vehicle occupancy
Type
Charlotte
Arlington
Average
1.2
1.1
Drove alone
90%
92.8%
In 2 person carpool
6.9%
6.3%
In 3 person carpool
1.8%
0.8%
In 4 person carpool
0.8%
0.1%
In 5-6 person carpool
0.5%
0%
How many people usually rode to work in the car, truck or van.
Real Estate
Arlington's real estate market is one of the most expensive in Virginia and the country. Prices in Charlotte, while rising, are more affordable and provide a variety of housing options.
Neighborhoods
Both cities provide a variety of neighborhoods catering to different lifestyles. Arlington, being smaller, has a more urban feel with walkable neighborhoods. Charlotte has a mix of urban and suburban neighborhoods, offering more space and less hustle and bustle.
Houses and residents
Type
Charlotte
Arlington
Houses
393,631
119,446
Average household size (people)
2.5
2.1
Median year apartment built
1998
1983
Median year house/condo built
1993
1959
Length of stay in the house since moving in
11.8 years
12.7 years
Houses occupied
365,269 (92.8%)
108,396 (90.7%)
Houses occupied by owners
193,930 (53.1%)
47,577 (43.9%)
Houses occupied by renters
171,339 (46.9%)
60,819 (56.1%)
Median rent asked for vacant for-rent units
$1,482
$3,620
Median monthly housing costs
$1,302
$2,164
Median price asked for vacant for-sale houses and condos
$445,491
$891,291
Estimated median house or condo value
$321,400
$779,400
Median numbers of rooms
5.3
4.1
Median number of rooms in apartments
4
3.3
Median number of rooms in houses and condos
6.6
6.7
Median house price - detached houses
$388,029
Over $1,000,000
Median house price - in 2-unit structures
$184,325
$648,538
Median house price - in 3-to-4-unit structures
$178,624
$442,578
Median house price - in 5 or more unit structures
$433,957
$566,559
Median house price - Townhouses or other attached units
$296,370
$703,291
Median house price - All housing units
$378,423
$877,770
Median house age
26
47
Renting percentage
42.6%
56.7%
Housing density (houses/condos per square mile)
1,624.8
4,617.2
House value disparities
33.3%
24.9%
Household income disparities
44.1%
37.5%
Median household income for houses/condes with a mortgage
$105,905
$201,635
Median household income for apartments without a mortgage
$70,681
$133,857
Housing units without a mortgage
3,089 (2.1%)
596 (1.6%)
Housing units with both a second mortgage and home equity loan
10,553 (7.2%)
3,235 (8.9%)
Housing units with a mortgage
142,912 (97.9%)
35,674 (98.4%)
Housing units with a home equity loan
171 (0.1%)
101 (0.3%)
Housing units with a second mortgage
13,532 (9.3%)
4,221 (11.6%)
House/condo owner moved in on average (years ago)
9
10
House/condo renter moved in on average (years ago)
1
1
Housing units lacking complete kitchen facilities
0.8%
0.7%
Housing units lacking complete plumbing facilities
0.2%
0.2%
Housing units in structures
Housing units in structures
Charlotte
Arlington
One, detached
52.7%
25.1%
One, attached
9.1%
9.6%
Two
0.9%
0.8%
3 or 4
2.9%
3.5%
5 to 9
7.1%
5.2%
10 to 19
9.5%
5.0%
20 to 49
6.2%
4.6%
50 or more
10.3%
46.1%
Mobile homes
1.4%
0.2%
Median real estate property taxes paid for housing units
Self-employed workers in own not incorporated business
25,780
6,119
State government workers
16,519
1,820
Unpaid family workers
1,214
32
Industries and Occupations
Arlington’s economy heavily leans on government, defense, and information technology sectors. It's home to various federal agencies and tech companies. Charlotte, known as the 'Wall Street of the South', is dominated by the banking and financial services industry.
Both cities offer high-quality healthcare. Arlington is close to several highly-ranked hospitals in Washington D.C., including Inova Fairfax Hospital. Charlotte is home to Atrium Health, one of the largest non-profit health systems in the US.
Arlington and Charlotte both offer well-developed infrastructures. Arlington benefits from proximity to DC, with plans for continuous growth and development. Charlotte has been investing significantly in infrastructure, including airport expansion and light rail systems.
Infrastructure
Type
Charlotte
Arlington
Hospitals
37
6
TV stations
16
25
Bank branches located here
202
82
Bank institutions located here
26
25
Main business address for public companies
33
17
Nuclear power plants nearby
2
0
Drinking water stations with no reported violations in the past
24
0
Drinking water stations with reported violations in the past
HMDA - Conventional home purchase loans - Applications denied
Year
Charlotte
Arlington
1999
3,049
226
2000
1,568
196
2001
1,382
164
2002
1,275
146
2003
1,879
288
2004
2,415
461
2005
3,078
589
2006
3,864
563
2007
3,106
412
2008
1,287
272
2009
617
173
Culture and Food
Charlotte is known for its rich southern culture, with a lively arts scene and great food, especially renowned for its barbecue. Arlington, due to its global population and proximity to DC, offers a more international culture and cuisine.
Sports Teams
Sports are prominent in both cities. Charlotte is home to the Panthers (NFL), Hornets (NBA), and a NASCAR Hall of Fame, providing a varied sports culture. Arlington doesn't have a home team but benefits from being close to the sports teams from Washington DC.


 Charlotte, NC
 Arlington, VA