Charlotte, NC and Atlanta, GA, are two vibrant cities in the southeast region of the United States. Each boasts a blend of Southern charm and urban sophistication, offering distinct features and benefits to both residents and tourists alike. However, they have marked differences in areas such as crime rates, cost of living, education, employment opportunities, and culture.
Distance between
Charlotte, NC and
Atlanta, GA : 226.8 miles
Charlotte's population is larger by 77%. Its population has grown by 338,881 people (62.7%) since 2000. The population of Atlanta has grown by 79,987 people (19.2%) during that time.
Both Charlotte and Atlanta have crime rates above the national average, with Atlanta being significantly more so. However, like most cities, crime is concentrated in certain neighborhoods. It's essential to do your research before choosing a place to live or visit. Both cities have proactive police departments and numerous community safety initiatives.
Cost of Living
Overall, the cost of living in Charlotte is somewhat lower than in Atlanta. This difference is driven mostly by housing costs, which are significantly lower in Charlotte. Other living costs, including groceries and healthcare, are roughly comparably priced in the two cities.
Income Tax
The state income tax rate is higher in Georgia than in North Carolina. You'll pay a flat 5.25% in North Carolina, while Georgia uses a range from 1% to 5.75%.
Property Tax
Property taxes are somewhat higher in Atlanta than in Charlotte. However, the exact rate can vary based on your property's city and county.
Sales Tax
Sales tax is higher in Atlanta than in Charlotte. The combined city-other count in Georgia can be as high as 8.9% compared to 7.5% in North Carolina.
Income
Type
Charlotte
Atlanta
Estimated median household income
$70,869
$74,107
Estimated per capita income
$44,593
$55,051
Cost of living index (U.S. average is 100)
93.2
104.3
If you make $50,000 in Charlotte, you will have to make $55,955 in Atlanta to maintain the same standard of living.
Geographical Conditions
Charlotte is located in the piedmont region and is relatively flat, while Atlanta is located in the foothills of the Appalachian Mountains, resulting in a hilly topography.
Both cities are home to well-regarded colleges and universities. Charlotte schools boast a higher graduation rate than Atlanta. However, Atlanta has a more extensive range of institutions and offers a more diverse selection of degree programs.
Atlanta has a larger, more diverse economy, hosting many Fortune 500 companies. However, Charlotte is known as the second-largest banking center in the US and offers many opportunities in the financial sector. Both cities have growing tech sectors.
Biggest Employers
In Charlotte, Bank of America and Wells Fargo are major employers. In contrast, Atlanta is home to global headquarters of companies like Coca-Cola, Delta Airlines, and Home Depot.
In Charlotte (Mecklenburg County), 60.8% voted for Democrats and 38.3% for Republicans in 2012 Presidential Election. In Atlanta (Fulton County), 64.3% voted for Democrats and 34.5% for Republicans.
Elections
Type
Democrats
Republicans
Other
Year
Charlotte
Atlanta
Charlotte
Atlanta
Charlotte
Atlanta
2020
66.8%
72.6%
31.6%
26.2%
1.6%
1.2%
2016
62.3%
67.8%
32.9%
26.9%
4.8%
5.3%
2012
60.8%
64.3%
38.3%
34.5%
0.9%
1.2%
2008
62.0%
67.2%
37.6%
32.2%
0.5%
0.6%
2004
51.7%
59.4%
48.0%
40.0%
0.3%
0.7%
2000
48.4%
57.9%
51.1%
39.9%
0.5%
2.2%
1996
48.6%
58.9%
45.9%
36.9%
5.5%
4.1%
Breakdown of population affiliated with a religious congregation
Type
Adherents
Congregations
Religion
Charlotte
Atlanta
Charlotte
Atlanta
SOUTHERN BAPTIST CONVENTION
9.0%
7.9%
19.0%
14.7%
CATHOLIC CHURCH
8.5%
9.9%
1.8%
2.4%
AMERICAN BAPTIST CHURCHES IN THE USA
2.3%
0.8%
1.1%
1.1%
EPISCOPAL CHURCH
1.2%
2.1%
1.3%
2.1%
EVANGELICAL LUTHERAN CHURCH IN AMERICA
0.9%
0.6%
1.8%
1.5%
PRESBYTERIAN CHURCH IN AMERICA
0.6%
0.1%
1.9%
1.3%
SEVENTH DAY ADVENTIST CHURCH
0.5%
1.2%
1.5%
1.5%
MUSLIM ESTIMATE
0.3%
1.4%
1.2%
1.7%
Weather
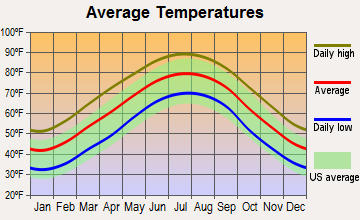
Both cities have humid subtropical climates, but Atlanta tends to have slightly colder winters due to its higher elevation. Summers in both cities are hot and humid. Charlotte usually has less rainfall and is less prone to severe weather such as tornadoes compared to Atlanta.
Weather and climate
Type
Charlotte
Atlanta
Temperature - Average
61°F
61.7°F
Humidity - Average morning or afternoon humidity
72.3%
73.9%
Humidity - Differences between morning and afternoon humidity
41%
38%
Humidity - Maximum monthly morning or afternoon humidity
87%
87%
Humidity - Minimum monthly morning or afternoon humidity
46%
49%
Precipitation - Yearly average
44.5 in
51.4 in
Snowfall - Yearly average
10.2 in
4 in
Clouds - Number of days clear of clouds
18.1%
18.3%
Sunshine amount - Average
69.8%
65.6%
Sunshine amount - Differences during a year
14%
17%
Sunshine amount - Maximum monthly
70%
67%
Sunshine amount - Minimum monthly
56%
50%
Wind speed - Average
6.9 mph
9 mph
Average climate in Charlotte, North Carolina
Average climate in Atlanta, Georgia
Air pollution
Type
AQI
CO
NO2
OZONE
PB
PM10
PM25
SO2
Year
Charlotte
Atlanta
Charlotte
Atlanta
Charlotte
Atlanta
Charlotte
Atlanta
Charlotte
Atlanta
Charlotte
Atlanta
Charlotte
Atlanta
Charlotte
Atlanta
2018
75
84
0.24
0.27
6.3
N/A
27.8
24.7
N/A
N/A
15.5
17.5
8.2
10.6
0.2
0.8
2017
77
87
0.25
0.31
7.0
N/A
28.0
24.7
N/A
N/A
16.3
17.5
8.8
11.3
0.2
1.2
2016
82
105
0.25
0.31
7.6
N/A
28.7
25.9
N/A
N/A
N/A
17.2
8.4
11.1
0.2
1.0
2015
76
91
0.25
0.31
8.1
N/A
27.6
23.9
N/A
N/A
N/A
17.6
8.6
10.2
0.2
0.9
2014
76
88
0.26
0.31
8.5
N/A
26.3
24.0
N/A
N/A
N/A
18.4
9.3
9.1
0.3
1.1
2013
71
88
0.29
0.30
8.4
N/A
25.5
23.7
N/A
N/A
N/A
18.0
8.6
8.7
0.3
1.0
2012
95
109
0.28
0.33
8.7
N/A
27.3
26.2
N/A
N/A
N/A
19.5
9.7
9.8
0.3
1.1
2011
94
98
0.34
0.33
10.1
N/A
28.9
27.5
N/A
N/A
N/A
21.2
11.2
12.0
0.6
1.7
2010
97
102
0.33
0.35
11.8
N/A
28.0
25.8
N/A
N/A
N/A
18.5
11.6
12.5
1.0
1.9
2009
82
96
0.30
N/A
10.0
N/A
25.4
25.2
N/A
N/A
N/A
18.5
11.1
13.8
0.9
1.7
2008
102
99
0.32
0.53
11.2
15.3
27.6
31.2
N/A
0.003
N/A
22.5
13.0
16.3
2.1
2.5
2007
108
124
0.37
0.45
13.9
17.0
29.1
33.1
0.001
0.003
N/A
29.4
14.5
18.1
3.0
2.7
2006
107
129
0.44
0.58
13.9
17.9
27.3
31.3
0.000
0.003
N/A
22.9
14.8
19.7
3.3
3.4
2005
109
123
0.53
0.55
14.6
17.2
30.6
29.0
0.000
0.005
N/A
25.5
15.2
15.8
2.7
3.2
2004
89
118
0.53
0.54
14.6
16.9
28.9
28.8
0.001
0.004
N/A
22.9
N/A
14.6
2.8
2.8
2003
85
112
0.57
0.56
15.6
16.4
27.6
26.7
0.003
0.004
N/A
22.2
N/A
15.4
3.0
3.0
2002
103
120
0.63
0.60
15.3
19.4
32.6
27.9
0.003
N/A
N/A
23.2
N/A
13.1
2.7
3.0
2001
108
117
0.72
0.69
17.5
23.3
32.3
27.2
0.005
N/A
N/A
27.0
N/A
N/A
3.9
3.1
2000
107
132
0.79
0.50
18.0
22.9
32.6
31.2
0.014
N/A
N/A
28.4
N/A
N/A
4.4
3.2
Natural disasters
Type
Charlotte
Atlanta
Tornado activity compared to U.S. average
111.5%
159.5%
Earthquake activity compared to U.S. average
79%
153.4%
Natural disasters compared to U.S. average
9%
15%
Transportation
Public transit is more comprehensive in Atlanta, with heavy rail, bus, and light rail options available. Charlotte has a bus system and light rail, but depending on your destination, you may find having a car more convenient.
Transport
Type
Charlotte
Atlanta
Amtrak stations
1
1
Amtrak stations nearby
2
1
FAA registered aircraft
439
1
FAA registered aircraft manufacturers and dealers
12
28
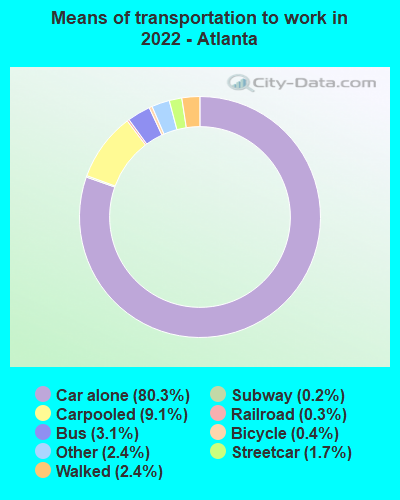
Means of transportation to work
Type
Charlotte
Atlanta
Bicycle
0.1%
0.5%
Bus
1.2%
2.1%
Carpooled
8.7%
7.6%
Car alone
86.2%
84%
Motorcycle
0.1%
0.1%
Railroad
0.4%
0.2%
Streetcar
0%
1.1%
Subway
0%
0.4%
Taxicab
0.2%
0.3%
Walked
1.5%
1.9%
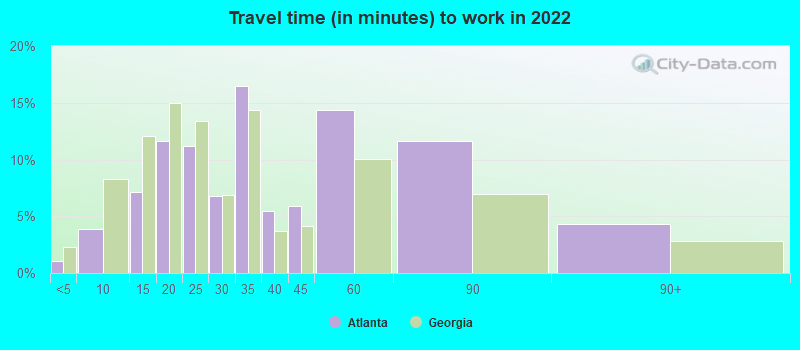
Average travel time to work
Type
Charlotte
Atlanta
Average
29.6 min
34.9 min
Other means
24.9 min
24.4 min
Public transportation
44.1 min
47.8 min
Private vehicle occupancy
Type
Charlotte
Atlanta
Average
1.2
1.1
Drove alone
90%
92.5%
In 2 person carpool
6.9%
6.7%
In 3 person carpool
1.8%
0.6%
In 4 person carpool
0.8%
0.3%
In 5-6 person carpool
0.5%
0%
How many people usually rode to work in the car, truck or van.
Real Estate
Real estate is typically less expensive in Charlotte, offering more square footage for your dollar. In contrast, Atlanta real estate can be quite costly, especially in preferred neighborhoods within or close to the city center.
Neighborhoods
Both cities have diverse neighborhoods catering to different tastes and lifestyles. Atlanta is known for its trendy urban districts like Buckhead and Midtown with dense, walkable areas. Charlotte's neighborhoods, such as Dilworth and Myers Park, offer a suburban feel while still being close to the city center.
Houses and residents
Type
Charlotte
Atlanta
Houses
393,631
253,355
Average household size (people)
2.5
2.1
Median year apartment built
1998
1996
Median year house/condo built
1993
1976
Length of stay in the house since moving in
11.8 years
12.2 years
Houses occupied
365,269 (92.8%)
232,720 (91.9%)
Houses occupied by owners
193,930 (53.1%)
113,092 (48.6%)
Houses occupied by renters
171,339 (46.9%)
119,628 (51.4%)
Median rent asked for vacant for-rent units
$1,482
$1,226
Median monthly housing costs
$1,302
$1,504
Median price asked for vacant for-sale houses and condos
$445,491
$325,147
Estimated median house or condo value
$321,400
$375,500
Median numbers of rooms
5.3
4.5
Median number of rooms in apartments
4
3.5
Median number of rooms in houses and condos
6.6
6.2
Median house price - detached houses
$388,029
$585,854
Median house price - in 2-unit structures
$184,325
$359,451
Median house price - in 3-to-4-unit structures
$178,624
$453,504
Median house price - in 5 or more unit structures
$433,957
$356,868
Median house price - mobile homes
$52,977
$149,278
Median house price - Townhouses or other attached units
$296,370
$383,334
Median house price - All housing units
$378,423
$508,525
Median house age
26
34
Renting percentage
42.6%
55.1%
Housing density (houses/condos per square mile)
1,624.8
1,923
House value disparities
33.3%
36.3%
Household income disparities
44.1%
47.8%
Median household income for houses/condes with a mortgage
$105,905
$123,344
Median household income for apartments without a mortgage
$70,681
$75,939
Housing units without a mortgage
3,089 (2.1%)
1,022 (1.3%)
Housing units with both a second mortgage and home equity loan
10,553 (7.2%)
5,566 (7%)
Housing units with a mortgage
142,912 (97.9%)
78,250 (98.7%)
Housing units with a home equity loan
171 (0.1%)
58 (0.1%)
Housing units with a second mortgage
13,532 (9.3%)
7,203 (9.1%)
House/condo owner moved in on average (years ago)
9
7
House/condo renter moved in on average (years ago)
1
1
Housing units lacking complete kitchen facilities
0.8%
2%
Housing units lacking complete plumbing facilities
0.2%
1.5%
Housing units in structures
Housing units in structures
Charlotte
Atlanta
One, detached
52.7%
37.5%
One, attached
9.1%
6.6%
Two
0.9%
2.4%
3 or 4
2.9%
3.9%
5 to 9
7.1%
5.9%
10 to 19
9.5%
5.7%
20 to 49
6.2%
6.8%
50 or more
10.3%
30.7%
Mobile homes
1.4%
0.5%
Median real estate property taxes paid for housing units
Self-employed workers in own not incorporated business
25,780
15,892
State government workers
16,519
13,288
Unpaid family workers
1,214
550
Industries and Occupations
Charlotte is internationally recognized for its financial sector. Atlanta has a diverse economy with thriving sectors such as film, TV production, transportation, logistics, and information technology. Both cities have growing healthcare and education sectors.
Both cities have access to leading healthcare systems. Atlanta is home to esteemed institutions like Emory Healthcare, while Charlotte has Atrium Health and Novant Health.
Health (county statistics)
Type
Charlotte
Atlanta
General health status score of residents in this county from 1 (poor) to 5 (excellent)
Both cities have excellent infrastructure, with major airports and extensive highway systems. Traffic can be a challenge in Atlanta due to its size and density, while Charlotte has a relatively more compact urban area.
Infrastructure
Type
Charlotte
Atlanta
Hospitals
37
46
TV stations
16
22
Arenas or stadiums
3
6
Bank branches located here
202
235
Bank institutions located here
26
41
Main business address for public companies
33
85
Nuclear power plants nearby
2
0
Drinking water stations with no reported violations in the past
24
5
Drinking water stations with reported violations in the past
HMDA - Conventional home purchase loans - Applications denied
Year
Charlotte
Atlanta
1999
3,049
1,775
2000
1,568
1,902
2001
1,382
1,552
2002
1,275
1,683
2003
1,879
3,212
2004
2,415
4,962
2005
3,078
9,078
2006
3,864
10,866
2007
3,106
6,626
2008
1,287
2,140
2009
617
731
Culture and Food
Both cities are steeped in Southern culture and history. Atlanta is known for its Civil Rights history and a food scene shaped by various cultures. Charlotte, on the other hand, is known for its active arts scene and famous barbeque cuisine.
Sports Teams
Both cities have strong sports cultures. Atlanta has teams in three major professional sports (Falcons-NFL, Hawks-NBA, Braves-MLB). Charlotte has the Panthers (NFL) and Hornets (NBA), along with a strong motorsports presence.


 Charlotte, NC
 Atlanta, GA