Charlotte, North Carolina, and Baton Rouge, Louisiana, are two diverse cities steeped in their unique histories and cultures. Both cities have their attractions and features that make them appealing for relocation and tourism. This comparative guide will help you understand the differences and similarities between these two cities, covering aspects such as crime and safety, cost of living, education, employment, infrastructure, real estate, neighborhood culture, taxes, sports, geographical conditions and health care.
Distance between
Charlotte, NC and
Baton Rouge, LA : 682.1 miles
Charlotte's population is larger by 296%. Its population has grown by 338,881 people (62.7%) since 2000. The population of Baton Rouge has decreased by 5,633 people (2.5%) during that time.
According to the FBI's Crime Reporting Program, the crime rate in Baton Rouge is generally higher than in Charlotte. In both cities, however, the local authorities have put several measures in place to ensure the safety of residents and visitors.
Cost of Living
The cost of living in Charlotte is slightly lower than the national average, providing affordable homes, groceries, and transportation. Baton Rouge offers a similar cost of living, but with somewhat cheaper real estate.
Income Tax
In Charlotte, the flat state income tax rate is 5.25%. In Baton Rouge, state income tax ranges from 2% to 6% depending upon the income bracket.
Property Tax
Charlotte's average property tax rate is 0.83%, compared to Baton Rouge's average rate of 0.52%.
Sales Tax
Charlotte has a combined city and state sales tax rate of 7.25%, while Baton Rouge has a higher combined rate of 9.45%.
Income
Type
Charlotte
Baton Rouge
Estimated median household income
$70,869
$41,257
Estimated per capita income
$44,593
$28,621
Cost of living index (U.S. average is 100)
93.2
90.2
If you make $50,000 in Baton Rouge, you will have to make $51,663 in Charlotte to maintain the same standard of living.
Geographical Conditions
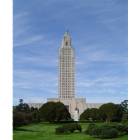
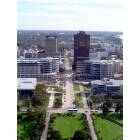
Charlotte sits inland within rolling hills of the Piedmont region. Baton Rouge, located alongside the Mississippi River, overflows with southern charm and historical landmarks.
Both cities value education with Charlotte housing several noteworthy educational institutions and renowned universities. Baton Rouge, home to Louisiana State University, also provides diverse educational opportunities.
Charlotte, a significant banking and financial hub, offers lucrative job opportunities in finance and technology. Conversely, Baton Rouge's economy leans more toward the industrial, petrochemical, and medical sectors.
Biggest Employers
In Charlotte, Bank of America, Wells Fargo, and America Airlines are the biggest employers. Baton Rouge’s largest employers include Louisiana State University, Our Lady of the Lake Regional Medical Center, and ExxonMobil.
In Charlotte (Mecklenburg County), 60.8% voted for Democrats and 38.3% for Republicans in 2012 Presidential Election. In Baton Rouge (East Baton Rouge Parish), 52.0% voted for Democrats and 46.7% for Republicans.
Elections
Type
Democrats
Republicans
Other
Year
Charlotte
Baton Rouge
Charlotte
Baton Rouge
Charlotte
Baton Rouge
2020
66.8%
55.8%
31.6%
42.7%
1.6%
1.5%
2016
62.3%
52.6%
32.9%
43.3%
4.8%
4.1%
2012
60.8%
52.0%
38.3%
46.7%
0.9%
1.3%
2008
62.0%
50.7%
37.6%
48.5%
0.5%
0.8%
2004
51.7%
45.0%
48.0%
54.7%
0.3%
0.3%
2000
48.4%
45.4%
51.1%
52.9%
0.5%
1.7%
1996
48.6%
74.9%
45.9%
22.4%
5.5%
2.7%
Breakdown of population affiliated with a religious congregation
Type
Adherents
Congregations
Religion
Charlotte
Baton Rouge
Charlotte
Baton Rouge
SOUTHERN BAPTIST CONVENTION
9.0%
12.1%
19.0%
16.1%
CATHOLIC CHURCH
8.5%
22.2%
1.8%
5.5%
AMERICAN BAPTIST CHURCHES IN THE USA
2.3%
0.5%
1.1%
0.5%
EPISCOPAL CHURCH
1.2%
1.3%
1.3%
2.1%
EVANGELICAL LUTHERAN CHURCH IN AMERICA
0.9%
0.1%
1.8%
0.5%
PRESBYTERIAN CHURCH IN AMERICA
0.6%
0.2%
1.9%
0.9%
SEVENTH DAY ADVENTIST CHURCH
0.5%
0.3%
1.5%
1.1%
MUSLIM ESTIMATE
0.3%
0.3%
1.2%
1.1%
EVANGELICAL PRESBYTERIAN CHURCH
0.2%
0.4%
0.7%
0.2%
Weather
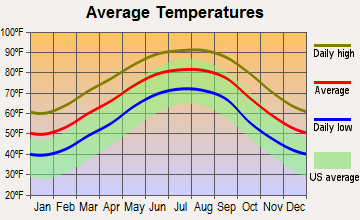
Charlotte experiences a moderate climate with four distinct seasons including a hot summer and a cool winter. Baton Rouge, on the other hand, has a subtropical climate, with hot, humid summers and mild winters, which could be an appealing factor for some.
Weather and climate
Type
Charlotte
Baton Rouge
Temperature - Average
61°F
67°F
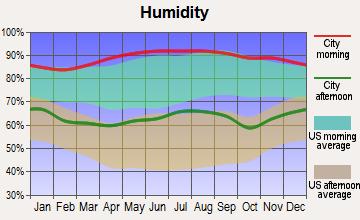
Humidity - Average morning or afternoon humidity
72.3%
80%
Humidity - Differences between morning and afternoon humidity
41%
39%
Humidity - Maximum monthly morning or afternoon humidity
87%
93%
Humidity - Minimum monthly morning or afternoon humidity
46%
54%
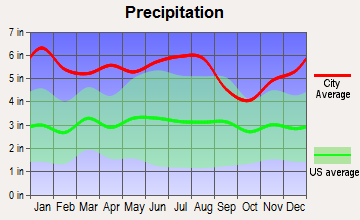
Precipitation - Yearly average
44.5 in
64.4 in
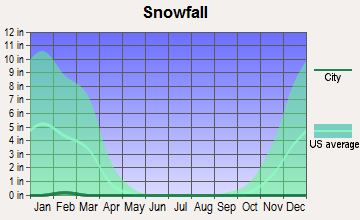
Snowfall - Yearly average
10.2 in
0.4 in
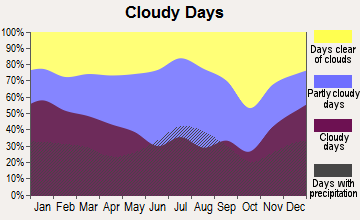
Clouds - Number of days clear of clouds
18.1%
16.5%
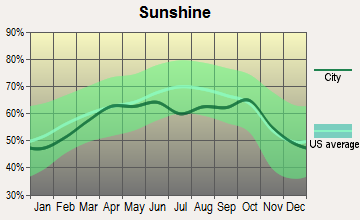
Sunshine amount - Average
69.8%
64.3%
Sunshine amount - Differences during a year
14%
22.5%
Sunshine amount - Maximum monthly
70%
70.4%
Sunshine amount - Minimum monthly
56%
47.9%
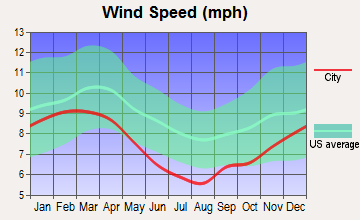
Wind speed - Average
6.9 mph
6.9 mph
Average climate in Charlotte, North Carolina
Average climate in Baton Rouge, Louisiana
Air pollution
Type
AQI
CO
NO2
OZONE
PB
PM10
PM25
SO2
Year
Charlotte
Baton Rouge
Charlotte
Baton Rouge
Charlotte
Baton Rouge
Charlotte
Baton Rouge
Charlotte
Charlotte
Baton Rouge
Charlotte
Baton Rouge
Charlotte
Baton Rouge
2018
75
92
0.24
0.20
6.3
10.1
27.8
22.6
N/A
N/A
15.5
26.9
8.2
10.4
0.2
0.6
2017
77
82
0.25
0.21
7.0
10.2
28.0
25.3
N/A
N/A
16.3
22.5
8.8
10.3
0.2
0.4
2016
82
78
0.25
0.22
7.6
10.6
28.7
23.0
N/A
N/A
N/A
25.5
8.4
11.4
0.2
1.1
2015
76
97
0.25
0.22
8.1
9.4
27.6
24.1
N/A
N/A
N/A
26.2
8.6
12.1
0.2
1.1
2014
76
91
0.26
0.26
8.5
10.3
26.3
23.6
N/A
N/A
N/A
24.1
9.3
10.0
0.3
1.2
2013
71
90
0.29
0.20
8.4
9.7
25.5
24.2
N/A
N/A
N/A
23.1
8.6
10.0
0.3
0.6
2012
95
96
0.28
0.22
8.7
10.9
27.3
25.5
N/A
N/A
N/A
25.3
9.7
10.3
0.3
0.8
2011
94
104
0.34
0.22
10.1
11.4
28.9
25.8
N/A
N/A
N/A
33.2
11.2
12.6
0.6
1.3
2010
97
112
0.33
0.25
11.8
12.0
28.0
25.9
N/A
N/A
N/A
28.2
11.6
10.5
1.0
1.3
2009
82
97
0.30
0.22
10.0
11.7
25.4
23.0
N/A
N/A
N/A
26.1
11.1
9.2
0.9
1.9
2008
102
99
0.32
0.28
11.2
12.8
27.6
22.3
N/A
N/A
N/A
N/A
13.0
10.9
2.1
2.5
2007
108
115
0.37
0.38
13.9
14.3
29.1
23.0
0.001
N/A
N/A
N/A
14.5
12.2
3.0
2.6
2006
107
120
0.44
0.34
13.9
14.6
27.3
23.4
0.000
N/A
N/A
N/A
14.8
12.7
3.3
3.6
2005
109
122
0.53
0.41
14.6
15.5
30.6
24.7
0.000
N/A
N/A
N/A
15.2
13.1
2.7
4.4
2004
89
106
0.53
0.56
14.6
15.4
28.9
22.8
0.001
N/A
N/A
N/A
N/A
12.1
2.8
3.5
2003
85
124
0.57
0.66
15.6
16.0
27.6
21.5
0.003
N/A
N/A
N/A
N/A
11.0
3.0
3.4
2002
103
104
0.63
0.70
15.3
16.2
32.6
21.8
0.003
N/A
N/A
N/A
N/A
9.7
2.7
2.7
2001
108
109
0.72
0.82
17.5
16.6
32.3
23.5
0.005
N/A
N/A
N/A
N/A
9.6
3.9
3.7
2000
107
135
0.79
0.76
18.0
16.9
32.6
24.0
0.014
N/A
N/A
N/A
N/A
11.0
4.4
3.7
Natural disasters
Type
Charlotte
Baton Rouge
Tornado activity compared to U.S. average
111.5%
167.3%
Earthquake activity compared to U.S. average
79%
54.9%
Natural disasters compared to U.S. average
9%
28%
Transportation
Charlotte offers convenient public transportation with the LYNX light rail system, buses, and bike lanes. Baton Rouge provides a bus transit system but lacks extensive public transit services, making commuting more dependent on personal vehicles.
Transport
Type
Charlotte
Baton Rouge
Amtrak stations
1
1
Amtrak stations nearby
2
1
FAA registered aircraft
439
320
FAA registered aircraft manufacturers and dealers
12
10
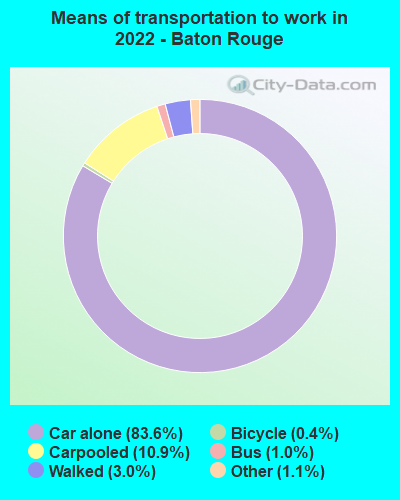
Means of transportation to work
Type
Charlotte
Baton Rouge
Bicycle
0.1%
0.6%
Bus
1.2%
1.1%
Carpooled
8.7%
9.1%
Car alone
86.2%
87.9%
Railroad
0.4%
0%
Taxicab
0.2%
0%
Walked
1.5%
0.7%
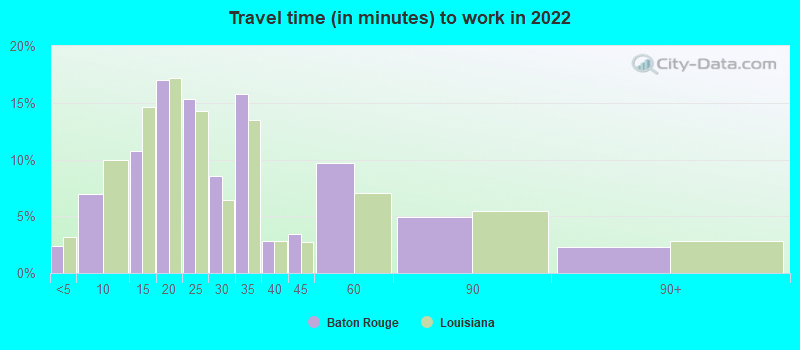
Average travel time to work
Type
Charlotte
Baton Rouge
Average
29.6 min
30.9 min
Other means
24.9 min
21.2 min
Public transportation
44.1 min
41.8 min
Private vehicle occupancy
Type
Charlotte
Baton Rouge
Average
1.2
1.2
Drove alone
90%
88.2%
In 2 person carpool
6.9%
8.3%
In 3 person carpool
1.8%
1%
In 4 person carpool
0.8%
1.7%
In 5-6 person carpool
0.5%
0.2%
In 7+ person carpool
0.1%
0.6%
How many people usually rode to work in the car, truck or van.
Real Estate
Charlotte's expanding real estate market provides both upscale and affordable housing. Baton Rouge offers a diverse range of housing options, with an average cost lower than in Charlotte.
Neighborhoods
Both cities boast a blend of historic and modern neighborhoods. Charlotte is known for its upscale communities like Myers Park, while Baton Rouge is famous for lively districts like Spanish Town.
Houses and residents
Type
Charlotte
Baton Rouge
Houses
393,631
107,002
Average household size (people)
2.5
2.4
Median year apartment built
1998
1979
Median year house/condo built
1993
1971
Length of stay in the house since moving in
11.8 years
14.8 years
Houses occupied
365,269 (92.8%)
87,440 (81.7%)
Houses occupied by owners
193,930 (53.1%)
41,267 (47.2%)
Houses occupied by renters
171,339 (46.9%)
46,173 (52.8%)
Median rent asked for vacant for-rent units
$1,482
$1,167
Median monthly housing costs
$1,302
$938
Median price asked for vacant for-sale houses and condos
$445,491
$351,611
Estimated median house or condo value
$321,400
$199,600
Median numbers of rooms
5.3
4.9
Median number of rooms in apartments
4
4
Median number of rooms in houses and condos
6.6
6.6
Median house price - detached houses
$388,029
$277,211
Median house price - in 2-unit structures
$184,325
$80,632
Median house price - in 3-to-4-unit structures
$178,624
$204,273
Median house price - in 5 or more unit structures
$433,957
$162,691
Median house price - mobile homes
$52,977
$36,615
Median house price - Townhouses or other attached units
$296,370
$190,008
Median house price - All housing units
$378,423
$270,567
Median house age
26
47
Renting percentage
42.6%
50.7%
Housing density (houses/condos per square mile)
1,624.8
1,392.5
House value disparities
33.3%
39.7%
Household income disparities
44.1%
52.9%
Median household income for houses/condes with a mortgage
$105,905
$85,373
Median household income for apartments without a mortgage
$70,681
$51,524
Housing units without a mortgage
3,089 (2.1%)
607 (2.5%)
Housing units with both a second mortgage and home equity loan
10,553 (7.2%)
1,424 (6%)
Housing units with a mortgage
142,912 (97.9%)
23,275 (97.5%)
Housing units with a home equity loan
171 (0.1%)
140 (0.6%)
Housing units with a second mortgage
13,532 (9.3%)
1,954 (8.2%)
House/condo owner moved in on average (years ago)
9
14
House/condo renter moved in on average (years ago)
1
1
Housing units lacking complete kitchen facilities
0.8%
6.1%
Housing units lacking complete plumbing facilities
0.2%
5.2%
Housing units in structures
Housing units in structures
Charlotte
Baton Rouge
One, detached
52.7%
55.3%
One, attached
9.1%
3.3%
Two
0.9%
3.5%
3 or 4
2.9%
5.6%
5 to 9
7.1%
7.5%
10 to 19
9.5%
9.4%
20 to 49
6.2%
7.0%
50 or more
10.3%
7.9%
Mobile homes
1.4%
0.4%
Median real estate property taxes paid for housing units
Self-employed workers in own not incorporated business
25,780
5,415
State government workers
16,519
9,361
Unpaid family workers
1,214
351
Industries and Occupations
The employment landscape in Charlotte is dominated by finance, energy, and technology sectors. Baton Rouge, however, provides diverse employment opportunities in public administration, education, and healthcare.
Both cities provide quality healthcare services with many medical centers. Baton Rouge's Our Lady of the Lake Regional Medical Center and Charlotte’s Atrium Health & Novant Health are among the leading healthcare providers.
Health (county statistics)
Type
Charlotte
Baton Rouge
General health status score of residents in this county from 1 (poor) to 5 (excellent)
Charlotte features modern infrastructure, with many ongoing developments promoting growth. Baton Rouge maintains a mixture of new and historical infrastructures, also having numerous development projects in the works.
Infrastructure
Type
Charlotte
Baton Rouge
Hospitals
37
95
TV stations
16
16
Arenas or stadiums
3
2
Bank branches located here
202
145
Bank institutions located here
26
29
Main business address for public companies
33
4
Nuclear power plants nearby
2
0
Drinking water stations with no reported violations in the past
24
8
Drinking water stations with reported violations in the past
HMDA - Conventional home purchase loans - Applications denied
Year
Charlotte
Baton Rouge
1999
3,049
728
2000
1,568
592
2001
1,382
495
2002
1,275
472
2003
1,879
472
2004
2,415
757
2005
3,078
1,088
2006
3,864
1,139
2007
3,106
717
2008
1,287
348
2009
617
176
Culture and Food
Charlotte offers a blend of southern charm and urban amenities, with a budding food scene. Baton Rouge, rich in Cajun culture, provides a vibrant food scene known for its southern cuisine.
Sports Teams
For sports fans, Charlotte houses professional sports teams including the Panthers (NFL) and the Hornets (NBA). Baton Rouge is fervent about college sports, especially LSU's Tigers.


 Charlotte, NC
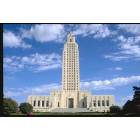
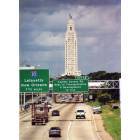
 Baton Rouge, LA