Charlotte, NC, and Chattanooga, TN, are two cities with distinct personalities and environments. The bustling city of Charlotte offers a thriving business and cultural scene, while Chattanooga offers a scenic backdrop with its vibrant outdoors. While both cities provide excellent quality of life, they vary in terms of crime rates, weather, cost of living, education, employment opportunities, and more. This comparison will assist you in making an informed decision whether you're thinking about relocation or just planning a visit.
Distance between
Charlotte, NC and
Chattanooga, TN : 251.0 miles
Charlotte's population is larger by 383%. Its population has grown by 338,881 people (62.7%) since 2000. The population of Chattanooga has grown by 26,559 people (17.1%) during that time.
Both Charlotte and Chattanooga have crime rates higher than the national average, but they vary in terms of violent and property crimes. In Charlotte, the crime rate is higher, with property crime notably more prevalent than violent crime. On the other hand, Chattanooga's crime rate involves more violent incidents. However, both cities are taking measures to improve their security through initiatives like community policing and surveillance cameras.
Cost of Living
While both cities offer a lower cost of living compared to the national average, Chattanooga is significantly cheaper. Housing costs are a large part of this difference, with homes in Charlotte costing substantially more. Other costs such as health care, groceries, and transportation are also generally lower in Chattanooga. If you're visiting, you're likely to find accommodation and dining more affordable in Chattanooga.
Income Tax
North Carolina has a flat state income tax rate of 5.25%, which applies in Charlotte. Tennessee doesn't have a traditional income tax, so Chattanooga residents and workers don't pay state income tax on their wages.
Property Tax
Property taxes in North Carolina and Charlotte are reasonable, with Charlotte's rate slightly lower than the state average. Chattanooga's rate is higher, but still relatively low when compared to national averages.
Sales Tax
North Carolina has a state sales tax of 4.75%, with localities like Charlotte able to add their own on top, for a total of 7.25% in Charlotte. Tennessee's state sales tax is higher at 7%, and with local additions, Chattanooga's total sales tax stands at 9.25%.
Income
Type
Charlotte
Chattanooga
Estimated median household income
$70,869
$55,065
Estimated per capita income
$44,593
$34,297
Cost of living index (U.S. average is 100)
93.2
89.2
If you make $50,000 in Chattanooga, you will have to make $52,242 in Charlotte to maintain the same standard of living.
Geographical Conditions
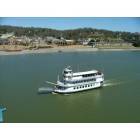
Charlotte is located in the Piedmont region, characterized by gently rolling terrain. Chattanooga is located between the Appalachian Mountain and the Cumberland Plateau, offering more rugged landscapes and abundant natural beauty.
Both cities boast quality educational institutions. However, Charlotte scores higher in terms of education quality and availability of schools. It’s home to several top-rated schools and renowned universities like the University of North Carolina at Charlotte. Chattanooga also has good schools and universities, but they are fewer in number.
Charlotte has a robust, diverse economy, largely driven by the banking industry. It's the second-largest banking center in the U.S. after New York City. Meanwhile, Chattanooga's economy is more diversified and includes industries like manufacturing, service, and tourism. The unemployment rate is slightly higher in Chattanooga than in Charlotte.
Biggest Employers
In Charlotte, the largest employers are Wells Fargo and Bank of America, reflecting its status as a banking hub. Meanwhile, Chattanooga's biggest employers are Erlanger Health System, BlueCross BlueShield of Tennessee, and the local County and City school systems.
In Charlotte (Mecklenburg County), 60.8% voted for Democrats and 38.3% for Republicans in 2012 Presidential Election. In Chattanooga (Hamilton County), 41.6% voted for Democrats and 56.6% for Republicans.
Elections
Type
Democrats
Republicans
Other
Year
Charlotte
Chattanooga
Charlotte
Chattanooga
Charlotte
Chattanooga
2020
66.8%
44.5%
31.6%
54.2%
1.6%
1.3%
2016
62.3%
39.1%
32.9%
55.6%
4.8%
5.4%
2012
60.8%
41.6%
38.3%
56.6%
0.9%
1.8%
2008
62.0%
43.4%
37.6%
55.2%
0.5%
1.3%
2004
51.7%
41.9%
48.0%
57.4%
0.3%
0.7%
2000
48.4%
43.1%
51.1%
55.5%
0.5%
1.3%
1996
48.6%
22.5%
45.9%
74.2%
5.5%
3.3%
Breakdown of population affiliated with a religious congregation
Type
Adherents
Congregations
Religion
Charlotte
Chattanooga
Charlotte
Chattanooga
SOUTHERN BAPTIST CONVENTION
9.0%
21.9%
19.0%
20.5%
CATHOLIC CHURCH
8.5%
3.8%
1.8%
1.1%
AMERICAN BAPTIST CHURCHES IN THE USA
2.3%
0.0%
1.1%
0.0%
EPISCOPAL CHURCH
1.2%
1.8%
1.3%
2.1%
EVANGELICAL LUTHERAN CHURCH IN AMERICA
0.9%
0.2%
1.8%
0.6%
PRESBYTERIAN CHURCH IN AMERICA
0.6%
2.1%
1.9%
2.3%
SEVENTH DAY ADVENTIST CHURCH
0.5%
3.1%
1.5%
3.8%
LUTHERAN CHURCH
0.3%
0.4%
0.9%
0.9%
MUSLIM ESTIMATE
0.3%
0.6%
1.2%
1.3%
EVANGELICAL PRESBYTERIAN CHURCH
0.2%
0.9%
0.7%
0.8%
Weather
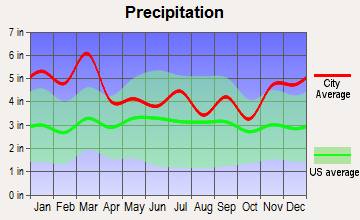
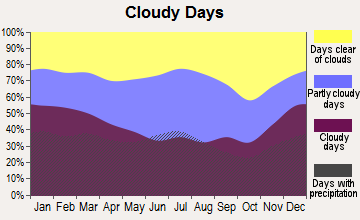
Charlotte enjoys a humid subtropical climate with hot summers and mild winters, while Chattanooga enjoys a similar climate but with a bit more variation. Chattanooga experiences colder winters and more rainfall throughout the year. If you prefer milder winters and less rainfall, Charlotte might be more appealing. As a visitor, both cities offer beautiful seasonal changes that can be enjoyed throughout the year.
Weather and climate
Type
Charlotte
Chattanooga
Temperature - Average
61°F
60°F
Humidity - Average morning or afternoon humidity
72.3%
76%
Humidity - Differences between morning and afternoon humidity
41%
42%
Humidity - Maximum monthly morning or afternoon humidity
87%
90%
Humidity - Minimum monthly morning or afternoon humidity
46%
48%
Precipitation - Yearly average
44.5 in
53.2 in
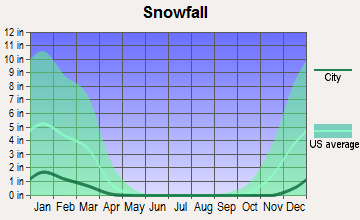
Snowfall - Yearly average
10.2 in
7.8 in
Clouds - Number of days clear of clouds
18.1%
17.3%
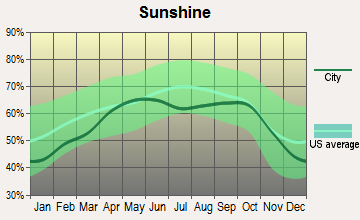
Sunshine amount - Average
69.8%
59.8%
Sunshine amount - Differences during a year
14%
19%
Sunshine amount - Maximum monthly
70%
63%
Sunshine amount - Minimum monthly
56%
44%
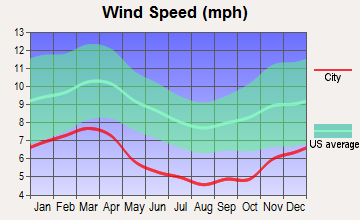
Wind speed - Average
6.9 mph
5.4 mph
Average climate in Charlotte, North Carolina
Average climate in Chattanooga, Tennessee
Air pollution
Type
AQI
CO
NO2
OZONE
PB
PM10
PM25
SO2
Year
Charlotte
Chattanooga
Charlotte
Chattanooga
Charlotte
Chattanooga
Charlotte
Chattanooga
Charlotte
Charlotte
Charlotte
Chattanooga
Charlotte
Chattanooga
2018
75
68
0.24
N/A
6.3
N/A
27.8
32.2
N/A
N/A
15.5
N/A
8.2
9.0
0.2
N/A
2017
77
74
0.25
N/A
7.0
N/A
28.0
32.8
N/A
N/A
16.3
N/A
8.8
9.5
0.2
N/A
2016
82
88
0.25
N/A
7.6
N/A
28.7
37.3
N/A
N/A
N/A
N/A
8.4
10.4
0.2
N/A
2015
76
76
0.25
N/A
8.1
N/A
27.6
31.5
N/A
N/A
N/A
N/A
8.6
9.7
0.2
N/A
2014
76
74
0.26
N/A
8.5
N/A
26.3
33.5
N/A
N/A
N/A
N/A
9.3
10.1
0.3
N/A
2013
71
77
0.29
N/A
8.4
N/A
25.5
33.0
N/A
N/A
N/A
N/A
8.6
10.2
0.3
N/A
2012
95
89
0.28
N/A
8.7
N/A
27.3
36.1
N/A
N/A
N/A
N/A
9.7
11.8
0.3
N/A
2011
94
91
0.34
N/A
10.1
N/A
28.9
35.6
N/A
N/A
N/A
N/A
11.2
13.8
0.6
N/A
2010
97
93
0.33
N/A
11.8
N/A
28.0
37.2
N/A
N/A
N/A
N/A
11.6
13.2
1.0
N/A
2009
82
81
0.30
N/A
10.0
N/A
25.4
33.0
N/A
N/A
N/A
N/A
11.1
11.8
0.9
N/A
2008
102
95
0.32
N/A
11.2
N/A
27.6
37.2
N/A
N/A
N/A
N/A
13.0
15.0
2.1
N/A
2007
108
118
0.37
N/A
13.9
N/A
29.1
41.7
0.001
N/A
N/A
N/A
14.5
N/A
3.0
N/A
2006
107
99
0.44
N/A
13.9
N/A
27.3
37.4
0.000
N/A
N/A
N/A
14.8
N/A
3.3
N/A
2005
109
93
0.53
N/A
14.6
5.5
30.6
34.5
0.000
N/A
N/A
N/A
15.2
N/A
2.7
1.5
2004
89
105
0.53
N/A
14.6
N/A
28.9
33.8
0.001
N/A
N/A
N/A
N/A
N/A
2.8
N/A
2003
85
95
0.57
N/A
15.6
N/A
27.6
27.2
0.003
N/A
N/A
N/A
N/A
N/A
3.0
N/A
2002
103
103
0.63
1.00
15.3
5.1
32.6
30.2
0.003
N/A
N/A
N/A
N/A
N/A
2.7
1.4
2001
108
110
0.72
N/A
17.5
N/A
32.3
27.8
0.005
N/A
N/A
N/A
N/A
N/A
3.9
N/A
2000
107
132
0.79
N/A
18.0
N/A
32.6
28.8
0.014
N/A
N/A
N/A
N/A
N/A
4.4
N/A
Natural disasters
Type
Charlotte
Chattanooga
Tornado activity compared to U.S. average
111.5%
149.2%
Earthquake activity compared to U.S. average
79%
214.8%
Natural disasters compared to U.S. average
9%
17%
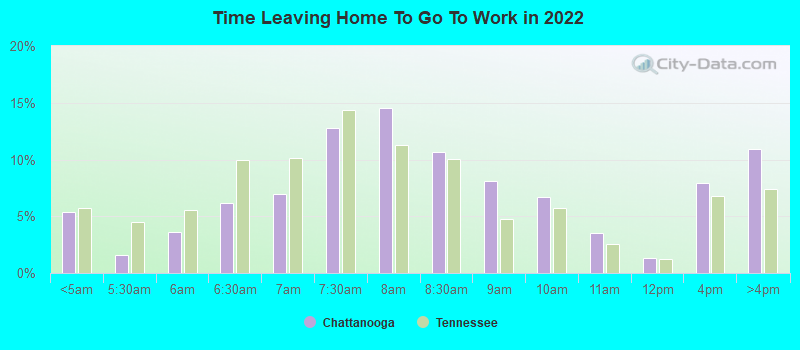
Transportation
Charlotte offers a more extensive public transit system, which includes buses, a light rail service, and bike-sharing programs. Chattanooga also has bus service and a free electric shuttle, but overall, public transit is less developed than in Charlotte. As for commuting, Charlotte's larger size and population mean longer commute times.
Transport
Type
Charlotte
Chattanooga
Amtrak stations
1
1
Amtrak stations nearby
2
1
FAA registered aircraft
439
145
FAA registered aircraft manufacturers and dealers
12
13
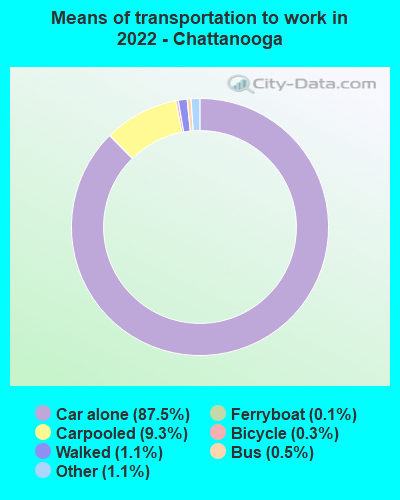
Means of transportation to work
Type
Charlotte
Chattanooga
Bicycle
0.1%
0.1%
Bus
1.2%
0.4%
Carpooled
8.7%
8.6%
Car alone
86.2%
89%
Motorcycle
0.1%
0.1%
Railroad
0.4%
0%
Taxicab
0.2%
0.4%
Walked
1.5%
1%
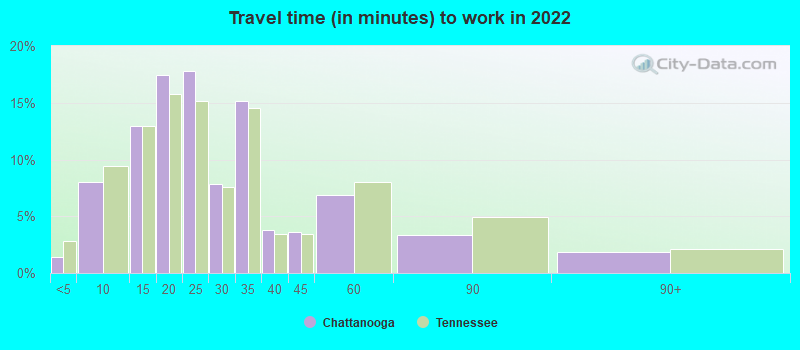
Average travel time to work
Type
Charlotte
Chattanooga
Average
29.6 min
27.1 min
Other means
24.9 min
20.4 min
Public transportation
44.1 min
34 min
Private vehicle occupancy
Type
Charlotte
Chattanooga
Average
1.2
1.1
Drove alone
90%
91%
In 2 person carpool
6.9%
7.1%
In 3 person carpool
1.8%
1.1%
In 4 person carpool
0.8%
0.5%
In 5-6 person carpool
0.5%
0.1%
How many people usually rode to work in the car, truck or van.
Real Estate
The real estate market in Charlotte is hotter, with higher home prices and a faster pace of sales. Chattanooga's market is cheaper and slower-moving, but still healthy with growth in values over recent years.
Neighborhoods
Both cities offer a variety of neighborhoods to suit different lifestyles. Charlotte has Uptown, known for its high-rise condos and bustling lifestyle, and quieter suburban areas like Dilworth and Myers Park. Chattanooga offers the artistic Bluff View district, the family-friendly Riverview, and the outdoor lover's paradise of Lookout Mountain.
Houses and residents
Type
Charlotte
Chattanooga
Houses
393,631
86,385
Average household size (people)
2.5
2.3
Median year apartment built
1998
1979
Median year house/condo built
1993
1970
Length of stay in the house since moving in
11.8 years
13.4 years
Houses occupied
365,269 (92.8%)
77,299 (89.5%)
Houses occupied by owners
193,930 (53.1%)
41,455 (53.6%)
Houses occupied by renters
171,339 (46.9%)
35,844 (46.4%)
Median rent asked for vacant for-rent units
$1,482
$1,964
Median monthly housing costs
$1,302
$1,003
Median price asked for vacant for-sale houses and condos
$445,491
$160,185
Estimated median house or condo value
$321,400
$235,900
Median numbers of rooms
5.3
5.3
Median number of rooms in apartments
4
4.1
Median number of rooms in houses and condos
6.6
6.4
Median house price - detached houses
$388,029
$286,715
Median house price - in 2-unit structures
$184,325
$238,441
Median house price - in 3-to-4-unit structures
$178,624
$232,475
Median house price - in 5 or more unit structures
$433,957
$350,957
Median house price - mobile homes
$52,977
$45,777
Median house price - Townhouses or other attached units
$296,370
$525,041
Median house price - All housing units
$378,423
$289,858
Median house age
26
47
Renting percentage
42.6%
47.4%
Housing density (houses/condos per square mile)
1,624.8
638.9
House value disparities
33.3%
34%
Household income disparities
44.1%
47%
Median household income for houses/condes with a mortgage
$105,905
$93,442
Median household income for apartments without a mortgage
$70,681
$45,013
Housing units without a mortgage
3,089 (2.1%)
739 (2.9%)
Housing units with both a second mortgage and home equity loan
10,553 (7.2%)
1,674 (6.6%)
Housing units with a mortgage
142,912 (97.9%)
24,594 (97.1%)
Housing units with a home equity loan
171 (0.1%)
89 (0.4%)
Housing units with a second mortgage
13,532 (9.3%)
2,103 (8.3%)
House/condo owner moved in on average (years ago)
9
11
House/condo renter moved in on average (years ago)
1
1
Housing units lacking complete kitchen facilities
0.8%
3.1%
Housing units lacking complete plumbing facilities
0.2%
2.3%
Housing units in structures
Housing units in structures
Charlotte
Chattanooga
One, detached
52.7%
60.6%
One, attached
9.1%
3.7%
Two
0.9%
7.1%
3 or 4
2.9%
3.9%
5 to 9
7.1%
4.1%
10 to 19
9.5%
4.8%
20 to 49
6.2%
7.8%
50 or more
10.3%
7.1%
Mobile homes
1.4%
0.8%
Median real estate property taxes paid for housing units
Self-employed workers in own not incorporated business
25,780
3,502
State government workers
16,519
4,173
Unpaid family workers
1,214
224
Industries and Occupations
Charlotte's mainstay is the finance sector, with several big banks calling it home. Other sectors include health care, energy, and technology. Chattanooga's economy is more diversified, with manufacturing, health care, transportation, and a burgeoning tech scene.
Charlotte's health care system is robust, home to large healthcare systems like Atrium and Novant Health. Chattanooga has quite a strong healthcare industry too, with Erlanger hospital and Chattanooga Heart Institute among the top providers.
Health (county statistics)
Type
Charlotte
Chattanooga
General health status score of residents in this county from 1 (poor) to 5 (excellent)
Charlotte offers a more developed infrastructure, thanks to its status as a major economic hub. It boasts modern buildings, well-maintained roads, and excellent utilities. Chattanooga, while smaller, has been investing in improvements, including a high-speed internet initiative that's drawn tech businesses to the area.
Infrastructure
Type
Charlotte
Chattanooga
Hospitals
37
23
TV stations
16
14
Arenas or stadiums
3
1
Bank branches located here
202
73
Bank institutions located here
26
14
Main business address for public companies
33
12
Nuclear power plants nearby
2
2
Drinking water stations with no reported violations in the past
24
3
Drinking water stations with reported violations in the past
HMDA - Conventional home purchase loans - Applications denied
Year
Charlotte
Chattanooga
1999
3,049
893
2000
1,568
823
2001
1,382
614
2002
1,275
548
2003
1,879
603
2004
2,415
741
2005
3,078
874
2006
3,864
964
2007
3,106
638
2008
1,287
230
2009
617
167
Culture and Food
Both cities offer rich cultural experiences. Charlotte is known for its diverse culinary scene, thriving arts, and vibrant nightlife, while Chattanooga is rich in history and offers a growing dining scene with a southern flair. The city is also a mecca for outdoor enthusiasts with activities from rock climbing to river rafting.
Sports Teams
As for sports, Charlotte has more professional teams, including the Carolina Panthers (NFL) and Charlotte Hornets (NBA). Chattanooga has minor league baseball and soccer teams, and the University of Tennessee at Chattanooga offers collegiate sports.


 Charlotte, NC
 Chattanooga, TN