Comparing Charlotte, North Carolina and Colorado Springs, Colorado is essentially comparing two diverse yet very livable American cities. Both cities offer a unique blend of southern charm and western adventure. While Charlotte is much larger and offers a more diverse economy, Colorado Springs is known for its natural beauty and access to outdoor pursuits. There are distinct differences across multiple dimensions, ranging from crime/safety, weather, cost of living, to culture and food.
Distance between
Charlotte, NC and
Colorado Springs, CO : 1,341.5 miles
Charlotte's population is larger by 82%. Its population has grown by 338,881 people (62.7%) since 2000. The population of Colorado Springs has grown by 123,066 people (34.1%) during that time.
Both cities have crime rates that are relatively high compared to national averages. However, reported statistics suggest that Charlotte has a slightly higher crime rate than Colorado Springs. It's vital for potential residents and tourists to note that crime is usually localized, and both cities have safe neighborhoods.
Cost of Living
Generally, the cost of living in Colorado Springs is higher than in Charlotte. Housing tends to be more expensive in Colorado Springs, with median home prices dramatically higher than in Charlotte. Overall, you'll likely need a higher income to maintain the same standard of living in Colorado Springs than you would in Charlotte.
Income Tax
Both states have a flat income tax rate, with North Carolina at 5.25% and Colorado at 4.63%.
Property Tax
Property taxes are generally lower in Colorado. As of 2020, the average effective property tax rate in Colorado Springs is 0.49%, while in Charlotte, it's about 1.1%.
Sales Tax
North Carolina has a lower state sales tax than Colorado, at 4.75% compared to 2.9%. However, Charlotte imposes an additional 2% county sales tax, while Colorado Springs has an additional 3.12% city sales tax.
Income
Type
Charlotte
Colorado Springs
Estimated median household income
$70,869
$74,579
Estimated per capita income
$44,593
$39,808
Cost of living index (U.S. average is 100)
93.2
99.6
If you make $50,000 in Charlotte, you will have to make $53,433 in Colorado Springs to maintain the same standard of living.
Geographical Conditions
Charlotte lies within the Southern Piedmont region, featuring rolling hills and a dense tree canopy. Colorado Springs is at the eastern foot of the Rocky Mountains and near Pikes Peak, a top outdoor destination.
Both cities have highly-rated schools and offer quality education. Charlotte-Mecklenburg Schools is the second largest in North Carolina and located in Charlotte. Colorado Springs also has numerous quality school districts with many highly-rated schools. Both cities offer various higher education opportunities.
Charlotte is known as a financial hub and is home to the headquarters of Bank of America. Despite this, the economy is diverse with opportunities in various sectors. Colorado Springs has a diverse economy too, with a strong emphasis on the military and high-tech industries. Unemployment rates are comparable in both cities.
Biggest Employers
In Charlotte, the biggest employers are Bank of America, Wells Fargo, and Carolinas Healthcare System. On the other hand, Colorado Springs' biggest employers include Fort Carson, Peterson Air Force Base, and Schriever Air Force Base.
In Charlotte (Mecklenburg County), 60.8% voted for Democrats and 38.3% for Republicans in 2012 Presidential Election. In Colorado Springs (El Paso County), 38.7% voted for Democrats and 59.2% for Republicans.
Elections
Type
Democrats
Republicans
Other
Year
Charlotte
Colorado Springs
Charlotte
Colorado Springs
Charlotte
Colorado Springs
2020
66.8%
43.0%
31.6%
53.9%
1.6%
3.1%
2016
62.3%
34.1%
32.9%
56.6%
4.8%
9.4%
2012
60.8%
38.7%
38.3%
59.2%
0.9%
2.0%
2008
62.0%
40.0%
37.6%
58.9%
0.5%
1.1%
2004
51.7%
32.2%
48.0%
66.9%
0.3%
0.9%
2000
48.4%
30.9%
51.1%
64.1%
0.5%
5.0%
1996
48.6%
32.2%
45.9%
59.0%
5.5%
8.8%
Breakdown of population affiliated with a religious congregation
Type
Adherents
Congregations
Religion
Charlotte
Colorado Springs
Charlotte
Colorado Springs
SOUTHERN BAPTIST CONVENTION
9.0%
2.6%
19.0%
11.3%
CATHOLIC CHURCH
8.5%
8.4%
1.8%
5.4%
AMERICAN BAPTIST CHURCHES IN THE USA
2.3%
0.3%
1.1%
1.2%
EPISCOPAL CHURCH
1.2%
0.4%
1.3%
1.6%
EVANGELICAL LUTHERAN CHURCH IN AMERICA
0.9%
1.0%
1.8%
2.3%
PRESBYTERIAN CHURCH IN AMERICA
0.6%
0.4%
1.9%
1.2%
SEVENTH DAY ADVENTIST CHURCH
0.5%
0.2%
1.5%
1.2%
LUTHERAN CHURCH
0.3%
0.7%
0.9%
1.9%
MUSLIM ESTIMATE
0.3%
0.0%
1.2%
0.2%
Weather
Charlotte has a humid subtropical climate with hot summers, mild winters, and ample rainfall throughout the year. Colorado Springs, however, has a semi-arid climate, with cold, dry winters, and warm summers. Its higher elevation can lead to sudden weather changes, including snowfall in colder months.
Weather and climate
Type
Charlotte
Colorado Springs
Temperature - Average
61°F
43.4°F
Humidity - Average morning or afternoon humidity
72.3%
53.3%
Humidity - Differences between morning and afternoon humidity
41%
30%
Humidity - Maximum monthly morning or afternoon humidity
87%
64%
Humidity - Minimum monthly morning or afternoon humidity
46%
34%
Precipitation - Yearly average
44.5 in
18.6 in
Snowfall - Yearly average
10.2 in
77 in
Clouds - Number of days clear of clouds
18.1%
21.2%
Sunshine amount - Average
69.8%
82.2%
Sunshine amount - Differences during a year
14%
10.5%
Sunshine amount - Maximum monthly
70%
79.7%
Sunshine amount - Minimum monthly
56%
69.2%
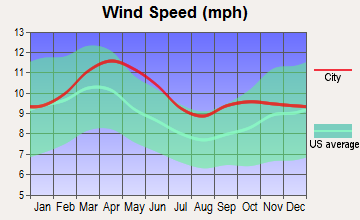
Wind speed - Average
6.9 mph
10.3 mph
Average climate in Charlotte, North Carolina
Average climate in Colorado Springs, Colorado
Air pollution
Type
AQI
CO
NO2
OZONE
PB
PM10
PM25
SO2
Year
Charlotte
Colorado Springs
Charlotte
Colorado Springs
Charlotte
Colorado Springs
Charlotte
Charlotte
Colorado Springs
Charlotte
Colorado Springs
Charlotte
Colorado Springs
Charlotte
Colorado Springs
2018
75
60
0.24
N/A
6.3
N/A
27.8
N/A
N/A
N/A
15.5
N/A
8.2
6.3
0.2
N/A
2017
77
58
0.25
N/A
7.0
N/A
28.0
N/A
N/A
N/A
16.3
N/A
8.8
6.1
0.2
N/A
2016
82
48
0.25
N/A
7.6
N/A
28.7
N/A
N/A
N/A
N/A
N/A
8.4
6.9
0.2
N/A
2015
76
N/A
0.25
N/A
8.1
N/A
27.6
N/A
N/A
N/A
N/A
N/A
8.6
N/A
0.2
N/A
2014
76
N/A
0.26
N/A
8.5
N/A
26.3
N/A
N/A
N/A
N/A
N/A
9.3
N/A
0.3
N/A
2013
71
N/A
0.29
N/A
8.4
N/A
25.5
N/A
N/A
N/A
N/A
N/A
8.6
N/A
0.3
N/A
2012
95
N/A
0.28
N/A
8.7
N/A
27.3
N/A
N/A
N/A
N/A
N/A
9.7
N/A
0.3
N/A
2011
94
N/A
0.34
N/A
10.1
N/A
28.9
N/A
N/A
N/A
N/A
N/A
11.2
N/A
0.6
N/A
2010
97
N/A
0.33
N/A
11.8
N/A
28.0
N/A
N/A
N/A
N/A
N/A
11.6
N/A
1.0
N/A
2009
82
N/A
0.30
N/A
10.0
N/A
25.4
N/A
N/A
N/A
N/A
N/A
11.1
N/A
0.9
N/A
2008
102
N/A
0.32
N/A
11.2
N/A
27.6
N/A
N/A
N/A
N/A
N/A
13.0
N/A
2.1
N/A
2007
108
N/A
0.37
N/A
13.9
N/A
29.1
N/A
0.001
N/A
N/A
N/A
14.5
N/A
3.0
N/A
2006
107
15
0.44
0.50
13.9
N/A
27.3
N/A
0.000
0.005
N/A
N/A
14.8
N/A
3.3
N/A
2005
109
17
0.53
0.55
14.6
N/A
30.6
N/A
0.000
0.027
N/A
N/A
15.2
N/A
2.7
N/A
2004
89
17
0.53
0.56
14.6
N/A
28.9
N/A
0.001
0.010
N/A
N/A
N/A
N/A
2.8
N/A
2003
85
19
0.57
0.59
15.6
N/A
27.6
N/A
0.003
0.011
N/A
N/A
N/A
N/A
3.0
N/A
2002
103
24
0.63
0.66
15.3
N/A
32.6
N/A
0.003
0.010
N/A
N/A
N/A
N/A
2.7
N/A
2001
108
51
0.72
0.63
17.5
16.7
32.3
N/A
0.005
0.005
N/A
21.3
N/A
N/A
3.9
1.9
2000
107
78
0.79
0.58
18.0
22.5
32.6
N/A
0.014
0.010
N/A
21.0
N/A
N/A
4.4
2.3
Natural disasters
Type
Charlotte
Colorado Springs
Tornado activity compared to U.S. average
111.5%
78.4%
Earthquake activity compared to U.S. average
79%
816.1%
Natural disasters compared to U.S. average
9%
17%
Transportation
Charlotte has an extensive public transit system, including buses, a light rail, and a streetcar system. Colorado Springs' public transit primarily consists of a bus system. However, both cities are also very car-dependent, as is typical for most American cities.
Transport
Type
Charlotte
Colorado Springs
Amtrak stations
1
1
Amtrak stations nearby
2
1
FAA registered aircraft
439
552
FAA registered aircraft manufacturers and dealers
12
44
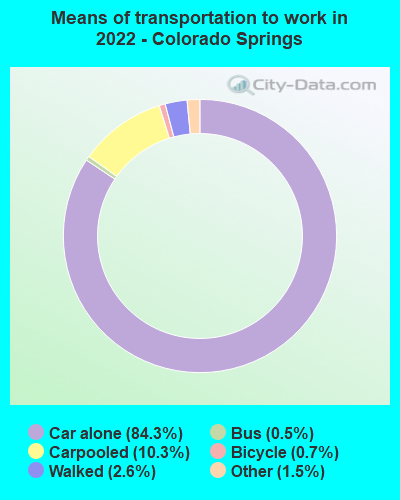
Means of transportation to work
Type
Charlotte
Colorado Springs
Bicycle
0.1%
0.3%
Bus
1.2%
0.4%
Carpooled
8.7%
9.2%
Car alone
86.2%
87%
Motorcycle
0.1%
0.1%
Railroad
0.4%
0%
Taxicab
0.2%
0.1%
Walked
1.5%
2.1%
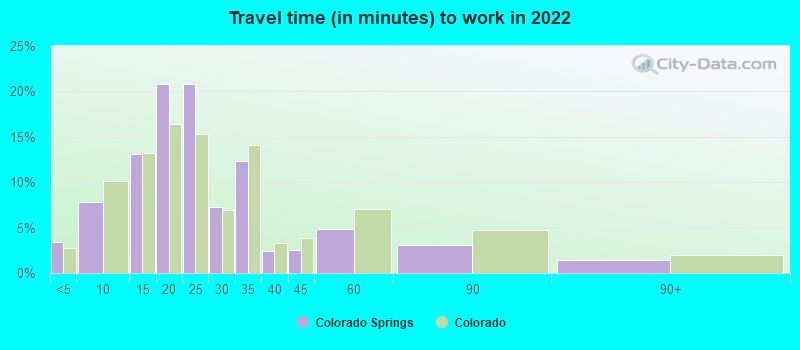
Average travel time to work
Type
Charlotte
Colorado Springs
Average
29.6 min
23.8 min
Other means
24.9 min
21.3 min
Public transportation
44.1 min
39 min
Private vehicle occupancy
Type
Charlotte
Colorado Springs
Average
1.2
1.1
Drove alone
90%
90%
In 2 person carpool
6.9%
7.5%
In 3 person carpool
1.8%
1.9%
In 4 person carpool
0.8%
0.2%
In 5-6 person carpool
0.5%
0.4%
In 7+ person carpool
0.1%
0.1%
How many people usually rode to work in the car, truck or van.
Real Estate
Real-estate is more expensive in Colorado Springs than in Charlotte. The median home price in Colorado Springs is significantly higher, while rent prices are also a bit steeper.
Neighborhoods
Both cities have diverse neighborhoods, from bustling downtown locales to family-friendly suburban areas. Charlotte has districts like Uptown and NoDa. Colorado Springs includes neighborhoods like Broadmoor and Briargate.
Houses and residents
Type
Charlotte
Colorado Springs
Houses
393,631
205,380
Average household size (people)
2.5
2.4
Median year apartment built
1998
1984
Median year house/condo built
1993
1987
Length of stay in the house since moving in
11.8 years
10.6 years
Houses occupied
365,269 (92.8%)
197,542 (96.2%)
Houses occupied by owners
193,930 (53.1%)
123,398 (62.5%)
Houses occupied by renters
171,339 (46.9%)
74,144 (37.5%)
Median rent asked for vacant for-rent units
$1,482
$1,458
Median monthly housing costs
$1,302
$1,422
Median price asked for vacant for-sale houses and condos
$445,491
$595,239
Estimated median house or condo value
$321,400
$390,500
Median numbers of rooms
5.3
6
Median number of rooms in apartments
4
4.1
Median number of rooms in houses and condos
6.6
7.2
Median house price - detached houses
$388,029
$427,641
Median house price - in 2-unit structures
$184,325
$389,381
Median house price - in 3-to-4-unit structures
$178,624
$295,560
Median house price - in 5 or more unit structures
$433,957
$258,564
Median house price - mobile homes
$52,977
$30,081
Median house price - Townhouses or other attached units
$296,370
$308,944
Median house price - All housing units
$378,423
$403,675
Median house age
26
35
Renting percentage
42.6%
39.9%
Housing density (houses/condos per square mile)
1,624.8
1,105.7
House value disparities
33.3%
25.2%
Household income disparities
44.1%
41%
Median household income for houses/condes with a mortgage
$105,905
$99,037
Median household income for apartments without a mortgage
$70,681
$72,581
Housing units without a mortgage
3,089 (2.1%)
1,835 (2.1%)
Housing units with both a second mortgage and home equity loan
10,553 (7.2%)
6,564 (7.3%)
Housing units with a mortgage
142,912 (97.9%)
87,580 (97.9%)
Housing units with a home equity loan
171 (0.1%)
86 (0.1%)
Housing units with a second mortgage
13,532 (9.3%)
7,898 (8.8%)
House/condo owner moved in on average (years ago)
9
7
House/condo renter moved in on average (years ago)
1
1
Housing units lacking complete kitchen facilities
0.8%
0.6%
Housing units lacking complete plumbing facilities
0.2%
0.3%
Housing units in structures
Housing units in structures
Charlotte
Colorado Springs
One, detached
52.7%
62.3%
One, attached
9.1%
8.3%
Two
0.9%
1.4%
3 or 4
2.9%
4.7%
5 to 9
7.1%
4.9%
10 to 19
9.5%
6.7%
20 to 49
6.2%
6.1%
50 or more
10.3%
4.0%
Mobile homes
1.4%
1.7%
Median real estate property taxes paid for housing units
Self-employed workers in own not incorporated business
25,780
13,110
State government workers
16,519
7,029
Unpaid family workers
1,214
735
Industries and Occupations
Finance and banking dominate in Charlotte. Colorado Springs' economy is driven by the military, the high-tech industry, and tourism. Other prominent industries include healthcare and education.
Both cities provide high-quality healthcare services. Charlotte has major hospitals like Atrium Health's Carolinas Medical Center. Colorado Springs homes UCHealth Memorial Hospital and Penrose Hospital. The healthcare services of both cities are among the best in their states.
Health (county statistics)
Type
Charlotte
Colorado Springs
General health status score of residents in this county from 1 (poor) to 5 (excellent)
Charlotte has more developed infrastructure due to its larger size and status as a major US city. It has a variety of amenities and services, and Colorado Springs is smaller but also has efficient infrastructure. Both cities have international airports, offering ease of travel.
Infrastructure
Type
Charlotte
Colorado Springs
Hospitals
37
10
TV stations
16
18
Arenas or stadiums
3
3
Bank branches located here
202
133
Bank institutions located here
26
33
Main business address for public companies
33
6
Nuclear power plants nearby
2
0
Drinking water stations with no reported violations in the past
24
6
Drinking water stations with reported violations in the past
HMDA - Conventional home purchase loans - Applications denied
Year
Charlotte
Colorado Springs
1999
3,049
1,957
2000
1,568
985
2001
1,382
756
2002
1,275
502
2003
1,879
1,131
2004
2,415
1,811
2005
3,078
2,631
2006
3,864
2,188
2007
3,106
1,246
2008
1,287
496
2009
617
233
Culture and Food
Charlotte offers Southern hospitality, with a blend of traditional and modern cuisine, from barbeque to farm-to-table trends. Colorado Springs offers a unique western tang with multiple eateries providing a variety of food from all over the world. Both cities have vibrant arts and culture scenes, with numerous museums, galleries, and live music venues.
Sports Teams
Charlotte is home to the NFL's Carolina Panthers and NBA's Charlotte Hornets. Colorado Springs does not have an NFL or NBA team but is a hub for national sporting organizations and has a minor league baseball team, the Colorado Springs Sky Sox.


 Charlotte, NC
 Colorado Springs, CO