In comparing Charlotte, North Carolina to Mobile, Alabama, numerous factors must be considered, including safety, weather, and cost of living. Education, work opportunities, and infrastructure also play key roles, as do the dominant industries, major employers, and real estate market. Let's not forget the significant aspects of neighborhood charm, public commuting, taxation, culture, sports, geography, and healthcare. These variables greatly impact both residents considering relocation, and tourists merely visiting.
Distance between
Charlotte, NC and
Mobile, AL : 524.8 miles
Charlotte's population is larger by 376%. Its population has grown by 338,881 people (62.7%) since 2000. The population of Mobile has decreased by 13,963 people (7.0%) during that time.
When it comes to safety, both cities present their challenges. According to recent FBI crime data, both Charlotte and Mobile have crime rates above the national average, with Charlotte's slightly higher. However, some neighborhoods in both cities are considerably safer. On a positive note, both cities have been making concerted efforts to improve safety and lower crime rates.
Cost of Living
Cost of living is generally lower in Mobile than in Charlotte. Housing is the biggest factor in cost of living differences. Mobile’s cost of living is 13.6% lower than the U.S average, while Charlotte's is about 1.2% lower.
Income Tax
Again, North Carolina has a slightly higher state income tax rate at 5.25%, while Alabama's is 5%.
Property Tax
Property taxes are also less in Mobile than in Charlotte with Mobile's rate of 0.54% compared to Charlotte's rate of approximately 0.86%.
Sales Tax
Tax rates in Charlotte are higher than Mobile. North Carolina's state sales tax rate is 4.75%, while Alabama's is 4%. However, Charlotte and Mobile each add additional local city sales taxes.
Income
Type
Charlotte
Mobile
Estimated median household income
$70,869
$43,786
Estimated per capita income
$44,593
$28,706
Cost of living index (U.S. average is 100)
93.2
84
If you make $50,000 in Mobile, you will have to make $55,476 in Charlotte to maintain the same standard of living.
Geographical Conditions
Geographically speaking, these cities are distinctively southern but different. Mobile sits on the Mobile Bay leading to the Gulf of Mexico, while Charlotte, further inland, features a rolling, verdant landscape with access to both mountains and beaches within a few hours’ drive.
When it comes to education, Charlotte has a well-regarded system, featuring universities such as UNC Charlotte and Johnson & Wales University. Mobile, on the other hand, is home to the University of South Alabama, with a number of other smaller colleges in the area.
Charlotte has a stronger and more diverse economy, being a major banking hub, second only to New York City. Mobile's economy is dominated by the manufacturing and maritime industries.
Biggest Employers
In Charlotte, some of the major employers are Carolinas Healthcare System, Wells Fargo, Bank of America, and Charlotte-Mecklenburg Schools. Mobile's top employers include Austal USA, the Mobile County Public School System, and the University of South Alabama.
In Charlotte (Mecklenburg County), 60.8% voted for Democrats and 38.3% for Republicans in 2012 Presidential Election. In Mobile (Mobile County), 45.1% voted for Democrats and 54.4% for Republicans.
Elections
Type
Democrats
Republicans
Other
Year
Charlotte
Mobile
Charlotte
Mobile
Charlotte
Mobile
2020
66.8%
43.4%
31.6%
55.3%
1.6%
1.3%
2016
62.3%
41.8%
32.9%
55.1%
4.8%
3.1%
2012
60.8%
45.1%
38.3%
54.4%
0.9%
0.5%
2008
62.0%
45.6%
37.6%
54.4%
0.5%
0.0%
2004
51.7%
40.8%
48.0%
58.9%
0.3%
0.4%
2000
48.4%
42.0%
51.1%
56.0%
0.5%
2.0%
1996
48.6%
42.1%
45.9%
51.3%
5.5%
6.6%
Breakdown of population affiliated with a religious congregation
Type
Adherents
Congregations
Religion
Charlotte
Mobile
Charlotte
Mobile
SOUTHERN BAPTIST CONVENTION
9.0%
21.9%
19.0%
19.4%
CATHOLIC CHURCH
8.5%
7.7%
1.8%
5.8%
AMERICAN BAPTIST CHURCHES IN THE USA
2.3%
0.3%
1.1%
0.2%
EPISCOPAL CHURCH
1.2%
1.4%
1.3%
2.5%
EVANGELICAL LUTHERAN CHURCH IN AMERICA
0.9%
0.1%
1.8%
0.3%
PRESBYTERIAN CHURCH IN AMERICA
0.6%
0.1%
1.9%
0.3%
SEVENTH DAY ADVENTIST CHURCH
0.5%
0.6%
1.5%
0.8%
LUTHERAN CHURCH
0.3%
0.3%
0.9%
1.0%
MUSLIM ESTIMATE
0.3%
0.4%
1.2%
0.8%
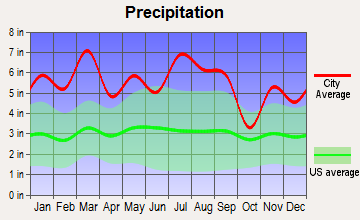
Weather
Weather-wise, both cities offer the warmth of the South. Charlotte experiences a more distinct change of seasons, albeit with mild winters, while Mobile experiences a subtropical climate with very mild winters and hot, humid summers - and it's within the hurricane strike zone.
Weather and climate
Type
Charlotte
Mobile
Temperature - Average
61°F
66.7°F
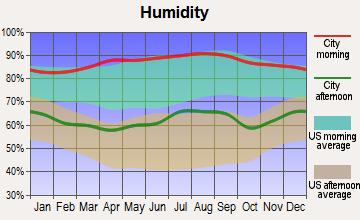
Humidity - Average morning or afternoon humidity
72.3%
78.1%
Humidity - Differences between morning and afternoon humidity
41%
38%
Humidity - Maximum monthly morning or afternoon humidity
87%
91%
Humidity - Minimum monthly morning or afternoon humidity
46%
53%
Precipitation - Yearly average
44.5 in
66.3 in
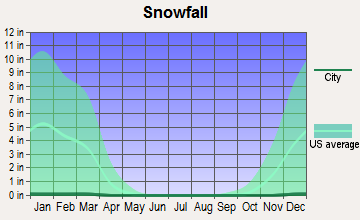
Snowfall - Yearly average
10.2 in
0.8 in
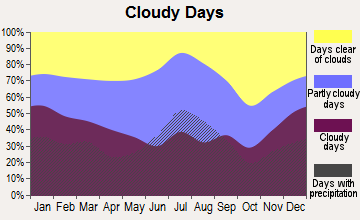
Clouds - Number of days clear of clouds
18.1%
17.1%
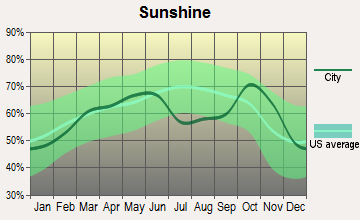
Sunshine amount - Average
69.8%
65.3%
Sunshine amount - Differences during a year
14%
23.7%
Sunshine amount - Maximum monthly
70%
70.9%
Sunshine amount - Minimum monthly
56%
47.2%
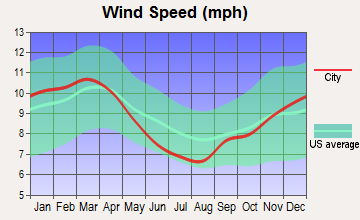
Wind speed - Average
6.9 mph
8.1 mph
Average climate in Charlotte, North Carolina
Average climate in Mobile, Alabama
Air pollution
Type
AQI
CO
NO2
OZONE
PB
PM10
PM25
SO2
Year
Charlotte
Mobile
Charlotte
Mobile
Charlotte
Charlotte
Mobile
Charlotte
Mobile
Charlotte
Charlotte
Mobile
Charlotte
Mobile
2018
75
66
0.24
N/A
6.3
N/A
27.8
24.6
N/A
N/A
15.5
N/A
8.2
8.0
0.2
0.5
2017
77
79
0.25
N/A
7.0
N/A
28.0
25.6
N/A
N/A
16.3
N/A
8.8
6.5
0.2
0.4
2016
82
72
0.25
N/A
7.6
N/A
28.7
23.6
N/A
N/A
N/A
N/A
8.4
9.5
0.2
0.6
2015
76
72
0.25
N/A
8.1
N/A
27.6
24.1
N/A
N/A
N/A
N/A
8.6
9.1
0.2
N/A
2014
76
77
0.26
N/A
8.5
N/A
26.3
25.6
N/A
N/A
N/A
N/A
9.3
N/A
0.3
N/A
2013
71
57
0.29
N/A
8.4
N/A
25.5
24.0
N/A
N/A
N/A
N/A
8.6
N/A
0.3
N/A
2012
95
70
0.28
N/A
8.7
N/A
27.3
25.9
N/A
N/A
N/A
N/A
9.7
N/A
0.3
N/A
2011
94
86
0.34
N/A
10.1
N/A
28.9
28.0
N/A
N/A
N/A
N/A
11.2
N/A
0.6
N/A
2010
97
96
0.33
N/A
11.8
N/A
28.0
27.4
N/A
N/A
N/A
N/A
11.6
N/A
1.0
N/A
2009
82
67
0.30
N/A
10.0
N/A
25.4
25.5
N/A
N/A
N/A
N/A
11.1
N/A
0.9
N/A
2008
102
85
0.32
N/A
11.2
N/A
27.6
25.5
N/A
N/A
N/A
N/A
13.0
N/A
2.1
N/A
2007
108
100
0.37
N/A
13.9
N/A
29.1
28.1
0.001
N/A
N/A
N/A
14.5
N/A
3.0
N/A
2006
107
100
0.44
N/A
13.9
N/A
27.3
29.8
0.000
N/A
N/A
N/A
14.8
N/A
3.3
N/A
2005
109
69
0.53
N/A
14.6
N/A
30.6
27.5
0.000
N/A
N/A
N/A
15.2
N/A
2.7
0.9
2004
89
72
0.53
N/A
14.6
N/A
28.9
27.1
0.001
N/A
N/A
N/A
N/A
N/A
2.8
1.1
2003
85
74
0.57
0.33
15.6
N/A
27.6
25.7
0.003
0.003
N/A
N/A
N/A
N/A
3.0
1.9
2002
103
68
0.63
N/A
15.3
N/A
32.6
26.0
0.003
N/A
N/A
N/A
N/A
N/A
2.7
0.6
2001
108
84
0.72
N/A
17.5
N/A
32.3
26.2
0.005
N/A
N/A
N/A
N/A
N/A
3.9
N/A
2000
107
111
0.79
N/A
18.0
N/A
32.6
30.6
0.014
N/A
N/A
N/A
N/A
N/A
4.4
1.1
Natural disasters
Type
Charlotte
Mobile
Tornado activity compared to U.S. average
111.5%
130.1%
Earthquake activity compared to U.S. average
79%
42.8%
Natural disasters compared to U.S. average
9%
31%
Transportation
Charlotte has a well-developed public transit system which includes buses and a light rail system. Mobile largely depends on personal vehicles with less robust public transit, though it does have a number of bus lines in operation.
Transport
Type
Charlotte
Mobile
Amtrak stations
1
1
Amtrak stations nearby
2
1
FAA registered aircraft
439
155
FAA registered aircraft manufacturers and dealers
12
15
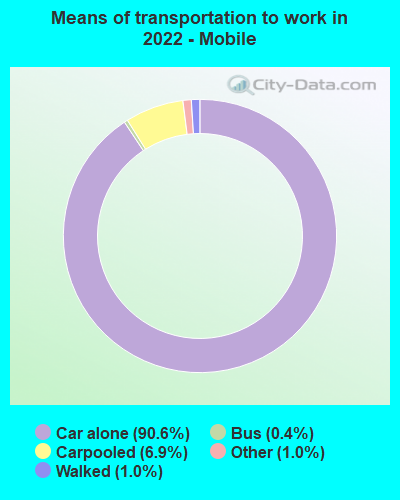
Means of transportation to work
Type
Charlotte
Mobile
Bicycle
0.1%
0%
Bus
1.2%
0.5%
Carpooled
8.7%
6.7%
Car alone
86.2%
91%
Railroad
0.4%
0%
Taxicab
0.2%
0%
Walked
1.5%
0.9%
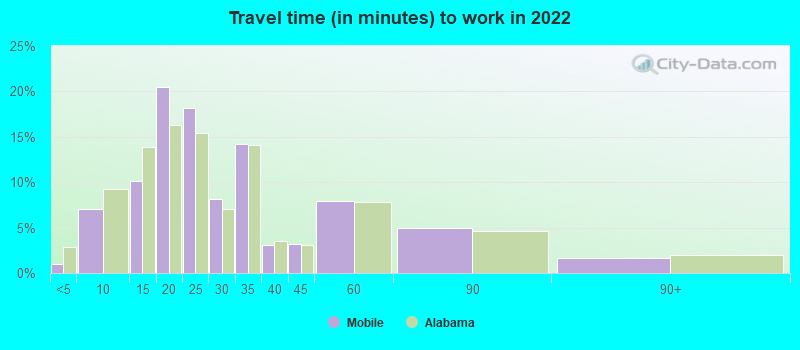
Average travel time to work
Type
Charlotte
Mobile
Average
29.6 min
26.7 min
Other means
24.9 min
22.2 min
Public transportation
44.1 min
42.5 min
Private vehicle occupancy
Type
Charlotte
Mobile
Average
1.2
1.1
Drove alone
90%
91.4%
In 2 person carpool
6.9%
6.7%
In 3 person carpool
1.8%
0.8%
In 4 person carpool
0.8%
0.8%
In 5-6 person carpool
0.5%
0.1%
In 7+ person carpool
0.1%
0.2%
How many people usually rode to work in the car, truck or van.
Real Estate
In terms of real-estate, Charlotte presents a more expensive market than Mobile, with home values and rent prices generally higher. Mobile, however, offers more affordable properties with equally desirable features.
Neighborhoods
Charlotte's neighbourhoods like Myers Park and Dilworth are admired for their charm, while Mobile's Spanish Fort and Spring Hill are applauded for their historical ambiance and Southern charm.
Houses and residents
Type
Charlotte
Mobile
Houses
393,631
88,507
Average household size (people)
2.5
2.4
Median year apartment built
1998
1977
Median year house/condo built
1993
1972
Length of stay in the house since moving in
11.8 years
15.4 years
Houses occupied
365,269 (92.8%)
77,991 (88.1%)
Houses occupied by owners
193,930 (53.1%)
41,443 (53.1%)
Houses occupied by renters
171,339 (46.9%)
36,548 (46.9%)
Median rent asked for vacant for-rent units
$1,482
$503.72
Median monthly housing costs
$1,302
$905
Median price asked for vacant for-sale houses and condos
$445,491
$139,357
Estimated median house or condo value
$321,400
$158,200
Median numbers of rooms
5.3
5.7
Median number of rooms in apartments
4
4.6
Median number of rooms in houses and condos
6.6
6.8
Median house price - detached houses
$388,029
$207,085
Median house price - in 2-unit structures
$184,325
$45,114
Median house price - in 3-to-4-unit structures
$178,624
$220,201
Median house price - in 5 or more unit structures
$433,957
$224,513
Median house price - mobile homes
$52,977
$98,232
Median house price - Townhouses or other attached units
$296,370
$226,950
Median house price - All housing units
$378,423
$206,375
Median house age
26
48
Renting percentage
42.6%
43.6%
Housing density (houses/condos per square mile)
1,624.8
750.7
House value disparities
33.3%
42.6%
Household income disparities
44.1%
48.9%
Median household income for houses/condes with a mortgage
$105,905
$68,706
Median household income for apartments without a mortgage
$70,681
$51,029
Housing units without a mortgage
3,089 (2.1%)
944 (3.9%)
Housing units with both a second mortgage and home equity loan
10,553 (7.2%)
1,217 (5%)
Housing units with a mortgage
142,912 (97.9%)
23,333 (96.1%)
Housing units with a home equity loan
171 (0.1%)
0 (0%)
Housing units with a second mortgage
13,532 (9.3%)
1,542 (6.4%)
House/condo owner moved in on average (years ago)
9
15
House/condo renter moved in on average (years ago)
1
1
Housing units lacking complete kitchen facilities
0.8%
5.9%
Housing units lacking complete plumbing facilities
0.2%
4.8%
Housing units in structures
Housing units in structures
Charlotte
Mobile
One, detached
52.7%
68.1%
One, attached
9.1%
1.7%
Two
0.9%
2.6%
3 or 4
2.9%
2.6%
5 to 9
7.1%
7.7%
10 to 19
9.5%
8.7%
20 to 49
6.2%
3.8%
50 or more
10.3%
3.4%
Mobile homes
1.4%
1.3%
Median real estate property taxes paid for housing units
Self-employed workers in own not incorporated business
25,780
4,678
State government workers
16,519
5,996
Unpaid family workers
1,214
0
Industries and Occupations
Charlotte is known for its banking sector and energy hub, hosting offices of Wells Fargo and Bank of America. Other sectors include healthcare and retail. Mobile is a center for shipbuilding and manufacturing, and is home to a significant healthcare sector.
‘The Queen City’ Charlotte offers top-tier health services with a range of renowned hospitals. While Mobile also offers high-quality healthcare, with major institutions like Mobile Infirmary Medical Center and Providence Hospital.
Health (county statistics)
Type
Charlotte
Mobile
General health status score of residents in this county from 1 (poor) to 5 (excellent)
Both cities offer their own unique infrastructure benefits. Charlotte's light rail and greenway systems are a draw, while Mobile's port is a significant feature of its infrastructure, supporting numerous jobs and businesses both local and nationally.
Infrastructure
Type
Charlotte
Mobile
Hospitals
37
14
TV stations
16
15
Arenas or stadiums
3
3
Bank branches located here
202
97
Bank institutions located here
26
20
Main business address for public companies
33
3
Nuclear power plants nearby
2
0
Drinking water stations with no reported violations in the past
24
0
Drinking water stations with reported violations in the past
HMDA - Conventional home purchase loans - Applications denied
Year
Charlotte
Mobile
1999
3,049
1,147
2000
1,568
806
2001
1,382
462
2002
1,275
340
2003
1,879
392
2004
2,415
625
2005
3,078
817
2006
3,864
903
2007
3,106
550
2008
1,287
269
2009
617
120
Culture and Food
Both cities are rich in culture and Southern hospitality, but there are marked differences. Charlotte boasts a variety of cultural institutions like museums and performing arts centers. Mobile, known as the birthplace of Mardi Gras, offers an historic downtown and extraordinary Southern cuisine.
Sports Teams
Sport lovers will feel at home in Charlotte, with its professional football and basketball teams (Panthers and Hornets). Mobile, while not hosting any major league teams, does offer a variety of college sports events and is close to NASCAR's heartland.


 Charlotte, NC
 Mobile, AL