Charlotte, North Carolina, and Orlando, Florida, are two of the busiest cities in the Southeastern United States. They stand out for their unique characteristics, strong economy, quality of life, and potential for economic growth. However, they vary greatly in areas such as weather, cost of living, education, infrastructure, and occupational opportunities, among other aspects. This comparison will give a comprehensive understanding of these two cities, whether you're considering relocating or just planning a visit.
Distance between
Charlotte, NC and
Orlando, FL : 462.2 miles
Charlotte's population is larger by 185%. Its population has grown by 338,881 people (62.7%) since 2000. The population of Orlando has grown by 123,203 people (66.3%) during that time.
When it comes to crime and safety, both cities have their challenges. According to the FBI, Charlotte has a slightly higher crime rate than the national average, primarily in property crime. Meanwhile, Orlando's overall crime rate is slightly higher than that of Charlotte. Both cities have taken steps to enhance safety through increased police presence and community involvement initiatives. As a visitor or resident, it's always important to remain vigilant and informed about the areas you're frequenting.
Cost of Living
The cost of living is often a leading factor when comparing living situations. According to data from BestPlaces, Charlotte’s overall cost of living is less than Orlando's. While costs such as food, healthcare, and utilities are comparable, housing tends to be more expensive in Orlando.
Income Tax
Florida's lack of a state income tax makes Orlando particularly attractive to those with high domestic income. On the other hand, North Carolina levies a flat tax rate of 5.25% on all income levels for Charlotte residents.
Property Tax
Property taxes in both cities are relatively similar, with Orlando's being slightly lower. Rates can vary significantly based on the property location within the city and its evaluated value.
Sales Tax
Florida has a competitive edge here as it has no state income tax, and Orlando has a sales tax rate of 6.5%. Conversely, North Carolina does levy a state income tax, and Charlotte has a combined sales tax rate of 7.25%.
Income
Type
Charlotte
Orlando
Estimated median household income
$70,869
$54,167
Estimated per capita income
$44,593
$36,370
Cost of living index (U.S. average is 100)
93.2
93.5
If you make $50,000 in Charlotte, you will have to make $50,161 in Orlando to maintain the same standard of living.
Geographical Conditions
Orlando is relatively flat with many lakes and is closer to the coast, well-known for its beautifully maintained city parks. Charlotte is inland, characterized by rolling hills, and is a short drive from both the mountains and the beach.
Both cities have solid education offerings. Orlando is home to the University of Central Florida, one of the largest universities by student body in the country. Charlotte boasts several distinguished institutions, including the University of North Carolina at Charlotte. Both cities' public school systems have both pros and cons and offer various magnet and charter schools.
Charlotte has a rapidly growing economy, being one of the nation's largest banking centers, second only to New York City. Orlando's economy, on the other hand, is largely driven by tourism, especially due to the city's world-famous theme parks such as Disney and Universal Studios.
Biggest Employers
In Charlotte, the biggest employers include Wells Fargo, Atrium Health, and American Airlines. Disney World tops the list in Orlando, followed by agencies like Orange County Public Schools and the State of Florida.
In Charlotte (Mecklenburg County), 60.8% voted for Democrats and 38.3% for Republicans in 2012 Presidential Election. In Orlando (Orange County), 58.8% voted for Democrats and 40.5% for Republicans.
Elections
Type
Democrats
Republicans
Other
Year
Charlotte
Orlando
Charlotte
Orlando
Charlotte
Orlando
2020
66.8%
61.1%
31.6%
37.9%
1.6%
1.0%
2016
62.3%
60.0%
32.9%
35.5%
4.8%
4.5%
2012
60.8%
58.8%
38.3%
40.5%
0.9%
0.6%
2008
62.0%
59.4%
37.6%
40.6%
0.5%
0.0%
2004
51.7%
50.0%
48.0%
49.7%
0.3%
0.3%
2000
48.4%
50.2%
51.1%
48.1%
0.5%
1.7%
1996
48.6%
45.7%
45.9%
45.9%
5.5%
8.4%
Breakdown of population affiliated with a religious congregation
Type
Adherents
Congregations
Religion
Charlotte
Orlando
Charlotte
Orlando
SOUTHERN BAPTIST CONVENTION
9.0%
5.5%
19.0%
14.3%
CATHOLIC CHURCH
8.5%
12.7%
1.8%
2.5%
AMERICAN BAPTIST CHURCHES IN THE USA
2.3%
0.3%
1.1%
0.7%
EPISCOPAL CHURCH
1.2%
0.7%
1.3%
1.9%
EVANGELICAL LUTHERAN CHURCH IN AMERICA
0.9%
0.3%
1.8%
1.2%
PRESBYTERIAN CHURCH IN AMERICA
0.6%
0.3%
1.9%
1.2%
SEVENTH DAY ADVENTIST CHURCH
0.5%
1.8%
1.5%
4.7%
LUTHERAN CHURCH
0.3%
0.3%
0.9%
1.0%
MUSLIM ESTIMATE
0.3%
1.1%
1.2%
1.1%
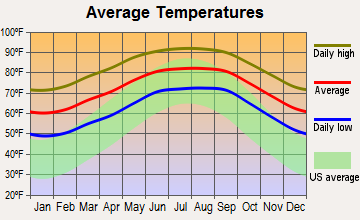
Weather
If you favor hot, humid summers and mild winters, then Orlando can be an ideal place. Charlotte, on the other hand, experiences all four seasons, though winters are not harsh, with snowfall being quite rare. Hurricanes are a risk in both cities, though they tend to affect Orlando more directly due to its closer proximity to the coast.
Weather and climate
Type
Charlotte
Orlando
Temperature - Average
61°F
72.4°F
Humidity - Average morning or afternoon humidity
72.3%
77.6%
Humidity - Differences between morning and afternoon humidity
41%
44%
Humidity - Maximum monthly morning or afternoon humidity
87%
91%
Humidity - Minimum monthly morning or afternoon humidity
46%
47%
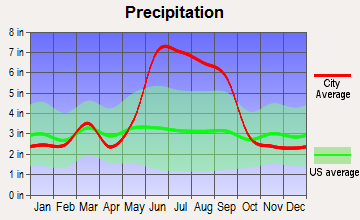
Precipitation - Yearly average
44.5 in
48.7 in
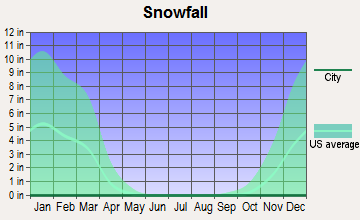
Snowfall - Yearly average
10.2 in
0 in
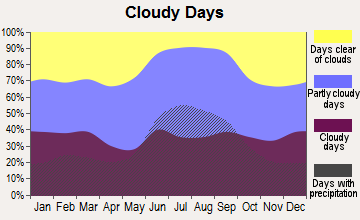
Clouds - Number of days clear of clouds
18.1%
14.8%
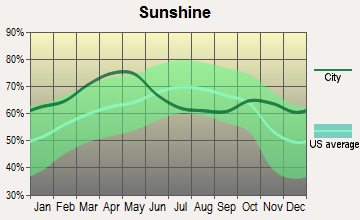
Sunshine amount - Average
69.8%
74.5%
Sunshine amount - Differences during a year
14%
17.8%
Sunshine amount - Maximum monthly
70%
79.7%
Sunshine amount - Minimum monthly
56%
61.9%
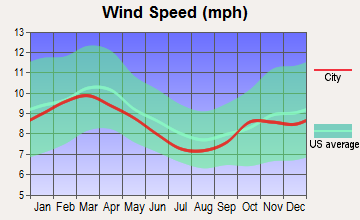
Wind speed - Average
6.9 mph
8.3 mph
Average climate in Charlotte, North Carolina
Average climate in Orlando, Florida
Air pollution
Type
AQI
CO
NO2
OZONE
PB
PM10
PM25
SO2
Year
Charlotte
Orlando
Charlotte
Orlando
Charlotte
Orlando
Charlotte
Orlando
Charlotte
Charlotte
Orlando
Charlotte
Orlando
Charlotte
2018
75
65
0.24
0.49
6.3
4.5
27.8
28.1
N/A
N/A
15.5
12.3
8.2
7.1
0.2
N/A
2017
77
70
0.25
0.46
7.0
4.1
28.0
28.3
N/A
N/A
16.3
13.8
8.8
8.1
0.2
N/A
2016
82
68
0.25
0.48
7.6
4.1
28.7
29.1
N/A
N/A
N/A
13.8
8.4
8.6
0.2
N/A
2015
76
64
0.25
0.51
8.1
4.0
27.6
26.9
N/A
N/A
N/A
14.2
8.6
8.4
0.2
N/A
2014
76
65
0.26
0.45
8.5
4.9
26.3
27.1
N/A
N/A
N/A
13.9
9.3
8.5
0.3
N/A
2013
71
61
0.29
0.29
8.4
4.5
25.5
26.2
N/A
N/A
N/A
14.1
8.6
8.2
0.3
N/A
2012
95
66
0.28
0.38
8.7
5.4
27.3
26.7
N/A
N/A
N/A
14.9
9.7
8.5
0.3
N/A
2011
94
72
0.34
0.43
10.1
5.4
28.9
28.0
N/A
N/A
N/A
15.3
11.2
9.8
0.6
N/A
2010
97
69
0.33
0.40
11.8
5.6
28.0
27.3
N/A
N/A
N/A
15.7
11.6
9.5
1.0
N/A
2009
82
69
0.30
0.33
10.0
5.9
25.4
27.0
N/A
N/A
N/A
16.0
11.1
9.5
0.9
N/A
2008
102
73
0.32
0.25
11.2
6.1
27.6
28.0
N/A
N/A
N/A
16.8
13.0
10.2
2.1
N/A
2007
108
83
0.37
0.37
13.9
6.9
29.1
30.3
0.001
N/A
N/A
16.9
14.5
11.0
3.0
N/A
2006
107
87
0.44
0.39
13.9
8.5
27.3
31.5
0.000
N/A
N/A
21.4
14.8
11.6
3.3
N/A
2005
109
89
0.53
0.56
14.6
8.6
30.6
29.6
0.000
N/A
N/A
18.7
15.2
12.6
2.7
N/A
2004
89
86
0.53
0.52
14.6
9.5
28.9
28.4
0.001
N/A
N/A
18.5
N/A
11.7
2.8
N/A
2003
85
84
0.57
0.44
15.6
11.0
27.6
27.9
0.003
N/A
N/A
17.8
N/A
10.9
3.0
N/A
2002
103
84
0.63
0.47
15.3
11.3
32.6
25.9
0.003
N/A
N/A
17.7
N/A
11.1
2.7
N/A
2001
108
88
0.72
0.64
17.5
12.3
32.3
26.6
0.005
N/A
N/A
19.6
N/A
12.2
3.9
N/A
2000
107
77
0.79
0.72
18.0
12.4
32.6
N/A
0.014
N/A
N/A
N/A
N/A
N/A
4.4
N/A
Natural disasters
Type
Charlotte
Orlando
Tornado activity compared to U.S. average
111.5%
150.1%
Earthquake activity compared to U.S. average
79%
11.3%
Natural disasters compared to U.S. average
9%
20%
Transportation
Transportation options are good in both cities. Charlotte has a light commuter rail system, the Lynx Blue Line, and Orlando is served by the Lynx Bus System and the SunRail. Commuting can be a challenge during peak hours in both cities.
Transport
Type
Charlotte
Orlando
Amtrak stations
1
1
Amtrak stations nearby
2
3
FAA registered aircraft
439
616
FAA registered aircraft manufacturers and dealers
12
61
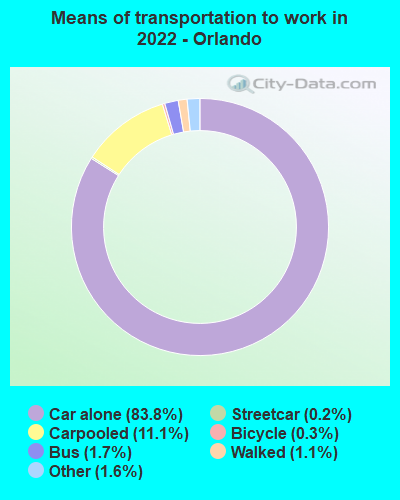
Means of transportation to work
Type
Charlotte
Orlando
Bicycle
0.1%
0.3%
Bus
1.2%
1.7%
Carpooled
8.7%
10.9%
Car alone
86.2%
83.7%
Motorcycle
0.1%
0.2%
Railroad
0.4%
0%
Taxicab
0.2%
0.1%
Walked
1.5%
1.5%
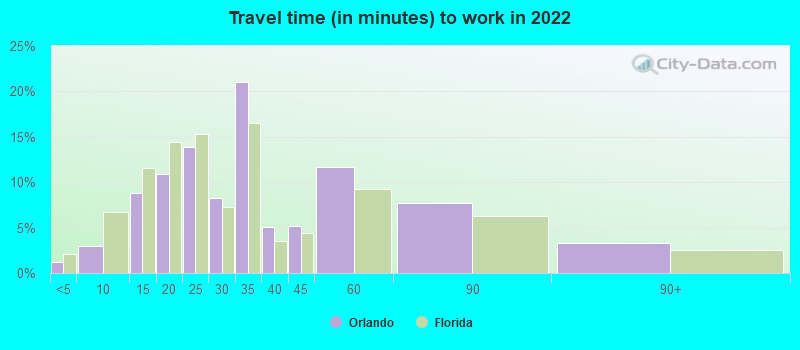
Average travel time to work
Type
Charlotte
Orlando
Average
29.6 min
33.2 min
Other means
24.9 min
24.4 min
Public transportation
44.1 min
49.2 min
Private vehicle occupancy
Type
Charlotte
Orlando
Average
1.2
1.1
Drove alone
90%
89.9%
In 2 person carpool
6.9%
7.2%
In 3 person carpool
1.8%
2%
In 4 person carpool
0.8%
0.4%
In 5-6 person carpool
0.5%
0.3%
In 7+ person carpool
0.1%
0.1%
How many people usually rode to work in the car, truck or van.
Real Estate
With a growing population, real estate in both Charlotte and Orlando is competitive. Orlando's real estate is more expensive on average when compared to Charlotte. However, both markets offer a range of options from downtown condos to suburban homes.
Neighborhoods
Both cities have diverse neighborhoods. In Charlotte, NoDa is known for its art scene and South Park for its shopping district. In Orlando, Lake Eola Heights is a historic community, and Dr. Phillips is known for its upscale homes and golf courses.
Houses and residents
Type
Charlotte
Orlando
Houses
393,631
149,940
Average household size (people)
2.5
2.3
Median year apartment built
1998
1992
Median year house/condo built
1993
1987
Length of stay in the house since moving in
11.8 years
10.7 years
Houses occupied
365,269 (92.8%)
130,037 (86.7%)
Houses occupied by owners
193,930 (53.1%)
49,048 (37.7%)
Houses occupied by renters
171,339 (46.9%)
80,989 (62.3%)
Median rent asked for vacant for-rent units
$1,482
$1,141
Median monthly housing costs
$1,302
$1,401
Median price asked for vacant for-sale houses and condos
$445,491
$310,225
Estimated median house or condo value
$321,400
$319,800
Median numbers of rooms
5.3
4.5
Median number of rooms in apartments
4
3.9
Median number of rooms in houses and condos
6.6
5.9
Median house price - detached houses
$388,029
$429,298
Median house price - in 2-unit structures
$184,325
$232,136
Median house price - in 3-to-4-unit structures
$178,624
$131,385
Median house price - in 5 or more unit structures
$433,957
$225,567
Median house price - mobile homes
$52,977
$190,092
Median house price - Townhouses or other attached units
$296,370
$309,224
Median house price - All housing units
$378,423
$378,951
Median house age
26
31
Renting percentage
42.6%
60.5%
Housing density (houses/condos per square mile)
1,624.8
1,603.7
House value disparities
33.3%
34.3%
Household income disparities
44.1%
47.8%
Median household income for houses/condes with a mortgage
$105,905
$106,563
Median household income for apartments without a mortgage
$70,681
$44,446
Housing units without a mortgage
3,089 (2.1%)
853 (2.5%)
Housing units with both a second mortgage and home equity loan
10,553 (7.2%)
2,153 (6.4%)
Housing units with a mortgage
142,912 (97.9%)
33,038 (97.5%)
Housing units with a home equity loan
171 (0.1%)
174 (0.5%)
Housing units with a second mortgage
13,532 (9.3%)
2,480 (7.3%)
House/condo owner moved in on average (years ago)
9
6
House/condo renter moved in on average (years ago)
1
1
Housing units lacking complete kitchen facilities
0.8%
0.4%
Housing units lacking complete plumbing facilities
0.2%
0.2%
Housing units in structures
Housing units in structures
Charlotte
Orlando
One, detached
52.7%
31.1%
One, attached
9.1%
10.2%
Two
0.9%
2.4%
3 or 4
2.9%
6.2%
5 to 9
7.1%
11.0%
10 to 19
9.5%
14.4%
20 to 49
6.2%
12.5%
50 or more
10.3%
12.1%
Mobile homes
1.4%
0.2%
Median real estate property taxes paid for housing units
Self-employed workers in own not incorporated business
25,780
9,860
State government workers
16,519
4,084
Unpaid family workers
1,214
397
Industries and Occupations
Banking and finance dominate Charlotte with companies like Bank of America and Wells Fargo having significant presence. Orlando is known for hospitality, entertainment, and tourism, but also has a growing tech industry. Biotech, video game design, and digital media are flourishing fields in Orlando.
Both cities have excellent healthcare systems. Charlotte is home to Atrium Health, one of the biggest public healthcare systems in the country, and Orlando has Orlando Health and the renowned AdventHealth.
Health (county statistics)
Type
Charlotte
Orlando
General health status score of residents in this county from 1 (poor) to 5 (excellent)
Charlotte boasts an impressive skyline and a well-planned downtown area. Orlando, while known for its expansive theme parks, also has a variety of residential and commercial structures. Both cities have good infrastructure, with continuous development and renovation projects.
Infrastructure
Type
Charlotte
Orlando
Hospitals
37
10
TV stations
16
29
Arenas or stadiums
3
2
Bank branches located here
202
194
Bank institutions located here
26
31
Main business address for public companies
33
39
Nuclear power plants nearby
2
0
Drinking water stations with no reported violations in the past
24
13
Drinking water stations with reported violations in the past
HMDA - Conventional home purchase loans - Applications denied
Year
Charlotte
Orlando
1999
3,049
1,290
2000
1,568
623
2001
1,382
376
2002
1,275
316
2003
1,879
778
2004
2,415
1,264
2005
3,078
2,988
2006
3,864
3,465
2007
3,106
3,112
2008
1,287
1,210
2009
617
324
Culture and Food
Charlotte is praised for its southern charm, craft beer scene and barbeque while Orlando is cosmopolitan with an eclectic food scene with influences from Caribbean, Asian, and Latin cultures due to its diverse population.
Sports Teams
For sports lovers, both cities have solid offerings. Charlotte has the Carolina Panthers (NFL) and the Charlotte Hornets (NBA). Orlando is home to the Orlando Magic (NBA) and Orlando City SC (MLS).


 Charlotte, NC
 Orlando, FL