Charlotte, NC is an exhilarating city that is growing in diversity and opportunity, which provides a mix of southern charm and bustling city life. South Aurora, CO, on the other hand, offers a relatively serene and high-quality lifestyle with breathtaking mountain views and a dense suburban feel. Both locations present unique offerings depending on your personal preferences.
Crime rates in both cities are a matter of consideration. Charlotte's crime rate is relatively high compared to the national average. However, many of the safest Charlotte neighborhoods like Dilworth and Myers Park offer secure environments. South Aurora has a fairly lower crime rate than Charlotte, also depends heavily on the neighborhood. In suburbs like Southshore and Tallyn's Reach, residents experience safer environments.
Cost of Living
The cost of living varies greatly between Charlotte, NC, and South Aurora, CO. Charlotte is generally more affordable than South Aurora, particularly when considering housing prices. Everyday expenses like groceries, healthcare, and utilities are also notably lower in Charlotte.
Income Tax
In Charlotte, NC residents pay a flat state income tax rate of 5.25%. In contrast, Colorado uses a flat tax system too, with a state income tax rate of 4.63%.
Property Tax
Property taxes are lower in Charlotte, NC compared to South Aurora, CO, making homeownership somewhat more affordable in Charlotte.
Sales Tax
Sales tax in Charlotte, NC is 7.25% while in South Aurora, the rate is considerably higher at 8.5%. These differences can certainly impact your spending habits.
Income
Type
Charlotte
South Aurora
Estimated median household income
$70,869
$80,212
Estimated per capita income
$44,593
$39,129
Cost of living index (U.S. average is 100)
93.2
110.1
If you make $50,000 in Charlotte, you will have to make $59,067 in South Aurora to maintain the same standard of living.
Geographical Conditions
Charlotte, NC is characterized by flat, rolling hills and plush, green urban areas. South Aurora, CO, on the other hand, provides beautiful mountain views and access to numerous outdoor activities.
Geographical information
Type
Charlotte
South Aurora
Land area
242.3 sq. miles
78.4 sq. miles
Population density
3,631.1 people per sq. mile
4,199.1 people per sq. mile
Relative area comparison
Charlotte, NC South Aurora, CO
Education
Both Charlotte and South Aurora boast strong school systems. Charlotte-Mecklenburg Schools is one of the highest-ranking districts in North Carolina, with many top-rated schools. Aurora, CO, also offers top-tier education, with Cherry Creek School District remaining one of the best districts in the state.
Charlotte's robust economy is primarily driven by the banking industry, being the second-largest banking center in the United States. South Aurora's economy, alternatively, is diverse with industries like healthcare, education, and retail leading the way. Both cities offer promising opportunities for job seekers.
Biggest Employers
Bank of America and Wells Fargo are among the biggest employers in Charlotte. In South Aurora, the University of Colorado Anschutz Medical Campus and Buckley Air Force Base employ thousands.
In Charlotte (Mecklenburg County), 60.8% voted for Democrats and 38.3% for Republicans in 2012 Presidential Election. In South Aurora (Arapahoe County), 54.4% voted for Democrats and 44.4% for Republicans.
Elections
Type
Democrats
Republicans
Other
Year
Charlotte
South Aurora
Charlotte
South Aurora
Charlotte
South Aurora
2020
66.8%
61.3%
31.6%
36.6%
1.6%
2.1%
2016
62.3%
53.1%
32.9%
38.9%
4.8%
8.1%
2012
60.8%
54.4%
38.3%
44.4%
0.9%
1.3%
2008
62.0%
56.0%
37.6%
43.0%
0.5%
1.0%
2004
51.7%
47.6%
48.0%
51.6%
0.3%
0.8%
2000
48.4%
43.6%
51.1%
51.6%
0.5%
4.8%
1996
48.6%
41.9%
45.9%
50.8%
5.5%
7.3%
Breakdown of population affiliated with a religious congregation
Type
Adherents
Congregations
Religion
Charlotte
South Aurora
Charlotte
South Aurora
SOUTHERN BAPTIST CONVENTION
9.0%
1.6%
19.0%
9.9%
CATHOLIC CHURCH
8.5%
12.1%
1.8%
4.3%
AMERICAN BAPTIST CHURCHES IN THE USA
2.3%
0.1%
1.1%
1.7%
EPISCOPAL CHURCH
1.2%
0.4%
1.3%
1.7%
EVANGELICAL LUTHERAN CHURCH IN AMERICA
0.9%
2.0%
1.8%
4.3%
PRESBYTERIAN CHURCH IN AMERICA
0.6%
0.0%
1.9%
0.7%
SEVENTH DAY ADVENTIST CHURCH
0.5%
0.2%
1.5%
2.6%
LUTHERAN CHURCH
0.3%
1.0%
0.9%
2.6%
MUSLIM ESTIMATE
0.3%
1.9%
1.2%
1.0%
EVANGELICAL PRESBYTERIAN CHURCH
0.2%
0.6%
0.7%
2.6%
VINEYARD USA
0.0%
0.5%
0.1%
0.3%
Weather
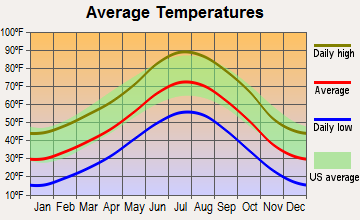
Charlotte, NC has a humid subtropical climate with four distinct seasons. Summers are hot and humid, while winters are generally short and cool. South Aurora, CO, on the other hand, offers a semi-arid continental climate, experiencing dry, sunny summers and cold, snowy winters. If you enjoy outdoor activities year-round, Aurora's climate has its appeal.
Weather and climate
Type
Charlotte
South Aurora
Temperature - Average
61°F
49.9°F
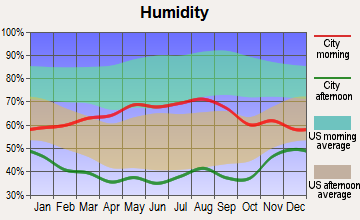
Humidity - Average morning or afternoon humidity
72.3%
50.6%
Humidity - Differences between morning and afternoon humidity
41%
20%
Humidity - Maximum monthly morning or afternoon humidity
87%
55%
Humidity - Minimum monthly morning or afternoon humidity
46%
35%
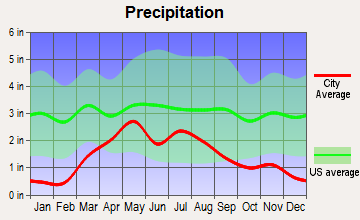
Precipitation - Yearly average
44.5 in
17.6 in
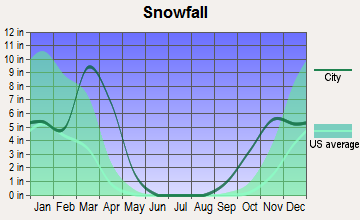
Snowfall - Yearly average
10.2 in
114 in
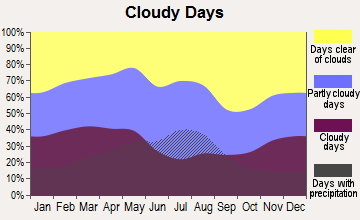
Clouds - Number of days clear of clouds
18.1%
19.2%
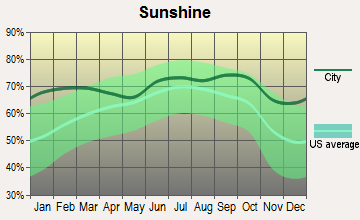
Sunshine amount - Average
69.8%
75.6%
Sunshine amount - Differences during a year
14%
10%
Sunshine amount - Maximum monthly
70%
74%
Sunshine amount - Minimum monthly
56%
64%
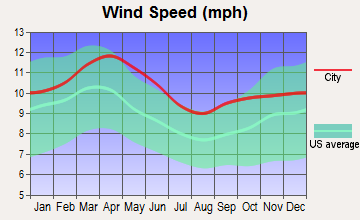
Wind speed - Average
6.9 mph
8.6 mph
Average climate in Charlotte, North Carolina
Average climate in South Aurora, Colorado
Air pollution
Type
AQI
CO
NO2
OZONE
PB
PM10
PM25
SO2
Year
Charlotte
South Aurora
Charlotte
South Aurora
Charlotte
South Aurora
Charlotte
South Aurora
Charlotte
South Aurora
Charlotte
South Aurora
Charlotte
South Aurora
Charlotte
South Aurora
2018
75
99
0.24
0.37
6.3
21.6
27.8
31.9
N/A
N/A
15.5
29.2
8.2
8.5
0.2
0.7
2017
77
95
0.25
0.37
7.0
22.0
28.0
31.8
N/A
N/A
16.3
22.0
8.8
8.4
0.2
0.9
2016
82
90
0.25
0.43
7.6
24.0
28.7
31.3
N/A
N/A
N/A
22.6
8.4
8.1
0.2
1.0
2015
76
101
0.25
0.44
8.1
23.0
27.6
30.2
N/A
N/A
N/A
20.6
8.6
9.6
0.2
1.1
2014
76
94
0.26
0.43
8.5
22.0
26.3
30.3
N/A
N/A
N/A
22.7
9.3
10.1
0.3
1.3
2013
71
84
0.29
0.39
8.4
19.7
25.5
30.7
N/A
N/A
N/A
22.0
8.6
N/A
0.3
1.4
2012
95
90
0.28
0.34
8.7
18.9
27.3
31.4
N/A
N/A
N/A
24.3
9.7
N/A
0.3
1.2
2011
94
91
0.34
0.34
10.1
18.1
28.9
31.5
N/A
N/A
N/A
23.8
11.2
N/A
0.6
1.5
2010
97
81
0.33
0.41
11.8
16.3
28.0
29.3
N/A
N/A
N/A
26.6
11.6
N/A
1.0
1.0
2009
82
79
0.30
0.37
10.0
14.1
25.4
27.3
N/A
0.005
N/A
22.6
11.1
N/A
0.9
1.3
2008
102
85
0.32
0.41
11.2
17.3
27.6
29.1
N/A
0.008
N/A
25.5
13.0
N/A
2.1
1.6
2007
108
96
0.37
0.41
13.9
20.6
29.1
25.7
0.001
0.007
N/A
28.9
14.5
N/A
3.0
1.2
2006
107
89
0.44
0.50
13.9
19.0
27.3
25.4
0.000
0.026
N/A
28.0
14.8
N/A
3.3
1.4
2005
109
86
0.53
0.57
14.6
21.3
30.6
22.7
0.000
0.106
N/A
29.6
15.2
N/A
2.7
1.5
2004
89
82
0.53
0.61
14.6
21.2
28.9
21.6
0.001
0.035
N/A
28.6
N/A
N/A
2.8
1.8
2003
85
106
0.57
0.61
15.6
21.2
27.6
23.4
0.003
0.038
N/A
32.6
N/A
N/A
3.0
1.9
2002
103
86
0.63
0.64
15.3
19.2
32.6
23.0
0.003
0.027
N/A
35.7
N/A
N/A
2.7
2.5
2001
108
95
0.72
0.79
17.5
23.8
32.3
20.8
0.005
0.029
N/A
32.6
N/A
N/A
3.9
2.6
2000
107
93
0.79
0.77
18.0
13.7
32.6
21.7
0.014
0.032
N/A
12.2
N/A
N/A
4.4
2.1
Natural disasters
Type
Charlotte
South Aurora
Tornado activity compared to U.S. average
111.5%
137.7%
Earthquake activity compared to U.S. average
79%
797.1%
Natural disasters compared to U.S. average
9%
10%
Transportation
Charlotte has an expanding public transit system including buses, light rail, and streetcar services. South Aurora, while more car-dependent, has access to the Denver RTD light rail system. Commuting times in both cities are comparable, depending on your specific location.
Transport
Type
Charlotte
South Aurora
Amtrak stations
1
0
Amtrak stations nearby
2
2
FAA registered aircraft
439
0
FAA registered aircraft manufacturers and dealers
12
0
Means of transportation to work
Type
Charlotte
South Aurora
Bicycle
0.1%
0.2%
Bus
1.2%
3.5%
Carpooled
8.7%
12%
Car alone
86.2%
78.6%
Railroad
0.4%
0%
Taxicab
0.2%
0.1%
Walked
1.5%
1.3%
Average travel time to work
Type
Charlotte
South Aurora
Average
29.6 min
27.5 min
Real Estate
Charlotte's real estate market is hot, with home prices steadily rising. South Aurora also has a strong housing market, but the average home price is significantly higher than in Charlotte.
Neighborhoods
Charlotte’s neighborhoods range from the quiet, historic streets of Dilworth to the bustling urban district of Uptown. South Aurora offers wonderful suburban neighborhoods like Southshore, known for its friendliness and excellent schools.
Houses and residents
Type
Charlotte
South Aurora
Houses
393,631
119,373
Average household size (people)
2.5
2.6
Houses occupied
365,269 (92.8%)
115,977 (97.2%)
Houses occupied by owners
193,930 (53.1%)
76,163 (65.7%)
Houses occupied by renters
171,339 (46.9%)
39,814 (34.3%)
Median rent asked for vacant for-rent units
$1,482
$1,519
Median price asked for vacant for-sale houses and condos
$445,491
$836,561
Estimated median house or condo value
$321,400
$439,151
Median number of rooms in apartments
4
3.9
Median number of rooms in houses and condos
6.6
7.2
Renting percentage
42.6%
38.4%
Housing density (houses/condos per square mile)
1,624.8
1,522.9
Household income disparities
44.1%
40.8%
Housing units without a mortgage
3,089 (2.1%)
6,903 (10.6%)
Housing units with both a second mortgage and home equity loan
10,553 (7.2%)
358 (0.6%)
Housing units with a mortgage
142,912 (97.9%)
57,942 (89.4%)
Housing units with a home equity loan
171 (0.1%)
5,373 (8.3%)
Housing units with a second mortgage
13,532 (9.3%)
10,116 (15.6%)
Housing units lacking complete kitchen facilities
0.8%
0.4%
Housing units lacking complete plumbing facilities
Self-employed workers in own not incorporated business
25,780
8,665
State government workers
16,519
4,200
Unpaid family workers
1,214
351
Industries and Occupations
In Charlotte, the finance sector is the biggest employer, followed by the energy sector with companies like Duke Energy. South Aurora has a large healthcare industry with the Anschutz Medical Campus and a growing tech scene, offering a variety of occupations.
Both Charlotte and South Aurora have excellent healthcare facilities. Charlotte has Atrium Health and Novant Health, while South Aurora is home to the UCHealth University of Colorado Hospital, all are nationally recognized for top-tier care.
Health (county statistics)
Type
Charlotte
South Aurora
General health status score of residents in this county from 1 (poor) to 5 (excellent)
Charlotte has an impressive infrastructure with vast freeway systems and an expanding light rail system. South Aurora, while predominantly car-dependent, is also investing in its infrastructure with initiatives to boost public transportation facilities.
Infrastructure
Type
Charlotte
South Aurora
TV stations
16
14
Nuclear power plants nearby
2
0
Culture and Food
Charlotte offers a vibrant arts scene and a thriving food culture with its Southern cuisine. South Aurora boasts a mix of cuisines and cultural experiences with close proximity to Denver's arts and culture scene.
Sports Teams
For sports enthusiasts, Charlotte is home to the Carolina Panthers (NFL) and Charlotte Hornets (NBA). South Aurora residents support Denver-based teams like the Broncos (NFL) and Nuggets (NBA).
 Charlotte, NC
 South Aurora, CO