Deciding between Charlotte, North Carolina and Southeast Montgomery, Texas relies heavily upon personal preference. While both offer unique attributes, the two cities differ greatly in terms of culture, cost of living, and geographic landscapes. Charlotte presents the appeal of a big city with its bustling economy and numerous industries, whereas Southeast Montgomery offers a much slower pace, giving residents the tranquility of a rural setting. Regardless of personal needs, both cities offer something that could meet anyone's criteria for a perfect living or visit location.
For residents and tourists alike, safety is a critical issue. According to national data, Charlotte has a slightly higher crime rate than Southeast Montgomery. The latter benefits from its smaller size and community-oriented setting, typically ensuring lower crime rates. However, it's important to keep in mind that, while the rate is higher, Charlotte also has an extensive police department that actively works towards maintaining law and order. Both cities have safe neighborhoods to live and visit, with well-executed community watch programs.
Cost of Living
The cost of living is relatively cheaper in Southeast Montgomery compared to Charlotte, mainly driven by housing costs. The cost of utilities, groceries, and healthcare in Southeast Montgomery offers more affordability than Charlotte. However, Charlotte's higher cost of living is somewhat offset by its higher wages and job availability.
Income Tax
Texas has no state income tax, a significant advantage for Southeast Montgomery residents. In contrast, North Carolina imposes a flat tax rate of 5.25% on resident income.
Property Tax
Southeast Montgomery has a higher property tax rate compared to Charlotte. Despite this, the overall cost remains lower due to the cheaper property prices in this region.
Sales Tax
North Carolina’s state sales tax is higher than Texas. In Charlotte, the rate is roughly 7.25%, whereas Southeast Montgomery residents enjoy a lower rate of 6.25%.
Income
Type
Charlotte
Southeast Montgomery
Estimated median household income
$70,869
$85,955
Estimated per capita income
$44,593
$42,611
Cost of living index (U.S. average is 100)
93.2
101.8
If you make $50,000 in Charlotte, you will have to make $54,614 in Southeast Montgomery to maintain the same standard of living.
Geographical Conditions
Charlotte offers a blend of urban and natural landscapes with access to trails and mountains near the city. Southeast Montgomery is more rural, surrounded by parks and nature, a little distance from the hustle and bustle of Houston.
Geographical information
Type
Charlotte
Southeast Montgomery
Land area
242.3 sq. miles
483.9 sq. miles
Population density
3,631.1 people per sq. mile
596.7 people per sq. mile
Relative area comparison
Charlotte, NC Southeast Montgomery, TX
Education
Looking at education, Charlotte has a greater number of top-rated public and private schools and universities. It also offers vast opportunities for higher education at institutions such as the University of North Carolina. In contrast, Southeast Montgomery, while having commendable schools, does not offer the same array of educational institutions.
Charlotte's economy is more diversified, with strong sectors in banking, technology, and healthcare. Indeed, it has a larger job market and offers higher wages than Southeast Montgomery. The latter’s economy revolves more around construction, oil, gas extraction, and public administration. Nonetheless, for those looking for work-life balance and slower pace, Southeast Montgomery might be the perfect destination.
Biggest Employers
In Charlotte, the largest employers are healthcare and banking entities such as Atrium Health, Wells Fargo, and Bank of America. In contrast, Southeast Montgomery largest employers are primarily in the oil, gas extraction, and public administration sectors.
In Charlotte (Mecklenburg County), 60.8% voted for Democrats and 38.3% for Republicans in 2012 Presidential Election. In Southeast Montgomery (Montgomery County), 19.1% voted for Democrats and 79.9% for Republicans.
Elections
Type
Democrats
Republicans
Other
Year
Charlotte
Southeast Montgomery
Charlotte
Southeast Montgomery
Charlotte
Southeast Montgomery
2020
66.8%
27.5%
31.6%
71.4%
1.6%
1.2%
2016
62.3%
22.4%
32.9%
73.5%
4.8%
4.0%
2012
60.8%
19.1%
38.3%
79.9%
0.9%
1.0%
2008
62.0%
23.2%
37.6%
75.9%
0.5%
0.9%
2004
51.7%
21.4%
48.0%
78.2%
0.3%
0.4%
2000
48.4%
22.0%
51.1%
76.0%
0.5%
2.0%
1996
48.6%
26.5%
45.9%
65.2%
5.5%
8.3%
Breakdown of population affiliated with a religious congregation
Type
Adherents
Congregations
Religion
Charlotte
Southeast Montgomery
Charlotte
Southeast Montgomery
SOUTHERN BAPTIST CONVENTION
9.0%
19.0%
19.0%
34.7%
CATHOLIC CHURCH
8.5%
12.8%
1.8%
1.2%
AMERICAN BAPTIST CHURCHES IN THE USA
2.3%
0.0%
1.1%
0.0%
EPISCOPAL CHURCH
1.2%
0.4%
1.3%
0.6%
EVANGELICAL LUTHERAN CHURCH IN AMERICA
0.9%
0.5%
1.8%
1.5%
PRESBYTERIAN CHURCH IN AMERICA
0.6%
0.1%
1.9%
0.3%
SEVENTH DAY ADVENTIST CHURCH
0.5%
0.2%
1.5%
1.5%
LUTHERAN CHURCH
0.3%
0.3%
0.9%
1.2%
MUSLIM ESTIMATE
0.3%
2.2%
1.2%
1.2%
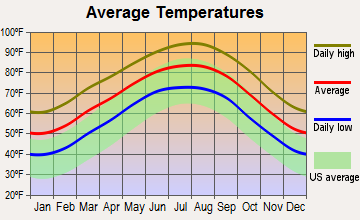
Weather
When it comes to weather, Charlotte tends to be humid with mild winters but hot, sweltering summers, a typical Southern climate. On the other hand, Southeast Montgomery experiences a slightly hotter climate overall, with a higher risk of hurricanes due to its proximity to the Gulf Coast. Both cities have diverse weather patterns, which tourists and potential residents should consider when planning a visit or move.
Weather and climate
Type
Charlotte
Southeast Montgomery
Temperature - Average
61°F
68.1°F
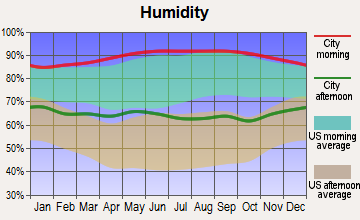
Humidity - Average morning or afternoon humidity
72.3%
80.3%
Humidity - Differences between morning and afternoon humidity
41%
36.9%
Humidity - Maximum monthly morning or afternoon humidity
87%
93%
Humidity - Minimum monthly morning or afternoon humidity
46%
56%
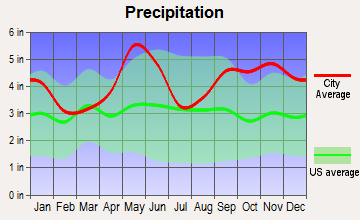
Precipitation - Yearly average
44.5 in
49.8 in
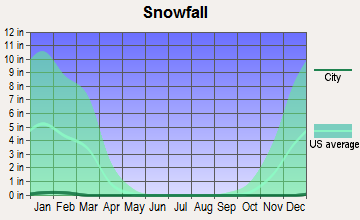
Snowfall - Yearly average
10.2 in
0.6 in
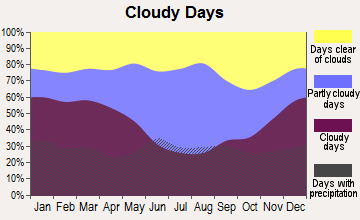
Clouds - Number of days clear of clouds
18.1%
15%
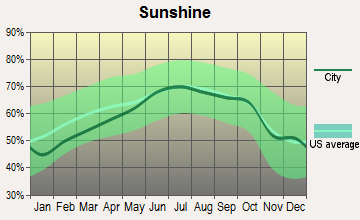
Sunshine amount - Average
69.8%
60.4%
Sunshine amount - Differences during a year
14%
24%
Sunshine amount - Maximum monthly
70%
67%
Sunshine amount - Minimum monthly
56%
43%
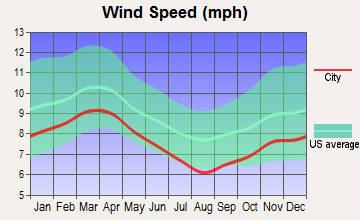
Wind speed - Average
6.9 mph
8.1 mph
Average climate in Charlotte, North Carolina
Average climate in Southeast Montgomery, Texas
Air pollution
Type
AQI
CO
NO2
OZONE
PB
PM10
PM25
SO2
Year
Charlotte
Southeast Montgomery
Charlotte
Charlotte
Southeast Montgomery
Charlotte
Southeast Montgomery
Charlotte
Charlotte
Charlotte
Southeast Montgomery
Charlotte
2018
75
93
0.24
N/A
6.3
2.9
27.8
26.5
N/A
N/A
15.5
N/A
8.2
8.3
0.2
N/A
2017
77
92
0.25
N/A
7.0
3.1
28.0
27.5
N/A
N/A
16.3
N/A
8.8
8.6
0.2
N/A
2016
82
81
0.25
N/A
7.6
3.5
28.7
27.0
N/A
N/A
N/A
N/A
8.4
8.7
0.2
N/A
2015
76
93
0.25
N/A
8.1
3.4
27.6
26.0
N/A
N/A
N/A
N/A
8.6
9.2
0.2
N/A
2014
76
84
0.26
N/A
8.5
3.6
26.3
26.3
N/A
N/A
N/A
N/A
9.3
9.3
0.3
N/A
2013
71
100
0.29
N/A
8.4
3.2
25.5
27.6
N/A
N/A
N/A
N/A
8.6
9.7
0.3
N/A
2012
95
102
0.28
N/A
8.7
4.6
27.3
26.4
N/A
N/A
N/A
N/A
9.7
10.2
0.3
N/A
2011
94
113
0.34
N/A
10.1
5.0
28.9
29.5
N/A
N/A
N/A
N/A
11.2
10.9
0.6
N/A
2010
97
100
0.33
N/A
11.8
5.0
28.0
26.4
N/A
N/A
N/A
N/A
11.6
11.0
1.0
N/A
2009
82
106
0.30
N/A
10.0
4.9
25.4
25.9
N/A
N/A
N/A
N/A
11.1
10.9
0.9
N/A
2008
102
99
0.32
N/A
11.2
5.4
27.6
27.2
N/A
N/A
N/A
N/A
13.0
11.3
2.1
N/A
2007
108
115
0.37
N/A
13.9
5.9
29.1
25.3
0.001
N/A
N/A
N/A
14.5
11.4
3.0
N/A
2006
107
113
0.44
N/A
13.9
6.5
27.3
28.8
0.000
N/A
N/A
N/A
14.8
11.3
3.3
N/A
2005
109
120
0.53
N/A
14.6
6.9
30.6
29.2
0.000
N/A
N/A
N/A
15.2
12.8
2.7
N/A
2004
89
103
0.53
N/A
14.6
6.8
28.9
26.5
0.001
N/A
N/A
N/A
N/A
N/A
2.8
N/A
2003
85
115
0.57
N/A
15.6
7.4
27.6
26.4
0.003
N/A
N/A
N/A
N/A
N/A
3.0
N/A
2002
103
113
0.63
N/A
15.3
7.4
32.6
26.6
0.003
N/A
N/A
N/A
N/A
N/A
2.7
N/A
2001
108
133
0.72
N/A
17.5
7.5
32.3
25.8
0.005
N/A
N/A
N/A
N/A
N/A
3.9
N/A
2000
107
120
0.79
N/A
18.0
6.3
32.6
27.9
0.014
N/A
N/A
N/A
N/A
N/A
4.4
N/A
Natural disasters
Type
Charlotte
Southeast Montgomery
Tornado activity compared to U.S. average
111.5%
174%
Earthquake activity compared to U.S. average
79%
69.7%
Natural disasters compared to U.S. average
9%
30%
Transportation
Charlotte’s transit system includes a light rail, bus services, and a bike-sharing program providing various commuting options. Southeast Montgomery, being smaller, relies predominantly on private vehicles for transportation with less extensive public transit options.
Transport
Type
Charlotte
Southeast Montgomery
Amtrak stations
1
0
Amtrak stations nearby
2
0
FAA registered aircraft
439
0
FAA registered aircraft manufacturers and dealers
12
0
Means of transportation to work
Type
Charlotte
Southeast Montgomery
Bicycle
0.1%
0.2%
Bus
1.2%
1.4%
Carpooled
8.7%
13.6%
Car alone
86.2%
79.1%
Motorcycle
0.1%
0.1%
Railroad
0.4%
0%
Taxicab
0.2%
0%
Walked
1.5%
1.1%
Average travel time to work
Type
Charlotte
Southeast Montgomery
Average
29.6 min
32 min
Real Estate
Real estate cost is cheaper in Southeast Montgomery than Charlotte. Also, Texas has no income tax, making it more attractive for potential homeowners. Charlotte, however, has seen a significant increase in the real estate market due to the city’s job growth, resulting in higher property prices.
Neighborhoods
Charlotte offers diverse neighborhoods from the bustling Uptown with its high-energy nightlife to the family-friendly Myers Park. Southeast Montgomery, while smaller, has safe and close-knit communities perfect for families and retirees.
Houses and residents
Type
Charlotte
Southeast Montgomery
Houses
393,631
77,705
Average household size (people)
2.5
2.8
Houses occupied
365,269 (92.8%)
72,515 (93.3%)
Houses occupied by owners
193,930 (53.1%)
53,683 (74%)
Houses occupied by renters
171,339 (46.9%)
18,832 (26%)
Median rent asked for vacant for-rent units
$1,482
$1,329
Median price asked for vacant for-sale houses and condos
$445,491
$298,290
Estimated median house or condo value
$321,400
$288,981
Median number of rooms in apartments
4
4
Median number of rooms in houses and condos
6.6
6.8
Renting percentage
42.6%
30.6%
Housing density (houses/condos per square mile)
1,624.8
160.6
Household income disparities
44.1%
43.3%
Housing units without a mortgage
3,089 (2.1%)
10,543 (25.7%)
Housing units with both a second mortgage and home equity loan
10,553 (7.2%)
21 (0.1%)
Housing units with a mortgage
142,912 (97.9%)
30,480 (74.3%)
Housing units with a home equity loan
171 (0.1%)
1,769 (4.3%)
Housing units with a second mortgage
13,532 (9.3%)
1,550 (3.8%)
Housing units lacking complete kitchen facilities
0.8%
1.1%
Housing units lacking complete plumbing facilities
Self-employed workers in own not incorporated business
25,780
6,391
State government workers
16,519
3,200
Unpaid family workers
1,214
296
Industries and Occupations
Diverse industries thrive in Charlotte, including financial services, healthcare, and technology. This is where Bank of America and Truist Financial have their headquarters. Meanwhile, Southeast Montgomery is largely driven by the oil, gas extraction, and construction industries, reflecting its Texas roots.
Charlotte has a more developed healthcare system, home to some top-rated hospitals in the region, notably Atrium Health. Southeast Montgomery residents often rely on Houston's expansive healthcare network for major medical needs.
Health (county statistics)
Type
Charlotte
Southeast Montgomery
General health status score of residents in this county from 1 (poor) to 5 (excellent)
Charlotte boasts a highly developed infrastructure complete with an international airport, extensive road systems and a growing public transit network. Southeast Montgomery, in contrast, has a smaller scale infrastructure focusing on essential services and local routes but offers less in terms of transportation diversity.
Infrastructure
Type
Charlotte
Southeast Montgomery
TV stations
16
27
Nuclear power plants nearby
2
0
Culture and Food
Charlotte offers a more diverse cultural scene, mirrored in the varied culinary offerings, music scene, and arts festivals. Southeast Montgomery embodies a laid-back Texan lifestyle focusing more on barbecue-centric cuisines and country music.
Sports Teams
For sports enthusiasts, Charlotte offers professional teams like the Carolina Panthers (NFL), Charlotte Hornets (NBA), and Charlotte FC (MLS). Southeast Montgomery doesn’t have local professional teams but residents support Houston-based teams.
 Charlotte, NC
 Southeast Montgomery, TX