Comparing the lifestyle in Charlotte, North Carolina, and St. Louis, Missouri, involves considering a variety of factors. Both have unique characteristics that hold great appeal depending on a person's preferences and lifestyle. Though differences exist in areas like weather, cost of living, safety, and socioeconomic aspects, both cities possess great cultural richness and opportunities for economic growth. Let's dive deeper into the comparison of these two dynamic American cities.
Distance between
Charlotte, NC and
St. Louis, MO : 570.8 miles
Charlotte's population is larger by 200%. Its population has grown by 338,881 people (62.7%) since 2000. The population of St. Louis has decreased by 54,879 people (15.8%) during that time.
Like any urban area, both Charlotte and St. Louis have their issues with crime; however, the situations differ. St. Louis has a relatively higher crime rate, particularly in some city neighborhoods, although effort is being made to improve this. It's advisable for both tourists and residents alike to research and stay aware of safer neighborhoods. On the other hand, Charlotte, while not without crime, generally has a lower crime rate. It's important to note that neighborhoods in both cities vary drastically, and safety can oftentimes depend on the specific area.
Cost of Living
Compared to St. Louis, Charlotte generally has a higher cost of living. This is particularly noticeable in housing where cost in Charlotte tends to be higher than in St. Louis. However, it's also important to note that wages, particularly in fields like finance and tech, can be higher in Charlotte, which may offset the increased cost of living. St. Louis offers a lower cost of living, on average, which may seem appealing to many.
Income Tax
Missouri's top income tax rate is 5.4%, which applies to St. Louis. North Carolina has a flat income tax rate of 5.25%, applicable for residents of Charlotte. This slight difference may impact high earners slightly more in St. Louis.
Property Tax
Property taxes are usually higher in St. Louis than in Charlotte, which may affect homeowners' annual costs. However, the relatively lower cost of homes in St. Louis can still make home-ownership affordable.
Sales Tax
Sales tax is lower in St. Louis at 4.225% than it is in Charlotte, which has a sales tax of 4.75%. However, individual municipalities in St. Louis can add on their own sales tax, which means actual costs may vary.
Income
Type
Charlotte
St. Louis
Estimated median household income
$70,869
$49,965
Estimated per capita income
$44,593
$33,810
Cost of living index (U.S. average is 100)
93.2
96.5
If you make $50,000 in Charlotte, you will have to make $51,770 in St. Louis to maintain the same standard of living.
Geographical Conditions
Charlotte sits in the Piedmont region, close to the mountains and coast, offering residents and visitors an array of outdoor activities. St. Louis is located at the confluence of the Mississippi and Missouri Rivers, with plenty of outdoor activities like boating and fishing.
Both cities take pride in their education systems. St. Louis is home to many prestigious universities, including Washington University. Charlotte, however, is recognized for its strong public school system and private institutions, alongside universities like UNC Charlotte. Depending on what level of schooling is being sought, both cities offer great opportunities.
Charlotte has a strong and diverse economy with a special emphasis on the finance sector; it's the second-largest banking center in the US after New York. St. Louis, while historically manufacturing-focused, has diversified its economy to include sectors like healthcare, biotechnology, and education. Job-seekers should consider their industries when choosing between the two cities.
Biggest Employers
In Charlotte, some of the biggest employers are Bank of America, Wells Fargo, and Atrium Health. St. Louis, on the other hand, has major employers like BJC Healthcare, Washington University, and Boeing Defense, Space & Security.
In Charlotte (Mecklenburg County), 60.8% voted for Democrats and 38.3% for Republicans in 2012 Presidential Election. In St. Louis (St. Louis city), 82.4% voted for Democrats and 15.9% for Republicans.
Elections
Type
Democrats
Republicans
Other
Year
Charlotte
St. Louis
Charlotte
St. Louis
Charlotte
St. Louis
2020
66.8%
82.4%
31.6%
16.1%
1.6%
1.6%
2016
62.3%
79.0%
32.9%
15.8%
4.8%
5.2%
2012
60.8%
82.4%
38.3%
15.9%
0.9%
1.6%
2008
62.0%
83.8%
37.6%
15.5%
0.5%
0.7%
2004
51.7%
80.4%
48.0%
19.2%
0.3%
0.3%
2000
48.4%
77.5%
51.1%
19.9%
0.5%
2.6%
1996
48.6%
74.8%
45.9%
18.1%
5.5%
7.1%
Breakdown of population affiliated with a religious congregation
Type
Adherents
Congregations
Religion
Charlotte
St. Louis
Charlotte
St. Louis
SOUTHERN BAPTIST CONVENTION
9.0%
2.5%
19.0%
9.0%
CATHOLIC CHURCH
8.5%
15.4%
1.8%
9.5%
AMERICAN BAPTIST CHURCHES IN THE USA
2.3%
1.8%
1.1%
2.4%
EPISCOPAL CHURCH
1.2%
0.5%
1.3%
1.5%
EVANGELICAL LUTHERAN CHURCH IN AMERICA
0.9%
0.2%
1.8%
1.0%
PRESBYTERIAN CHURCH IN AMERICA
0.6%
0.2%
1.9%
1.0%
SEVENTH DAY ADVENTIST CHURCH
0.5%
0.3%
1.5%
0.5%
LUTHERAN CHURCH
0.3%
2.2%
0.9%
6.1%
MUSLIM ESTIMATE
0.3%
1.1%
1.2%
2.4%
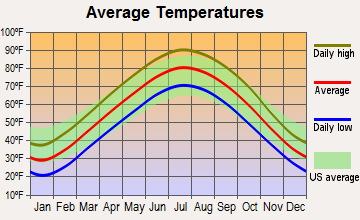
Weather
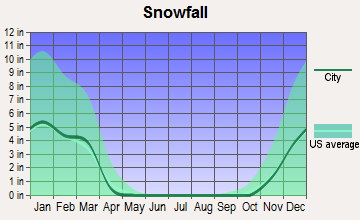
Weather in Charlotte and St. Louis is quite different. Charlotte typically has a milder climate, with hot, humid summers and mild to cool winters. Snow is relatively rare, which may be a selling point for those adverse to colder climates. St. Louis, on the other hand, experiences all four seasons distinctly. People living or visiting here can expect hot, humid summers and cold winters with moderate snowfall.
Weather and climate
Type
Charlotte
St. Louis
Temperature - Average
61°F
56.5°F
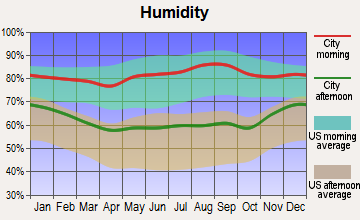
Humidity - Average morning or afternoon humidity
72.3%
74.8%
Humidity - Differences between morning and afternoon humidity
41%
32%
Humidity - Maximum monthly morning or afternoon humidity
87%
85%
Humidity - Minimum monthly morning or afternoon humidity
46%
53%
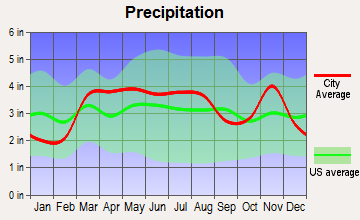
Precipitation - Yearly average
44.5 in
39 in
Snowfall - Yearly average
10.2 in
37.2 in
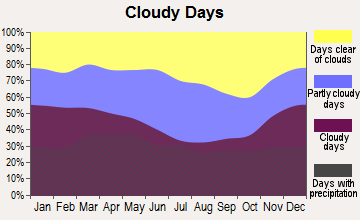
Clouds - Number of days clear of clouds
18.1%
16.7%
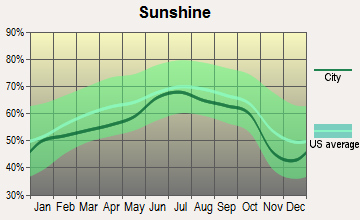
Sunshine amount - Average
69.8%
62.2%
Sunshine amount - Differences during a year
14%
30%
Sunshine amount - Maximum monthly
70%
71%
Sunshine amount - Minimum monthly
56%
41%
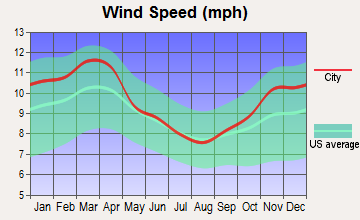
Wind speed - Average
6.9 mph
9.8 mph
Average climate in Charlotte, North Carolina
Average climate in St. Louis, Missouri
Air pollution
Type
AQI
CO
NO2
OZONE
PB
PM10
PM25
SO2
Year
Charlotte
St. Louis
Charlotte
St. Louis
Charlotte
St. Louis
Charlotte
St. Louis
Charlotte
St. Louis
Charlotte
St. Louis
Charlotte
St. Louis
Charlotte
St. Louis
2018
75
101
0.24
0.26
6.3
10.7
27.8
27.5
N/A
N/A
15.5
19.7
8.2
9.8
0.2
0.8
2017
77
90
0.25
0.25
7.0
10.4
28.0
28.5
N/A
N/A
16.3
16.2
8.8
8.0
0.2
1.4
2016
82
96
0.25
0.29
7.6
11.1
28.7
25.8
N/A
N/A
N/A
15.5
8.4
8.5
0.2
1.2
2015
76
97
0.25
0.28
8.1
11.8
27.6
22.2
N/A
N/A
N/A
16.6
8.6
10.5
0.2
1.6
2014
76
97
0.26
0.27
8.5
12.2
26.3
25.5
N/A
N/A
N/A
17.8
9.3
10.5
0.3
1.8
2013
71
92
0.29
0.27
8.4
12.2
25.5
26.2
N/A
N/A
N/A
16.3
8.6
10.6
0.3
2.1
2012
95
114
0.28
0.27
8.7
14.4
27.3
27.9
N/A
N/A
N/A
17.5
9.7
10.2
0.3
2.3
2011
94
107
0.34
0.27
10.1
13.2
28.9
27.0
N/A
N/A
N/A
17.3
11.2
12.4
0.6
2.7
2010
97
110
0.33
0.31
11.8
12.8
28.0
23.1
N/A
N/A
N/A
16.2
11.6
12.9
1.0
3.3
2009
82
101
0.30
0.31
10.0
12.5
25.4
22.2
N/A
0.039
N/A
21.6
11.1
12.4
0.9
2.8
2008
102
98
0.32
0.32
11.2
12.9
27.6
22.9
N/A
0.054
N/A
32.4
13.0
12.8
2.1
2.6
2007
108
125
0.37
0.37
13.9
14.1
29.1
24.3
0.001
0.055
N/A
38.8
14.5
14.6
3.0
2.9
2006
107
109
0.44
0.38
13.9
15.2
27.3
23.3
0.000
0.044
N/A
38.2
14.8
14.7
3.3
3.1
2005
109
110
0.53
0.39
14.6
16.3
30.6
24.4
0.000
0.056
N/A
41.4
15.2
N/A
2.7
4.1
2004
89
92
0.53
0.49
14.6
20.0
28.9
19.6
0.001
0.013
N/A
38.3
N/A
N/A
2.8
3.7
2003
85
106
0.57
0.49
15.6
19.6
27.6
21.7
0.003
0.044
N/A
37.8
N/A
N/A
3.0
3.7
2002
103
117
0.63
0.56
15.3
21.7
32.6
21.1
0.003
0.022
N/A
45.4
N/A
N/A
2.7
4.4
2001
108
100
0.72
0.57
17.5
22.4
32.3
20.4
0.005
0.057
N/A
46.6
N/A
N/A
3.9
5.0
2000
107
98
0.79
0.78
18.0
23.8
32.6
20.6
0.014
0.057
N/A
N/A
N/A
N/A
4.4
5.5
Natural disasters
Type
Charlotte
St. Louis
Tornado activity compared to U.S. average
111.5%
182.4%
Earthquake activity compared to U.S. average
79%
413.3%
Natural disasters compared to U.S. average
9%
0%
Transportation
St. Louis has a wider public transportation system, including buses and light rail transit, making navigating the city easier for commuters. Charlotte's public transport is less extensive, but the city is more car-friendly, and the average commute time is lesser due to less traffic.
Transport
Type
Charlotte
St. Louis
Amtrak stations
1
1
Amtrak stations nearby
2
2
FAA registered aircraft
439
0
FAA registered aircraft manufacturers and dealers
12
0
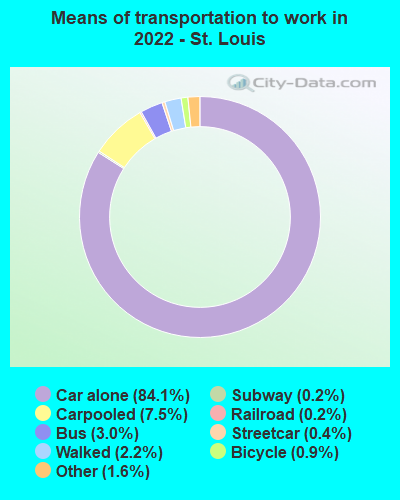
Means of transportation to work
Type
Charlotte
St. Louis
Bicycle
0.1%
0.5%
Bus
1.2%
3.7%
Carpooled
8.7%
7.5%
Car alone
86.2%
83.9%
Railroad
0.4%
0.3%
Streetcar
0%
0.2%
Subway
0%
0.3%
Taxicab
0.2%
0.3%
Walked
1.5%
2.5%
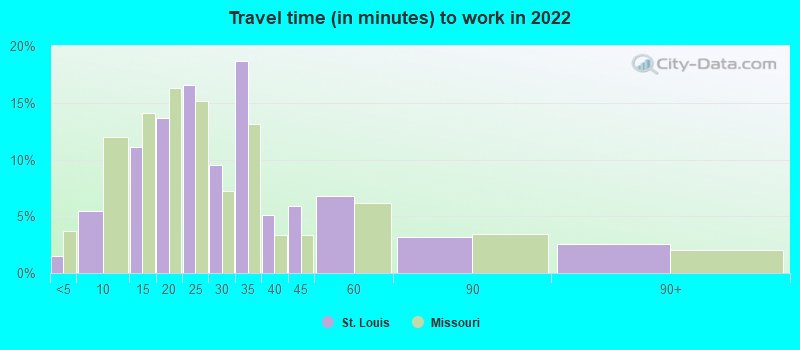
Average travel time to work
Type
Charlotte
St. Louis
Average
29.6 min
29.4 min
Other means
24.9 min
22.9 min
Public transportation
44.1 min
42.8 min
Private vehicle occupancy
Type
Charlotte
St. Louis
Average
1.2
1.1
Drove alone
90%
91.6%
In 2 person carpool
6.9%
6.5%
In 3 person carpool
1.8%
1%
In 4 person carpool
0.8%
0.1%
In 5-6 person carpool
0.5%
0.1%
In 7+ person carpool
0.1%
0.7%
How many people usually rode to work in the car, truck or van.
Real Estate
Both cities offer varied real estate options from downtown apartments to suburban homes. Charlotte's real-estate market, however, tends to be more expensive, reflecting the city's rapid growth and development. St. Louis offers more affordable housing, making it attractive to those looking for lower living expenses.
Neighborhoods
Each city boasts unique neighborhoods offering different vibes. Charlotte's neighborhoods, like Myers Park and SouthPark, offer southern charm and easy access to shopping and dining. St. Louis neighborhoods like Central West End and The Hill offer historic charm, with numerous dining and entertainment options.
Houses and residents
Type
Charlotte
St. Louis
Houses
393,631
173,493
Average household size (people)
2.5
2.2
Median year apartment built
1998
1943
Length of stay in the house since moving in
11.8 years
14.2 years
Houses occupied
365,269 (92.8%)
139,736 (80.5%)
Houses occupied by owners
193,930 (53.1%)
63,653 (45.6%)
Houses occupied by renters
171,339 (46.9%)
76,083 (54.4%)
Median rent asked for vacant for-rent units
$1,482
$923.98
Median monthly housing costs
$1,302
$883
Median price asked for vacant for-sale houses and condos
$445,491
$56,913
Estimated median house or condo value
$321,400
$170,800
Median numbers of rooms
5.3
4.8
Median number of rooms in apartments
4
4
Median number of rooms in houses and condos
6.6
5.9
Median house price - detached houses
$388,029
$196,007
Median house price - in 2-unit structures
$184,325
$166,673
Median house price - in 3-to-4-unit structures
$178,624
$155,363
Median house price - in 5 or more unit structures
$433,957
$260,843
Median house price - mobile homes
$52,977
$35,054
Median house price - Townhouses or other attached units
$296,370
$272,667
Median house price - All housing units
$378,423
$200,041
Median house age
26
2,021
Renting percentage
42.6%
54.6%
Housing density (houses/condos per square mile)
1,624.8
2,801.7
House value disparities
33.3%
38.7%
Household income disparities
44.1%
48.3%
Median household income for houses/condes with a mortgage
$105,905
$87,762
Median household income for apartments without a mortgage
$70,681
$55,824
Housing units without a mortgage
3,089 (2.1%)
1,236 (2.9%)
Housing units with both a second mortgage and home equity loan
10,553 (7.2%)
2,537 (6%)
Housing units with a mortgage
142,912 (97.9%)
41,018 (97.1%)
Housing units with a home equity loan
171 (0.1%)
188 (0.4%)
Housing units with a second mortgage
13,532 (9.3%)
3,349 (7.9%)
House/condo owner moved in on average (years ago)
9
10
House/condo renter moved in on average (years ago)
1
2
Housing units lacking complete kitchen facilities
0.8%
9.2%
Housing units lacking complete plumbing facilities
0.2%
5.8%
Housing units in structures
Housing units in structures
Charlotte
St. Louis
One, detached
52.7%
43.2%
One, attached
9.1%
4.1%
Two
0.9%
14.2%
3 or 4
2.9%
13.5%
5 to 9
7.1%
4.9%
10 to 19
9.5%
2.2%
20 to 49
6.2%
3.8%
50 or more
10.3%
13.5%
Mobile homes
1.4%
0.5%
Median real estate property taxes paid for housing units
Self-employed workers in own not incorporated business
25,780
8,126
State government workers
16,519
2,962
Unpaid family workers
1,214
315
Industries and Occupations
St. Louis has a diverse economic infrastructure with growing industries in tech, health care, and education. Conversely, Charlotte is known for its banking and financial services sector, with many opportunities for white-collar jobs. However, both cities have a range of job opportunities across various sectors.
Healthcare is a significant sector in both cities. St. Louis is recognized for its exceptional healthcare services, with prestigious hospitals like Barnes-Jewish Hospital and St. Louis Children's Hospital. Charlotte also offers high-quality healthcare services with noted establishments like Atrium Health Carolinas Medical Center and Novant Health Presbyterian Medical Center.
Health (county statistics)
Type
Charlotte
St. Louis
General health status score of residents in this county from 1 (poor) to 5 (excellent)
Charlotte has seen significant infrastructure development in recent years with improved roads, transit systems, and an international airport regularly ranked highly for efficiency. St. Louis also provides robust infrastructure, with a more extensive public transportation network and a strategic geographic location that's been beneficial for the freight and transportation industry.
HMDA - Conventional home purchase loans - Applications denied
Year
Charlotte
St. Louis
1999
3,049
0
2000
1,568
0
2001
1,382
0
2002
1,275
0
2003
1,879
1,583
2004
2,415
2,101
2005
3,078
2,853
2006
3,864
3,391
2007
3,106
2,022
2008
1,287
841
2009
617
247
Culture and Food
Both cities offer rich cultural experiences. Charlotte is popular for NASCAR popularity and a dynamic food scene featuring southern cuisine. St. Louis natives take pride in their unique BBQ-style and love of sports, backed by rich jazz and blues music traditions.
Sports Teams
Sports enthusiasts have something to cheer about in both cities. St. Louis houses the MLB Cardinals and NHL Blues. Meanwhile, Charlotte is home to the NFL Panthers, NBA Hornets, and the NASCAR Hall of Fame.


 Charlotte, NC
 St. Louis, MO