Charlotte and Winston-Salem, both located in North Carolina, provide distinct living experiences. With Charlotte being one of the largest cities in the US, it has more to offer in terms of job opportunities and urban amenities. Winston-Salem, however, is known for its small-town charm and lower cost of living. In this comparison, we'll delve into various aspects of life in these cities, providing valuable insights for potential residents and tourists alike.
Distance between
Charlotte, NC and
Winston-Salem, NC : 69.6 miles
Charlotte's population is larger by 251%. Its population has grown by 338,881 people (62.7%) since 2000. The population of Winston-Salem has grown by 64,544 people (34.7%) during that time.
When comparing crime rates, Charlotte has a higher crime rate than Winston-Salem. Charlotte's crime rate is higher than the national average, which might be a concern for potential residents or visitors. However, it's worth noting that safer neighborhoods with lower crime rates do exist in the city. Conversely, Winston-Salem, with its relatively small population, records less crime and is generally safer.
Cost of Living
Charlotte, being more populous and cosmopolitan, has a higher cost of living compared to Winston-Salem. Housing is one of the major contributors to this higher cost. However, the city compensates with higher salaries and more job opportunities. Winston-Salem, on the other hand, offers a lower cost of living, making it attractive for those hunting for affordability.
Income Tax
North Carolina follows a flat income tax rate system, meaning all taxpayers, regardless of their income level, are taxed at the same rate. The current flat rate is 5.25%.
Property Tax
The property tax in Charlotte is slightly higher than in Winston-Salem. The tax revenue is important for public amenities and services. While higher property taxes may be a downside for some, it reflects the urban amenities that Charlotte offers.
Sales Tax
In both Charlotte and Winston-Salem, the combined state and local sales tax rate is 7.25%. This is considered moderate compared to other US cities.
Income
Type
Charlotte
Winston-Salem
Estimated median household income
$70,869
$54,228
Estimated per capita income
$44,593
$34,025
Cost of living index (U.S. average is 100)
93.2
88.3
If you make $50,000 in Winston-Salem, you will have to make $52,775 in Charlotte to maintain the same standard of living.
Geographical Conditions
Charlotte is located in the Piedmont region, featuring rolling hills and proximity to both the mountains and coast. Winston-Salem, while also in the Piedmont region, is closer to the mountains. Both cities offer recreational activities and natural beauty.
Charlotte offers a wider range of educational institutions and opportunities because of its larger size. It is home to prestigious universities like the University of North Carolina at Charlotte. Winston-Salem also offers quality education and is the home to the globally recognized Wake Forest University. Both cities have reputable public and private schools for K-12 education.
In terms of work and economy, Charlotte, home to several Fortune 500 companies like Bank of America and Lowe's, offers more opportunities. The city enjoys a solid economy thanks to its banking and energy sectors. On the other hand, Winston-Salem has a diversified economy with healthcare, education, and retail trade being the primary sectors, providing substantial job opportunities.
Biggest Employers
The largest employers in Charlotte include Bank of America, Wells Fargo, and Carolinas Healthcare System. In Winston-Salem, Novant Health, Wake Forest Baptist Medical Center, and Reynolds American are the biggest employers.
In Charlotte (Mecklenburg County), 60.8% voted for Democrats and 38.3% for Republicans in 2012 Presidential Election. In Winston-Salem (Forsyth County), 53.2% voted for Democrats and 45.9% for Republicans.
Elections
Type
Democrats
Republicans
Other
Year
Charlotte
Winston-Salem
Charlotte
Winston-Salem
Charlotte
Winston-Salem
2020
66.8%
56.4%
31.6%
42.4%
1.6%
1.2%
2016
62.3%
53.0%
32.9%
42.6%
4.8%
4.4%
2012
60.8%
53.2%
38.3%
45.9%
0.9%
0.9%
2008
62.0%
55.0%
37.6%
44.5%
0.5%
0.6%
2004
51.7%
45.5%
48.0%
54.1%
0.3%
0.4%
2000
48.4%
43.4%
51.1%
56.0%
0.5%
0.6%
1996
48.6%
41.5%
45.9%
52.8%
5.5%
5.7%
Breakdown of population affiliated with a religious congregation
Type
Adherents
Congregations
Religion
Charlotte
Winston-Salem
Charlotte
Winston-Salem
SOUTHERN BAPTIST CONVENTION
9.0%
10.3%
19.0%
15.6%
CATHOLIC CHURCH
8.5%
4.0%
1.8%
1.4%
AMERICAN BAPTIST CHURCHES IN THE USA
2.3%
1.4%
1.1%
1.1%
EPISCOPAL CHURCH
1.2%
1.3%
1.3%
1.4%
EVANGELICAL LUTHERAN CHURCH IN AMERICA
0.9%
0.5%
1.8%
1.1%
PRESBYTERIAN CHURCH IN AMERICA
0.6%
0.3%
1.9%
1.4%
SEVENTH DAY ADVENTIST CHURCH
0.5%
0.6%
1.5%
0.9%
LUTHERAN CHURCH
0.3%
0.5%
0.9%
0.7%
MUSLIM ESTIMATE
0.3%
0.4%
1.2%
0.7%
EVANGELICAL PRESBYTERIAN CHURCH
0.2%
0.6%
0.7%
0.5%
MORAVIAN CHURCH IN AMERICA
0.1%
3.1%
0.4%
7.1%
Weather
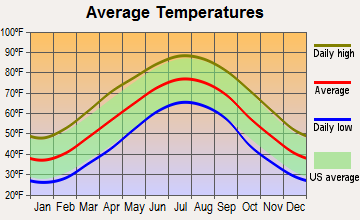
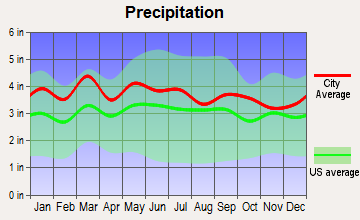
Both cities experience a humid subtropical climate, with hot summers and cool winters. Charlotte sees more rainfall annually compared to Winston-Salem, which might not appeal to people who prefer drier climates. However, the weather in both cities can be managed with proper preparation and is generally mild.
Weather and climate
Type
Charlotte
Winston-Salem
Temperature - Average
61°F
57.5°F
Humidity - Average morning or afternoon humidity
72.3%
72.8%
Humidity - Differences between morning and afternoon humidity
41%
42%
Humidity - Maximum monthly morning or afternoon humidity
87%
88%
Humidity - Minimum monthly morning or afternoon humidity
46%
46%
Precipitation - Yearly average
44.5 in
44.5 in
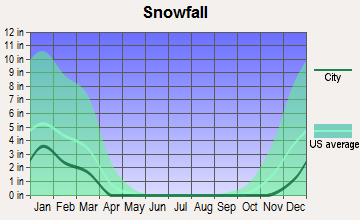
Snowfall - Yearly average
10.2 in
17 in
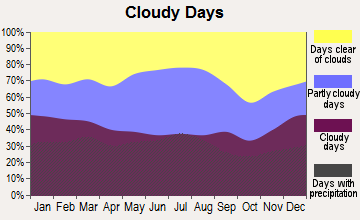
Clouds - Number of days clear of clouds
18.1%
18.3%
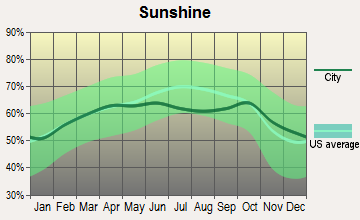
Sunshine amount - Average
69.8%
64.7%
Sunshine amount - Differences during a year
14%
10%
Sunshine amount - Maximum monthly
70%
64%
Sunshine amount - Minimum monthly
56%
54%
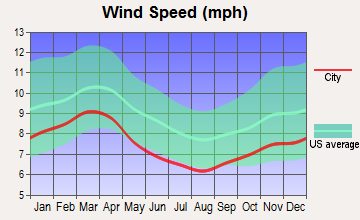
Wind speed - Average
6.9 mph
7.7 mph
Average climate in Charlotte, North Carolina
Average climate in Winston-Salem, North Carolina
Air pollution
Type
AQI
CO
NO2
OZONE
PB
PM10
PM25
SO2
Year
Charlotte
Winston-Salem
Charlotte
Charlotte
Winston-Salem
Charlotte
Winston-Salem
Charlotte
Charlotte
Winston-Salem
Charlotte
Winston-Salem
Charlotte
Winston-Salem
2018
75
73
0.24
N/A
6.3
6.7
27.8
32.2
N/A
N/A
15.5
13.9
8.2
8.7
0.2
0.1
2017
77
69
0.25
N/A
7.0
7.0
28.0
31.9
N/A
N/A
16.3
11.5
8.8
7.5
0.2
0.1
2016
82
79
0.25
N/A
7.6
6.6
28.7
32.3
N/A
N/A
N/A
12.0
8.4
7.5
0.2
0.2
2015
76
80
0.25
N/A
8.1
6.8
27.6
32.9
N/A
N/A
N/A
12.3
8.6
7.9
0.2
0.3
2014
76
79
0.26
N/A
8.5
6.3
26.3
33.2
N/A
N/A
N/A
12.9
9.3
8.8
0.3
0.4
2013
71
77
0.29
N/A
8.4
6.0
25.5
29.0
N/A
N/A
N/A
12.0
8.6
8.7
0.3
0.3
2012
95
84
0.28
N/A
8.7
8.9
27.3
31.6
N/A
N/A
N/A
13.5
9.7
8.5
0.3
0.4
2011
94
84
0.34
N/A
10.1
7.5
28.9
32.2
N/A
N/A
N/A
14.8
11.2
9.6
0.6
0.5
2010
97
98
0.33
N/A
11.8
9.5
28.0
35.2
N/A
N/A
N/A
16.0
11.6
11.6
1.0
0.3
2009
82
78
0.30
N/A
10.0
13.3
25.4
28.4
N/A
N/A
N/A
14.2
11.1
10.8
0.9
3.9
2008
102
97
0.32
N/A
11.2
11.1
27.6
33.7
N/A
N/A
N/A
16.7
13.0
12.4
2.1
6.3
2007
108
98
0.37
N/A
13.9
11.1
29.1
36.2
0.001
N/A
N/A
19.8
14.5
13.1
3.0
5.5
2006
107
97
0.44
N/A
13.9
10.3
27.3
32.1
0.000
N/A
N/A
19.4
14.8
15.1
3.3
5.1
2005
109
78
0.53
N/A
14.6
10.5
30.6
31.1
0.000
N/A
N/A
19.6
15.2
N/A
2.7
5.1
2004
89
72
0.53
N/A
14.6
12.9
28.9
28.6
0.001
N/A
N/A
19.8
N/A
N/A
2.8
4.3
2003
85
85
0.57
N/A
15.6
14.8
27.6
32.0
0.003
N/A
N/A
18.9
N/A
N/A
3.0
5.5
2002
103
92
0.63
N/A
15.3
14.3
32.6
35.4
0.003
N/A
N/A
19.7
N/A
N/A
2.7
5.0
2001
108
101
0.72
N/A
17.5
16.0
32.3
33.5
0.005
N/A
N/A
21.4
N/A
N/A
3.9
4.5
2000
107
89
0.79
N/A
18.0
17.1
32.6
32.6
0.014
N/A
N/A
21.2
N/A
N/A
4.4
4.4
Natural disasters
Type
Charlotte
Winston-Salem
Tornado activity compared to U.S. average
111.5%
74.6%
Earthquake activity compared to U.S. average
79%
74.8%
Natural disasters compared to U.S. average
9%
15%
Transportation
Charlotte's public transportation system is more robust than Winston-Salem's, offering light rail, bus service, and a bike-sharing program. Winston-Salem also offers public buses, but it lacks Charlotte's extensive light rail system. Both cities have good road networks for easy commuting.
Transport
Type
Charlotte
Winston-Salem
Amtrak stations
1
1
Amtrak stations nearby
2
2
FAA registered aircraft
439
5
FAA registered aircraft manufacturers and dealers
12
0
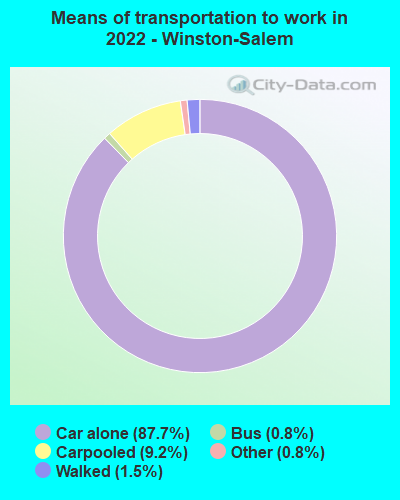
Means of transportation to work
Type
Charlotte
Winston-Salem
Bicycle
0.1%
0.1%
Bus
1.2%
1.1%
Carpooled
8.7%
8.3%
Car alone
86.2%
88%
Railroad
0.4%
0%
Taxicab
0.2%
0.3%
Walked
1.5%
1.4%
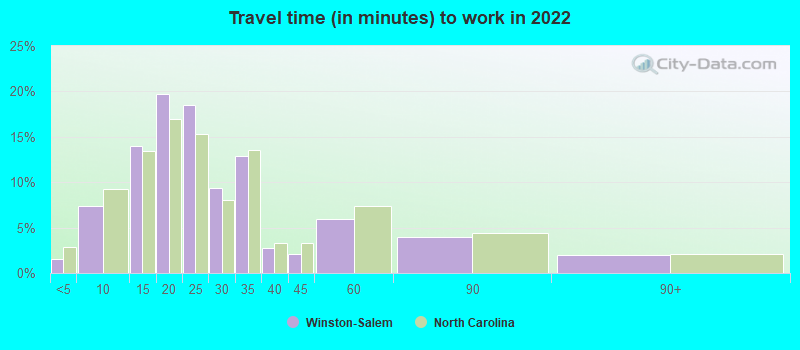
Average travel time to work
Type
Charlotte
Winston-Salem
Average
29.6 min
25.9 min
Other means
24.9 min
20.5 min
Public transportation
44.1 min
36.3 min
Private vehicle occupancy
Type
Charlotte
Winston-Salem
Average
1.2
1.1
Drove alone
90%
89.9%
In 2 person carpool
6.9%
6.9%
In 3 person carpool
1.8%
2.1%
In 4 person carpool
0.8%
1%
In 5-6 person carpool
0.5%
0%
How many people usually rode to work in the car, truck or van.
Real Estate
The real estate market in Charlotte is more expensive than in Winston-Salem due to its urban feel and amenities. However, both cities provide a good return on investment for property owners.
Neighborhoods
From lively urban neighborhoods like Uptown in Charlotte to the peaceful neighborhoods of Ardmore in Winston-Salem, both cities offer diverse living experiences. The selection would depend on personal preferences like walkability, access to amenities, and peace and tranquility.
Houses and residents
Type
Charlotte
Winston-Salem
Houses
393,631
114,871
Average household size (people)
2.5
2.4
Median year apartment built
1998
1981
Median year house/condo built
1993
1979
Length of stay in the house since moving in
11.8 years
13.4 years
Houses occupied
365,269 (92.8%)
101,551 (88.4%)
Houses occupied by owners
193,930 (53.1%)
56,834 (56%)
Houses occupied by renters
171,339 (46.9%)
44,717 (44%)
Median rent asked for vacant for-rent units
$1,482
$1,385
Median monthly housing costs
$1,302
$900
Median price asked for vacant for-sale houses and condos
$445,491
$293,191
Estimated median house or condo value
$321,400
$197,300
Median numbers of rooms
5.3
5.4
Median number of rooms in apartments
4
4.1
Median number of rooms in houses and condos
6.6
6.5
Median house price - detached houses
$388,029
$248,060
Median house price - in 2-unit structures
$184,325
$160,570
Median house price - in 3-to-4-unit structures
$178,624
$197,525
Median house price - in 5 or more unit structures
$433,957
$183,621
Median house price - mobile homes
$52,977
$59,840
Median house price - Townhouses or other attached units
$296,370
$172,289
Median house price - All housing units
$378,423
$238,779
Median house age
26
41
Renting percentage
42.6%
43.7%
Housing density (houses/condos per square mile)
1,624.8
1,055.3
House value disparities
33.3%
37.7%
Household income disparities
44.1%
47.4%
Median household income for houses/condes with a mortgage
$105,905
$79,673
Median household income for apartments without a mortgage
$70,681
$66,938
Housing units without a mortgage
3,089 (2.1%)
1,301 (3.5%)
Housing units with both a second mortgage and home equity loan
10,553 (7.2%)
3,722 (10%)
Housing units with a mortgage
142,912 (97.9%)
36,072 (96.5%)
Housing units with a home equity loan
171 (0.1%)
309 (0.8%)
Housing units with a second mortgage
13,532 (9.3%)
4,187 (11.2%)
House/condo owner moved in on average (years ago)
9
11
House/condo renter moved in on average (years ago)
1
1
Housing units lacking complete kitchen facilities
0.8%
1.8%
Housing units lacking complete plumbing facilities
0.2%
0.7%
Housing units in structures
Housing units in structures
Charlotte
Winston-Salem
One, detached
52.7%
62.7%
One, attached
9.1%
4.6%
Two
0.9%
1.4%
3 or 4
2.9%
5.8%
5 to 9
7.1%
7.8%
10 to 19
9.5%
7.1%
20 to 49
6.2%
3.5%
50 or more
10.3%
5.1%
Mobile homes
1.4%
2.1%
Median real estate property taxes paid for housing units
Self-employed workers in own not incorporated business
25,780
4,600
State government workers
16,519
3,265
Unpaid family workers
1,214
727
Industries and Occupations
Banking and finance dominate Charlotte's industry, along with the energy sector. Health services and education are important sectors in Winston-Salem. Both cities offer diverse job profiles, and potential residents can choose based on their skills and interests.
Charlotte boasts high-quality healthcare centers like the Carolinas Medical Center and Levine Children's Hospital. Still, Winston-Salem is no slouch either, featuring the top-rated Wake Forest Baptist Medical Center. Both cities offer top-notch healthcare services.
Health (county statistics)
Type
Charlotte
Winston-Salem
General health status score of residents in this county from 1 (poor) to 5 (excellent)
Charlotte has a well-developed infrastructure with a matured public transit system, various shopping centers, and multiple art and cultural attractions. Winston-Salem, due to its smaller size, doesn't have as extensive an infrastructure as Charlotte. However, it boasts commendable historical and cultural sites that make up for the size.
Infrastructure
Type
Charlotte
Winston-Salem
Hospitals
37
4
TV stations
16
10
Arenas or stadiums
3
1
Bank branches located here
202
22
Bank institutions located here
26
6
Main business address for public companies
33
4
Nuclear power plants nearby
2
0
Drinking water stations with no reported violations in the past
24
22
Drinking water stations with reported violations in the past
HMDA - Conventional home purchase loans - Applications denied
Year
Charlotte
Winston-Salem
1999
3,049
1,470
2000
1,568
940
2001
1,382
600
2002
1,275
769
2003
1,879
564
2004
2,415
564
2005
3,078
664
2006
3,864
738
2007
3,106
591
2008
1,287
270
2009
617
158
Culture and Food
Both Charlotte and Winston-Salem have a rich, southern culture and diverse culinary scene. Charlotte, being larger, offers more variety and fine dining establishments, while Winston-Salem is known for its historic charm and small-town culinary delights.
Sports Teams
Sports fans will love Charlotte, which is home to the NFL's Carolina Panthers and NBA's Charlotte Hornets. Winston-Salem doesn't have major league teams, but it does host minor league games and college sports.


 Charlotte, NC
 Winston-Salem, NC