Chicago, IL and Queens, NY are two of the most populous and vibrant cities in the United States. Both are rich in history, culture and offer various lifestyles. Experts often weigh the pros and cons of living either in Chicago, the Windy City with beautiful architecture and a strong work ethic or in Queens, the most diverse of New York's boroughs that bridges the gap between the hustle of Manhattan and the quieter residential New York. The comparison between the two touches on various aspects including crime/safety, weather, cost of living, education, work and economy, among others.
Both Chicago and Queens have areas that are safer than others, like most large cities. As per recent data, Chicago has had a significant rate of violent crime, but this is highly concentrated in certain neighborhoods. Many parts of Chicago, like the North Side and the Loop business district, are quite safe. Similarly, Queens has relatively low crime rates compared to other parts of New York City, but safety can vary widely between neighborhoods. Tourists are generally safe in both cities, provided they stay in populated areas and follow basic safety precautions.
Cost of Living
Living in Queens is generally more expensive than living in Chicago. High housing costs contribute significantly to the cost of living in Queens. Food, transportation, and goods and services also tend to be more expensive in Queens compared to Chicago. However, salaries in Queens also tend to be higher proportionate to the cost of living.
Income Tax
The state of Illinois, where Chicago is located, has a flat income tax rate of 4.95%. In contrast, New York State has a progressive income tax system, which means that the rate goes up with the income level.
Property Tax
Chicago has one of the highest property tax rates in the country. The average effective property tax rate in Chicago is significantly higher than in Queens. Queens, however, still has relatively high property taxes compared to the national average.
Sales Tax
Chicago has a higher sales tax than Queens. The combined city and state sales tax rate in Chicago is around 10.25%, one of the highest in the nation. Queens, however, has a combined city and state sales tax rate of 8.875%.
Income
Type
Chicago
Queens
Estimated median household income
$66,576
$73,262
Estimated per capita income
$43,217
$34,969
Cost of living index (U.S. average is 100)
104.8
173.2
If you make $50,000 in Chicago, you will have to make $82,634 in Queens to maintain the same standard of living.
Geographical Conditions
Chicago is located on the southwestern shore of Lake Michigan, offering beach activities despite its urban setting. In comparison, Queens, located on Long Island, has a more diverse landscape including beaches, parks, and urban areas.
Geographical information
Type
Chicago
Queens
Land area
227.1 sq. miles
109.2 sq. miles
Population density
11,872 people per sq. mile
20,847 people per sq. mile
Relative area comparison
Chicago, IL Queens, NY
Education
Both Chicago and Queens boast strong education systems. Chicago is home to some of the nation's top universities, including the University of Chicago and Northwestern. Similarly, Queens hosts some excellent universities such as St. John's University and Queens College. Primary and secondary education in both cities is generally robust, with many high-performing public and private schools.
Chicago is a diverse economy with strong sectors in manufacturing, IT, and financial services. The city is a major business hub, hosting numerous Fortune 500 companies. Queens, being part of New York City, profits from the booming economy of the metropolis. Key sectors include finance, retail, health care, and education.
Biggest Employers
The biggest employers in Chicago include the U.S. Government, Chicago Public Schools, the City of Chicago, Advocate Health Care, Northwestern Medicine. In Queens, the largest employers are the City of New York, Northwell Health, JetBlue Airways, Mount Sinai Services, and Resorts World Casino.
In Chicago (Cook County), 74.0% voted for Democrats and 24.6% for Republicans in 2012 Presidential Election. In Queens (Queens County), 79.2% voted for Democrats and 20.0% for Republicans.
Elections
Type
Democrats
Republicans
Other
Year
Chicago
Queens
Chicago
Queens
Chicago
Queens
2020
74.6%
72.3%
24.1%
27.0%
1.3%
0.7%
2016
74.4%
75.4%
20.9%
21.8%
4.7%
2.8%
2012
74.0%
79.2%
24.6%
20.0%
1.4%
0.8%
2008
76.4%
75.4%
22.9%
24.3%
0.7%
0.3%
2004
70.3%
71.8%
29.2%
27.5%
0.6%
0.8%
2000
69.0%
75.2%
28.8%
22.0%
2.3%
2.8%
1996
66.8%
72.9%
26.7%
21.1%
6.5%
6.0%
Breakdown of population affiliated with a religious congregation
Type
Adherents
Congregations
Religion
Chicago
Queens
Chicago
Queens
CATHOLIC CHURCH
37.5%
30.4%
11.1%
7.7%
MUSLIM ESTIMATE
3.9%
3.7%
1.8%
4.4%
EVANGELICAL LUTHERAN CHURCH IN AMERICA
1.0%
0.3%
4.3%
2.6%
SOUTHERN BAPTIST CONVENTION
1.0%
0.2%
5.4%
3.8%
LUTHERAN CHURCH
0.9%
0.1%
3.6%
1.8%
AMERICAN BAPTIST CHURCHES IN THE USA
0.4%
0.5%
1.6%
2.5%
EPISCOPAL CHURCH
0.4%
0.4%
1.8%
2.1%
SEVENTH DAY ADVENTIST CHURCH
0.4%
0.6%
1.9%
3.4%
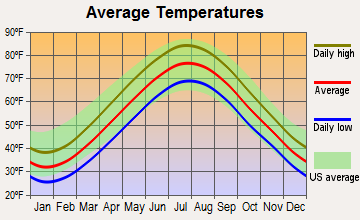
Weather
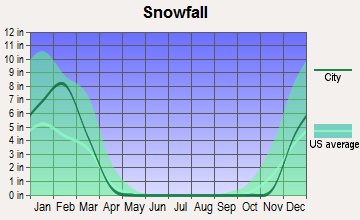
Chicago is known for its bitterly cold winters and hot, humid summers. Winters in Chicago can be brutal with temperatures often dropping below freezing, accompanied by snow and strong winds. On the other hand, Queens has a more moderate and wet climate, with milder winters and cooler summers. It is also less windy compared to Chicago.
Weather and climate
Type
Chicago
Queens
Temperature - Average
50.3°F
54.6°F
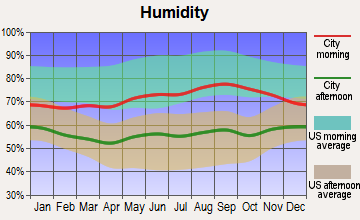
Humidity - Average morning or afternoon humidity
75.6%
68.5%
Humidity - Differences between morning and afternoon humidity
31%
25.1%
Humidity - Maximum monthly morning or afternoon humidity
85%
76.3%
Humidity - Minimum monthly morning or afternoon humidity
54%
51.1%
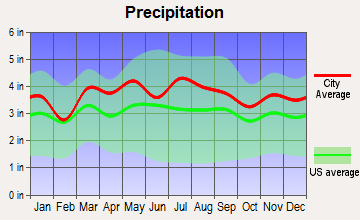
Precipitation - Yearly average
37.8 in
44.5 in
Snowfall - Yearly average
77.6 in
52.7 in
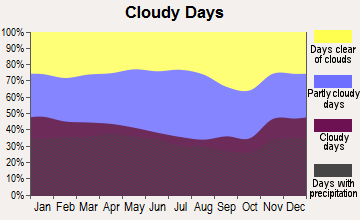
Clouds - Number of days clear of clouds
14%
16.3%
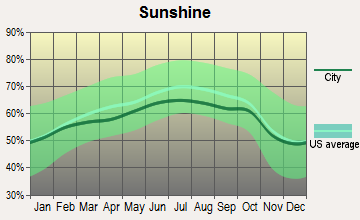
Sunshine amount - Average
56.8%
60.2%
Sunshine amount - Differences during a year
33%
20%
Sunshine amount - Maximum monthly
68%
64%
Sunshine amount - Minimum monthly
35%
44%
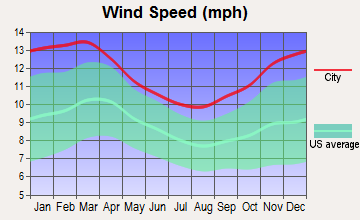
Wind speed - Average
10.7 mph
11.6 mph
Average climate in Chicago, Illinois
Average climate in Queens, New York
Air pollution
Type
AQI
CO
NO2
OZONE
PB
PM10
PM25
SO2
Year
Chicago
Queens
Chicago
Queens
Chicago
Queens
Chicago
Queens
Chicago
Queens
Chicago
Queens
Chicago
Queens
Chicago
Queens
2018
97
97
0.26
0.26
14.3
14.7
26.2
25.4
N/A
N/A
23.6
N/A
9.3
6.4
1.7
0.4
2017
95
98
0.25
0.23
14.3
15.4
26.4
25.8
N/A
N/A
25.1
N/A
8.7
6.4
1.4
0.5
2016
95
97
0.21
0.24
14.9
16.0
26.5
25.5
N/A
N/A
17.3
N/A
9.1
6.7
0.8
0.6
2015
92
104
0.51
0.26
15.0
17.4
25.4
24.1
N/A
N/A
23.3
N/A
10.5
7.9
0.9
0.8
2014
101
99
0.45
0.25
18.0
17.0
25.1
24.3
N/A
N/A
28.9
N/A
10.7
7.8
1.3
1.1
2013
100
101
0.37
0.23
18.3
17.7
23.8
25.8
N/A
N/A
30.3
N/A
11.1
8.7
1.0
1.2
2012
112
105
0.36
0.26
18.8
17.6
25.7
25.8
N/A
N/A
31.3
N/A
12.1
9.1
1.7
1.8
2011
101
112
0.38
0.27
18.6
20.4
24.8
24.2
N/A
N/A
21.9
N/A
12.8
10.6
2.4
2.7
2010
103
112
0.37
0.35
20.4
19.4
25.4
23.6
N/A
N/A
22.2
N/A
12.9
10.3
1.4
2.9
2009
106
107
0.29
0.24
20.0
21.0
22.4
21.0
0.025
N/A
20.1
N/A
12.9
9.7
1.4
3.4
2008
108
113
0.32
0.44
22.8
22.6
22.8
22.0
0.026
0.013
22.7
N/A
12.5
11.0
1.8
4.1
2007
125
121
0.34
0.46
23.6
22.9
23.9
20.2
0.027
0.016
25.9
N/A
13.1
11.6
2.2
4.9
2006
95
120
0.31
0.46
23.0
23.5
21.1
20.3
0.029
0.018
22.0
N/A
N/A
12.7
2.6
5.3
2005
110
110
0.55
0.54
23.5
25.5
23.3
19.7
0.027
N/A
26.2
N/A
N/A
N/A
3.3
6.7
2004
85
107
0.83
0.55
23.9
25.1
20.3
18.2
0.032
0.030
23.4
N/A
N/A
N/A
4.1
5.8
2003
99
110
0.69
0.63
25.1
26.9
20.0
18.9
0.030
0.022
23.3
26.9
N/A
N/A
3.1
7.0
2002
114
124
0.83
0.58
26.5
27.9
20.8
19.2
0.029
0.008
24.4
25.7
N/A
N/A
3.3
6.5
2001
107
124
0.83
0.60
27.3
28.8
19.2
19.3
0.031
0.020
28.5
24.5
N/A
N/A
4.3
7.8
2000
104
115
0.88
0.67
24.8
28.4
17.6
17.6
0.046
0.022
N/A
22.2
N/A
N/A
4.2
7.3
Natural disasters
Type
Chicago
Queens
Tornado activity compared to U.S. average
145.8%
54%
Earthquake activity compared to U.S. average
136.9%
30.6%
Natural disasters compared to U.S. average
20%
19%
Transportation
Chicago boasts a comprehensive public transportation system, including the famous 'L' train network and extensive bus routes. Queens, being part of NYC, is served by an extensive subway system. Commuting times can be longer in Queens due to traffic and the distance to Manhattan for many workers.
Transport
Type
Chicago
Queens
Amtrak stations
1
2
Amtrak stations nearby
3
3
FAA registered aircraft
1
4
FAA registered aircraft manufacturers and dealers
12
0
Means of transportation to work
Type
Chicago
Queens
Bicycle
1.6%
0.3%
Bus
8%
10%
Carpooled
8.3%
10.2%
Car alone
62.3%
34.3%
Railroad
0.2%
2.2%
Streetcar
6.8%
0.2%
Subway
3.5%
34.3%
Taxicab
0.8%
0.7%
Walked
5.9%
5.7%
Average travel time to work
Type
Chicago
Queens
Average
36.9 min
44 min
Real Estate
Real estate in Queens tends to be more expensive compared to Chicago. The median home cost in Chicago is significantly lower than in Queens. The real estate market in both cities does offer a wide variety of housing options, from apartments to single-family homes, suiting different lifestyles and budgets.
Neighborhoods
Chicago is known for its distinct neighborhoods, each with its own unique character. These range from the upscale North Side to the vibrant South Side. Queens is known for its cultural diversity, with neighborhoods such as Flushing with a large Asian population, and Astoria, known for the bustling Greek community.
Houses and residents
Type
Chicago
Queens
Houses
1,272,191
817,250
Average household size (people)
2.5
2.8
Houses occupied
1,139,537 (89.6%)
782,664 (95.8%)
Houses occupied by owners
530,977 (46.6%)
334,894 (42.8%)
Houses occupied by renters
608,560 (53.4%)
447,770 (57.2%)
Median rent asked for vacant for-rent units
$1,546
$1,666
Median price asked for vacant for-sale houses and condos
$355,671
$615,765
Estimated median house or condo value
$297,300
$642,000
Median number of rooms in apartments
4
3.7
Median number of rooms in houses and condos
5.8
5.4
Renting percentage
55.1%
57%
Housing density (houses/condos per square mile)
5,601.1
7,481.6
Household income disparities
48.4%
44.9%
Housing units without a mortgage
6,624 (1.9%)
64,617 (34.6%)
Housing units with both a second mortgage and home equity loan
17,661 (5.1%)
311 (0.2%)
Housing units with a mortgage
339,523 (98.1%)
122,366 (65.4%)
Housing units with a home equity loan
808 (0.2%)
9,927 (5.3%)
Housing units with a second mortgage
25,416 (7.3%)
10,707 (5.7%)
Housing units lacking complete kitchen facilities
2.5%
1%
Housing units lacking complete plumbing facilities
Self-employed workers in own not incorporated business
67,964
48,383
State government workers
41,316
21,536
Unpaid family workers
4,164
2,382
Industries and Occupations
Chicago is known for its finance, insurance, and manufacturing sectors, while Queens boasts strong healthcare, retail, education, and social services sectors. As Queens is part of the largest city in the U.S., it benefits from varied work opportunities throughout the five boroughs.
Both cities host top-rated hospitals and medical centers. Chicago is home to the highly-ranked Northwestern Memorial Hospital and the University of Chicago Medical Center. In Queens, NewYork-Presbyterian Queens and Long Island Jewish Medical Center provide outstanding health care services.
Health (county statistics)
Type
Chicago
Queens
General health status score of residents in this county from 1 (poor) to 5 (excellent)
Both cities are well-equipped with modern infrastructure. Chicago's skyline is famously marked by towering skyscrapers. Queens offers a mix of urban and suburban-style infrastructure, with several high-rise buildings and single-family homes. Both cities have well-maintained public parks, hospitals, libraries, and other necessary facilities.
Infrastructure
Type
Chicago
Queens
Hospitals
86
1
TV stations
22
30
Schools
School facilities
Type
Chicago
Queens
Private elementary/middle schools
183
8
Private high schools
69
1
Public elementary/middle schools
450
6
Public high schools
145
2
Colleges/Universities
90
1
Culture and Food
Chicago is known for its rich cultural scene, including jazz and blues music, world-class museums, and diverse culinary offerings like deep-dish pizza and hot dogs. Queens, often described as one of the most ethnically diverse counties in the U.S., offers a plethora of global cuisines from Greek to Chinese and Indian.
Sports Teams
Chicago has several major sports teams including the Cubs and White Sox (MLB), Bears (NFL), Bulls (NBA), and Blackhawks (NHL). Queens is home to the Mets (MLB) and is close to other NY teams.


 Chicago, IL
 Queens, NY