The two cities may seem like night and day for the potential resident or tourist. Columbus, the bustling capital of Ohio, provides a vibrant Midwest living experience while Aurora, set against the backdrop of the Rocky Mountains in Colorado, offers a quieter suburban feel. Both cities have their unique attributes, ranging from safety and crime levels to entertainment and sports, economy, healthcare, and tax considerations.
Distance between
Columbus, OH and
Aurora, CO : 1,154.6 miles
Columbus's population is larger by 133%. Its population has grown by 195,058 people (27.4%) since 2000. The population of Aurora has grown by 112,954 people (40.9%) during that time.
Columbus has a somewhat higher crime rate compared to national averages, but this often varies by neighborhood. Investments in public safety are ongoing, with a focus on community policing and neighborhood safety strategies. Aurora, meanwhile, ranks lower in crime than the national average, with a very robust public safety network including innovative use of technology to combat crime. In both cities, safety can depend significantly on the specific neighborhood.
City-data.com crime index counts serious crimes and violent crime more heavily. It adjusts for the number of visitors and daily workers commuting into cities. (higher means more crime, U.S. average = 301.1)
City-data.com crime index counts serious crimes and violent crime more heavily. It adjusts for the number of visitors and daily workers commuting into cities. (higher means more crime, U.S. average = 301.1)
Sex Offenders
According to our data, there are 1,506 registered sex offenders living in Columbus and 1,048 registered sex offenders living in . The ratio of residents to sex offenders in Columbus is 573 to 1; the ratio in Aurora is 346 to 1. The number of registered sex offenders compared to the number of residents is a smaller in Columbus than in Aurora.
Cost of Living
The cost of living in Columbus, Ohio is lower than the national average, making it an attractive choice for families and young professionals. Housing costs are a particular highlight, with a market accessible to various income levels. Conversely, Aurora has a higher cost of living driven by housing and transportation costs. However, salaries and wages often reflect the higher cost of living in Aurora.
Income Tax
Ohio has a progressive income tax structure, including Columbus, with rates ranging from 2.85% to 4.797%. Colorado has a flat income tax rate of 4.63%, applying equally across cities including Aurora.
Property Tax
Columbus has a higher than average property tax rate in Ohio, but these funds primarily go to the well-regarded school systems. Aurora's property taxes are moderately low, which can offset some of the cost of the city's higher home prices.
Sales Tax
Sales tax in Columbus is 7.5%, and combined with Ohio's relatively low cost of living, makes affordability a strong selling point. Aurora, within Colorado, places a higher sales tax at 8.5%, slightly increasing the overall cost of living.
Income
Type
Columbus
Aurora
Estimated median household income
$58,202
$71,647
Estimated per capita income
$32,392
$35,054
Cost of living index (U.S. average is 100)
96.1
109.4
If you make $50,000 in Columbus, you will have to make $56,920 in Aurora to maintain the same standard of living.
Geographical Conditions
Columbus is relatively flat, perfect for biking or walking, and has several rivers adding aesthetics and recreational opportunities. Aurora lies in the shadow of the Rocky Mountains, with a terrain that offers breathtaking scenery and outdoor activities such as hiking, camping, and skiing.
Columbus is home to The Ohio State University and several other well-respected institutions, making it a hub for higher education. Its public school system is diverse, with many charters and specialized schools. Aurora also has a commendable education system, with the Cherry Creek School District recognized as one of the best in the state. There are several community colleges and technical schools in the area as well.
Columbus has a diverse economy with sectors spanning education, government, insurance, banking, fashion, food, logistics, healthcare, and technology. Aurora's economy is robust and diverse, heavily influenced by its proximity to Denver. Key sectors include healthcare, retail trade, and technology, with steady job growth forecasted.
Biggest Employers
Columbus' largest employers include Ohio State University, the state of Ohio, and Nationwide Insurance. Aurora's biggest employers are the Children's Hospital Colorado, Raytheon Company, and the City of Aurora. Both cities are also home to an array of smaller tech and creative firms, offering diverse employment opportunities.
In Columbus (Franklin County), 60.8% voted for Democrats and 37.9% for Republicans in 2012 Presidential Election. In Aurora (Adams County), 57.3% voted for Democrats and 40.4% for Republicans.
Elections
Type
Democrats
Republicans
Other
Year
Columbus
Aurora
Columbus
Aurora
Columbus
Aurora
2020
64.7%
57.1%
33.4%
40.7%
1.9%
2.2%
2016
59.8%
50.1%
33.9%
41.6%
6.2%
8.3%
2012
60.8%
57.3%
37.9%
40.4%
1.3%
2.3%
2008
59.8%
58.5%
39.0%
40.1%
1.2%
1.4%
2004
54.5%
50.7%
45.2%
48.4%
0.3%
0.9%
2000
48.9%
50.3%
47.9%
44.2%
3.2%
5.5%
1996
48.1%
51.3%
44.5%
38.9%
7.3%
9.8%
Breakdown of population affiliated with a religious congregation
Type
Adherents
Congregations
Religion
Columbus
Aurora
Columbus
Aurora
CATHOLIC CHURCH
13.2%
16.0%
5.6%
4.5%
EVANGELICAL LUTHERAN CHURCH IN AMERICA
1.6%
0.4%
3.7%
2.5%
SOUTHERN BAPTIST CONVENTION
1.6%
0.7%
6.8%
7.8%
MUSLIM ESTIMATE
1.3%
0.1%
1.9%
0.8%
VINEYARD USA
1.3%
0.0%
1.2%
0.4%
AMERICAN BAPTIST CHURCHES IN THE USA
1.0%
0.0%
3.3%
0.4%
EPISCOPAL CHURCH
0.4%
0.1%
1.3%
1.2%
SEVENTH DAY ADVENTIST CHURCH
0.4%
0.4%
2.0%
3.3%
LUTHERAN CHURCH
0.2%
0.7%
1.0%
3.3%
Weather
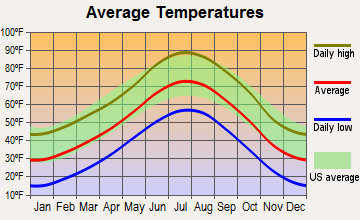
Expect warm, humid summers and chilly winters in Columbus, with the city experiencing all four seasons. Heatwaves and blizzards can occur, but generally, the weather is temperate. Aurora enjoys a semi-arid, continental climate with four distinct seasons. Winters can be cold and snowy, while summers are hot and dry. The city boasts over 300 days of sunshine a year, appealing to those who enjoy outdoor activities.
Weather and climate
Type
Columbus
Aurora
Temperature - Average
52.8°F
49.9°F
Humidity - Average morning or afternoon humidity
74.8%
50.6%
Humidity - Differences between morning and afternoon humidity
34%
20%
Humidity - Maximum monthly morning or afternoon humidity
86%
55%
Humidity - Minimum monthly morning or afternoon humidity
52%
35%
Precipitation - Yearly average
39.3 in
16.9 in
Snowfall - Yearly average
56.6 in
114 in
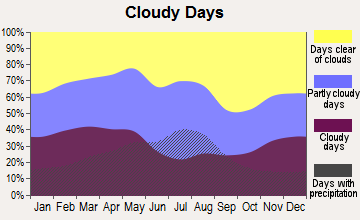
Clouds - Number of days clear of clouds
12%
19.2%
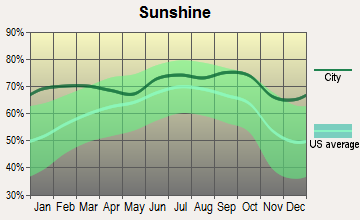
Sunshine amount - Average
49.7%
75.6%
Sunshine amount - Differences during a year
27%
10%
Sunshine amount - Maximum monthly
55%
74%
Sunshine amount - Minimum monthly
28%
64%
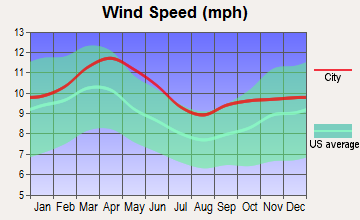
Wind speed - Average
8.2 mph
8.6 mph
Average climate in Columbus, Ohio
Average climate in Aurora, Colorado
Air pollution
Type
AQI
CO
NO2
OZONE
PB
PM10
PM25
SO2
Year
Columbus
Aurora
Columbus
Aurora
Columbus
Aurora
Columbus
Aurora
Aurora
Columbus
Aurora
Columbus
Aurora
Columbus
Aurora
2018
69
99
0.11
0.37
10.0
21.5
33.8
31.3
N/A
N/A
N/A
29.2
6.0
8.5
0.0
0.7
2017
68
95
0.16
0.37
9.6
21.9
28.7
31.1
N/A
N/A
N/A
22.0
5.5
8.5
0.1
0.9
2016
76
90
0.17
0.42
10.6
24.0
28.5
30.7
N/A
N/A
N/A
22.6
5.6
8.1
0.1
1.0
2015
74
101
0.16
0.44
11.3
22.8
27.0
29.5
N/A
N/A
N/A
20.6
6.1
9.5
0.1
1.1
2014
82
94
0.20
0.42
11.0
21.8
28.5
29.6
N/A
N/A
N/A
22.5
7.4
10.1
0.5
1.3
2013
78
84
N/A
0.39
8.9
19.6
29.6
29.9
N/A
N/A
N/A
21.9
7.8
N/A
0.6
1.4
2012
87
90
N/A
0.35
N/A
18.9
32.9
30.8
N/A
N/A
N/A
24.2
8.9
N/A
N/A
1.2
2011
89
91
N/A
0.34
N/A
18.1
28.1
30.9
N/A
N/A
N/A
23.8
8.9
N/A
N/A
1.5
2010
90
81
N/A
0.41
N/A
16.3
30.5
28.8
N/A
N/A
N/A
26.6
9.1
N/A
N/A
1.0
2009
61
79
N/A
0.37
N/A
14.1
28.7
27.1
0.005
N/A
N/A
22.6
N/A
N/A
N/A
1.3
2008
65
85
N/A
0.41
N/A
17.3
31.2
28.8
0.008
N/A
N/A
25.5
N/A
N/A
1.8
1.6
2007
80
96
N/A
0.42
N/A
20.6
30.8
25.4
0.007
N/A
N/A
28.8
N/A
N/A
2.8
1.2
2006
75
89
N/A
0.50
N/A
19.0
30.0
25.0
0.027
N/A
23.7
28.0
N/A
N/A
3.3
1.4
2005
87
86
N/A
0.57
N/A
21.3
29.6
22.5
0.109
N/A
27.5
29.6
N/A
N/A
4.1
1.5
2004
77
82
N/A
0.61
N/A
21.2
27.8
21.4
0.037
N/A
24.6
28.6
N/A
N/A
4.4
1.8
2003
91
106
N/A
0.62
N/A
21.2
26.4
23.1
0.040
N/A
23.9
32.6
N/A
N/A
4.1
1.9
2002
93
86
N/A
0.64
N/A
19.2
31.3
22.8
0.028
N/A
25.7
35.7
N/A
N/A
4.1
2.5
2001
84
95
N/A
0.79
N/A
24.0
29.2
20.4
0.030
N/A
25.9
32.6
N/A
N/A
3.5
2.6
2000
57
93
N/A
0.77
N/A
13.8
N/A
21.4
0.033
N/A
23.5
12.2
N/A
N/A
3.7
2.1
Natural disasters
Type
Columbus
Aurora
Tornado activity compared to U.S. average
119.1%
138.7%
Earthquake activity compared to U.S. average
96.1%
796.4%
Natural disasters compared to U.S. average
16%
11%
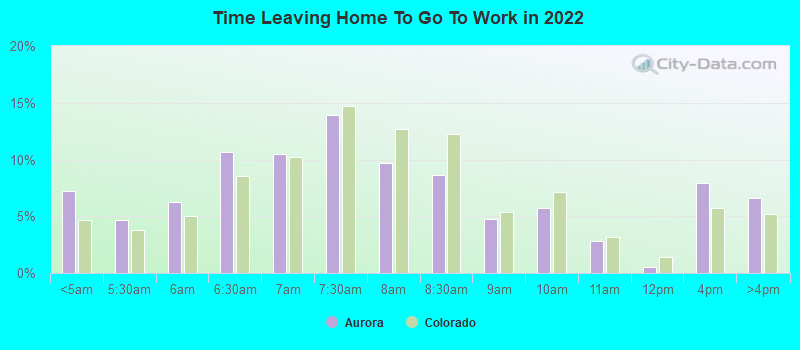
Transportation
Columbus provides various public transit options via COTA, including buses and paratransit services. Commuting times are lower than the national average. On the other hand, Aurora, part of the Denver metro area, benefits from the RTD's vast network of buses, light rail, and commuter trains. Commuting times may be slightly longer but are offset by the scenic routes.
Transport
Type
Columbus
Aurora
Amtrak stations
1
0
Amtrak stations nearby
1
2
FAA registered aircraft
415
138
FAA registered aircraft manufacturers and dealers
4
19
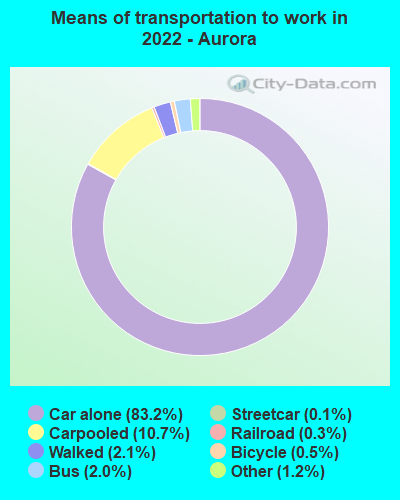
Means of transportation to work
Type
Columbus
Aurora
Bicycle
0.6%
0.6%
Bus
1.6%
1.7%
Carpooled
7.4%
9.3%
Car alone
86.7%
84.4%
Subway
0%
0.1%
Taxicab
0.1%
0%
Walked
2.2%
2.5%
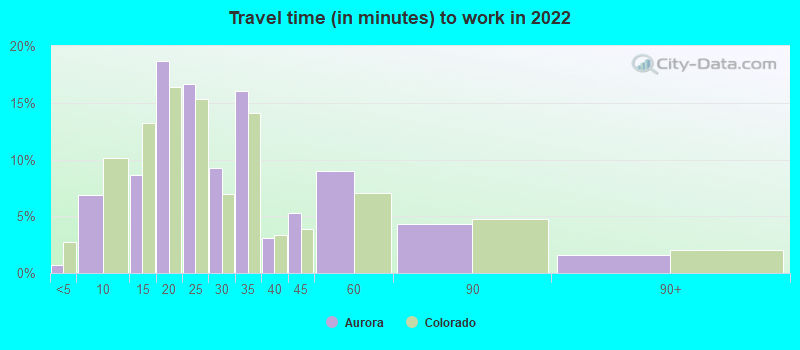
Average travel time to work
Type
Columbus
Aurora
Average
26.1 min
28.3 min
Other means
21.7 min
26.9 min
Public transportation
35.4 min
50.5 min
Private vehicle occupancy
Type
Columbus
Aurora
Average
1.1
1.2
Drove alone
90.7%
85.1%
In 2 person carpool
7.3%
10%
In 3 person carpool
1.4%
2.8%
In 4 person carpool
0.5%
1.5%
In 5-6 person carpool
0.1%
0.3%
In 7+ person carpool
0.1%
0.2%
How many people usually rode to work in the car, truck or van.
Real Estate
Columbus provides a range of affordable real estate options, from downtown apartments to suburban homes. The market is vibrant, with the median home cost below the national average. In Aurora, the real estate market is more competitive and pricier, with a wide range of suburban homes, apartments, and luxury real estates.
Neighborhoods
Columbus is a city of neighborhoods, each with its unique vibe and attractions. The Short North is known for its lively arts scene, while German Village retains its historical charm. In Aurora, neighborhoods like Cherry Creek and Mission Viejo are popular, boasting high livability scores for their accessibility, safety, and local amenities.
Houses and residents
Type
Columbus
Aurora
Houses
422,120
149,636
Average household size (people)
2.3
2.7
Median year apartment built
1982
1986
Median year house/condo built
1977
1984
Length of stay in the house since moving in
12.6 years
10.4 years
Houses occupied
390,605 (92.5%)
140,003 (93.6%)
Houses occupied by owners
175,427 (44.9%)
89,615 (64%)
Houses occupied by renters
215,178 (55.1%)
50,388 (36%)
Median rent asked for vacant for-rent units
$1,371
$2,036
Median monthly housing costs
$1,110
$1,526
Median price asked for vacant for-sale houses and condos
$195,022
$725,445
Estimated median house or condo value
$219,200
$411,400
Median numbers of rooms
5
5.5
Median number of rooms in apartments
4.2
3.9
Median number of rooms in houses and condos
6.3
6.5
Median house price - detached houses
$233,452
$500,029
Median house price - in 2-unit structures
$121,729
$384,060
Median house price - in 3-to-4-unit structures
$215,337
$254,381
Median house price - in 5 or more unit structures
$240,711
$231,026
Median house price - mobile homes
$121,578
$130,226
Median house price - occupied boats, rvs, vans etc.
$27,006
$160,380
Median house price - Townhouses or other attached units
$218,726
$471,483
Median house price - All housing units
$229,736
$476,379
Median house age
42
36
Renting percentage
53%
40.1%
Housing density (houses/condos per square mile)
2,007.5
1,050.1
House value disparities
30.2%
23.6%
Household income disparities
42.4%
41.5%
Median household income for houses/condes with a mortgage
$89,058
$99,433
Median household income for apartments without a mortgage
$59,295
$63,316
Housing units without a mortgage
4,290 (3.3%)
424 (0.6%)
Housing units with both a second mortgage and home equity loan
10,651 (8.2%)
5,246 (7.8%)
Housing units with a mortgage
125,487 (96.7%)
66,791 (99.4%)
Housing units with a home equity loan
775 (0.6%)
176 (0.3%)
Housing units with a second mortgage
13,558 (10.4%)
6,860 (10.2%)
House/condo owner moved in on average (years ago)
10
7
House/condo renter moved in on average (years ago)
1
1
Housing units lacking complete kitchen facilities
1.6%
1%
Housing units lacking complete plumbing facilities
1.3%
0.6%
Housing units in structures
Housing units in structures
Columbus
Aurora
One, detached
45.8%
52.6%
One, attached
9.1%
11.9%
Two
4.0%
0.2%
3 or 4
8.6%
4.2%
5 to 9
11.8%
7.1%
10 to 19
8.6%
11.0%
20 to 49
4.5%
5.5%
50 or more
6.8%
5.7%
Mobile homes
0.8%
1.7%
Boats, RVs, vans, etc.
0.1%
0.0%
Median real estate property taxes paid for housing units
Self-employed workers in own not incorporated business
20,915
13,677
State government workers
31,881
5,134
Unpaid family workers
724
0
Industries and Occupations
Major industries in Columbus include education, government, and healthcare. The city is also a burgeoning tech hub, attracting startups and established companies alike. Aurora's primary industries are aerospace and defense, bioscience, and healthcare. Both cities show sustained growth in job sectors and offer diverse opportunities for job-seekers.
Columbus residents benefit from excellent healthcare facilities, including the Ohio State University Wexner Medical Center and Nationwide Children's Hospital. Aurora also provides outstanding healthcare, including the top-rated University of Colorado Anschutz Medical Campus and the Children's Hospital Colorado.
Health (county statistics)
Type
Columbus
Aurora
General health status score of residents in this county from 1 (poor) to 5 (excellent)
Columbus boasts exceptional infrastructure, including a comprehensive road network, utilities, and public facilities. The city is also investing in smart technologies to improve city-life quality. Aurora, meanwhile, enjoys the use of the infrastructure of the larger Denver metropolitan area. Access to the Denver International Airport and a solid road network make it a convenient city for commuting or traveling.
Infrastructure
Type
Columbus
Aurora
Hospitals
47
4
TV stations
14
15
Bank branches located here
200
77
Bank institutions located here
25
19
Main business address for public companies
23
1
Drinking water stations with no reported violations in the past
17
1
Drinking water stations with reported violations in the past
HMDA - Conventional home purchase loans - Applications denied
Year
Columbus
Aurora
1999
2,450
1,737
2000
2,376
1,460
2001
1,897
1,056
2002
1,483
635
2003
2,087
1,276
2004
3,216
2,052
2005
4,275
3,087
2006
4,662
2,880
2007
2,679
1,693
2008
1,015
782
2009
555
302
Culture and Food
Columbus is a cultural hub with a thriving food scene, plenty of shopping, music festivals, and art galleries. Its diversity is well represented throughout city markets, restaurants, and events. Aurora is known for its outdoor recreational activities, but also has a growing arts scene and an array of dining options. Each city provides a rich cultural experience, shaped largely by the communities that call them home.
Sports Teams
Columbus is a sports city and is home to Ohio State Buckeyes, Columbus Crew, and the Blue Jackets. Aurora, although a suburb, takes advantage of its proximity to Denver's professional sports teams, including the Broncos, Nuggets, and Rockies. Sports enthusiasts will feel at home in both cities.


 Columbus, OH
 Aurora, CO