Comparing Columbus, Ohio and Greensboro, North Carolina as prospective places to live or visit unveils striking differences and similarities. Both cities have their unique charm, diverse culture, and varied opportunities, but provide contrasting experiences when it comes to aspects like cost of living, weather, education, economy, and community life. This comprehensive comparison will guide decision-making for potential residents and visitors alike, focusing on significant aspects ranging from crime rate and infrastructure to health care and sports teams.
Distance between
Columbus, OH and
Greensboro, NC : 320.5 miles
Columbus's population is larger by 204%. Its population has grown by 195,058 people (27.4%) since 2000. The population of Greensboro has grown by 74,372 people (33.2%) during that time.
In both Columbus and Greensboro, safety is a primary concern. According to recent reports, the crime rate in Greensboro is moderately higher than the national average, but still relatively manageable. Columbus, meanwhile, presents a higher crime rate compared to the national and state averages. Both cities have made significant efforts to address crime and safety with increased police presence and community programs for prevention.
City-data.com crime index counts serious crimes and violent crime more heavily. It adjusts for the number of visitors and daily workers commuting into cities. (higher means more crime, U.S. average = 301.1)
City-data.com crime index counts serious crimes and violent crime more heavily. It adjusts for the number of visitors and daily workers commuting into cities. (higher means more crime, U.S. average = 301.1)
Sex Offenders
According to our data, there are 1,506 registered sex offenders living in Columbus and 615 registered sex offenders living in . The ratio of residents to sex offenders in Columbus is 573 to 1; the ratio in Greensboro is 467 to 1. The number of registered sex offenders compared to the number of residents in Columbus is near to than in Greensboro.
Cost of Living
When it comes to cost of living, Greensboro is generally more affordable than Columbus. Groceries, housing, utilities, and transportation tend to be lower in cost in Greensboro, which makes it more attractive to families and individuals on a budget. However, both cities are less expensive than the national average making them viable choices for prospective residents.
Income Tax
Income tax is another major factor to consider. Columbus residents face a city income tax rate, enforced by the State of Ohio, which is much higher than Greensboro's, which only enforce the state income tax of North Carolina.
Property Tax
Property taxes also significantly vary. In Columbus, property tax rates are generally higher than in Greensboro, with Columbus homeowners paying almost twice Greensboro's property tax rates.
Sales Tax
Ohio's state sales tax is higher than that of North Carolina. However, the sales tax in the City of Columbus is equal to the state average. In Greensboro, the sales tax matches the state average of North Carolina.
Income
Type
Columbus
Greensboro
Estimated median household income
$58,202
$51,825
Estimated per capita income
$32,392
$32,208
Cost of living index (U.S. average is 100)
96.1
91.2
If you make $50,000 in Greensboro, you will have to make $52,686 in Columbus to maintain the same standard of living.
Geographical Conditions
The geographical features of Columbus include flat plains and a few small river valleys, ideal for various outdoor activities. Greensboro, located in the rolling Piedmont region, offers a pleasant mix of city and country with beautiful parks and green spaces.
Quality of education is equally crucial, either for families with school-age children or for those desiring to further their education. Columbus public schools belong to diverse systems known for their excellence. With Ohio State University nearby, Columbus offers higher educational opportunities. Greensboro, on the other hand, boasts reputable public and private schools and houses several well-regarded colleges, including the University of North Carolina at Greensboro.
Columbus's economy is robust, with a traditionally strong focus on industries like education, health care, and government, including Ohio State University and the Ohio government. In contrast, Greensboro has experienced significant growth in sectors like health care and education but is traditionally known for textiles, tobacco, and furniture industries.
Biggest Employers
The biggest employers in Columbus are state and federal government entities, Ohio State University, and various healthcare providers. The largest employers in Greensboro include Cone Health, Guilford County Schools, and the City of Greensboro.
There were 913 building permits issued in Columbus in 2012 (246 more than in 2011) compared to 529 building permits issued in Greensboro in 2012 (235 more than in 2011).
In Columbus (Franklin County), 60.8% voted for Democrats and 37.9% for Republicans in 2012 Presidential Election. In Greensboro (Guilford County), 57.8% voted for Democrats and 41.4% for Republicans.
Elections
Type
Democrats
Republicans
Other
Year
Columbus
Greensboro
Columbus
Greensboro
Columbus
Greensboro
2020
64.7%
61.1%
33.4%
37.9%
1.9%
1.1%
2016
59.8%
58.0%
33.9%
38.1%
6.2%
3.9%
2012
60.8%
57.8%
37.9%
41.4%
1.3%
0.8%
2008
59.8%
58.9%
39.0%
40.5%
1.2%
0.5%
2004
54.5%
50.2%
45.2%
49.3%
0.3%
0.4%
2000
48.9%
48.6%
47.9%
50.8%
3.2%
0.7%
1996
48.1%
46.9%
44.5%
45.9%
7.3%
7.2%
Breakdown of population affiliated with a religious congregation
Type
Adherents
Congregations
Religion
Columbus
Greensboro
Columbus
Greensboro
CATHOLIC CHURCH
13.2%
3.6%
5.6%
1.0%
EVANGELICAL LUTHERAN CHURCH IN AMERICA
1.6%
0.8%
3.7%
2.2%
SOUTHERN BAPTIST CONVENTION
1.6%
9.6%
6.8%
16.5%
MUSLIM ESTIMATE
1.3%
0.8%
1.9%
0.7%
VINEYARD USA
1.3%
0.0%
1.2%
0.1%
AMERICAN BAPTIST CHURCHES IN THE USA
1.0%
0.1%
3.3%
0.3%
EPISCOPAL CHURCH
0.4%
1.2%
1.3%
1.5%
SEVENTH DAY ADVENTIST CHURCH
0.4%
0.5%
2.0%
0.7%
INTERNA PENTECO HOLINESS CHURCH
0.0%
0.3%
0.1%
1.5%
Weather
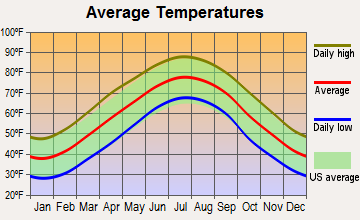
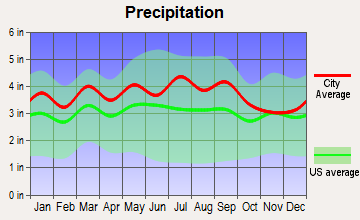
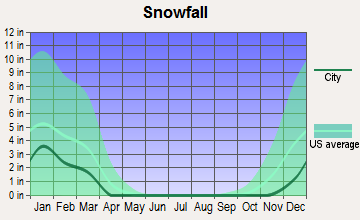
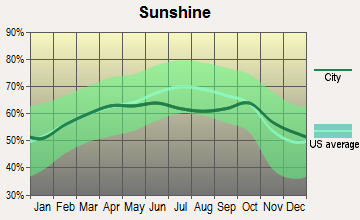
Climate-wise, Columbus experiences a typical Midwestern climate with relatively hot and humid summers and cold winters, while Greensboro enjoys a more moderate climate. Summers in Greensboro tend to be warm, and winters are usually mild. Each city gets generous amounts of precipitation throughout the year, with Columbus prone to snowfall during winter and Greensboro receiving regular, evenly distributed rainfall.
Weather and climate
Type
Columbus
Greensboro
Temperature - Average
52.8°F
58.4°F
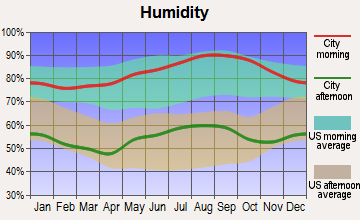
Humidity - Average morning or afternoon humidity
74.8%
72.8%
Humidity - Differences between morning and afternoon humidity
34%
42%
Humidity - Maximum monthly morning or afternoon humidity
86%
88%
Humidity - Minimum monthly morning or afternoon humidity
52%
46%
Precipitation - Yearly average
39.3 in
44.3 in
Snowfall - Yearly average
56.6 in
17 in
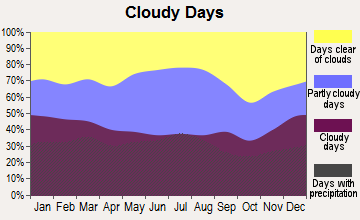
Clouds - Number of days clear of clouds
12%
18.3%
Sunshine amount - Average
49.7%
64.7%
Sunshine amount - Differences during a year
27%
10%
Sunshine amount - Maximum monthly
55%
64%
Sunshine amount - Minimum monthly
28%
54%
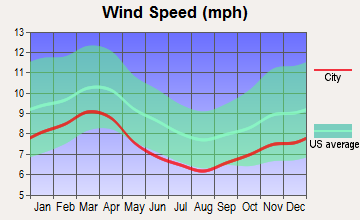
Wind speed - Average
8.2 mph
7.7 mph
Average climate in Columbus, Ohio
Average climate in Greensboro, North Carolina
Air pollution
Type
AQI
CO
NO2
OZONE
PM10
PM25
SO2
Year
Columbus
Greensboro
Columbus
Greensboro
Columbus
Greensboro
Columbus
Greensboro
Columbus
Greensboro
Columbus
Greensboro
Columbus
Greensboro
2018
69
69
0.11
N/A
10.0
6.7
33.8
32.1
N/A
16.7
6.0
7.4
0.0
0.2
2017
68
71
0.16
N/A
9.6
7.0
28.7
29.1
N/A
11.9
5.5
7.9
0.1
0.3
2016
76
82
0.17
N/A
10.6
6.6
28.5
31.9
N/A
11.1
5.6
8.5
0.1
0.2
2015
74
74
0.16
N/A
11.3
6.8
27.0
28.8
N/A
12.3
6.1
8.2
0.1
0.3
2014
82
72
0.20
N/A
11.0
6.3
28.5
33.5
N/A
12.9
7.4
9.0
0.5
0.4
2013
78
74
N/A
N/A
8.9
6.0
29.6
28.5
N/A
12.0
7.8
8.3
0.6
0.3
2012
87
83
N/A
N/A
N/A
8.9
32.9
32.5
N/A
13.5
8.9
9.2
N/A
0.4
2011
89
84
N/A
N/A
N/A
7.5
28.1
34.7
N/A
14.8
8.9
9.9
N/A
1.0
2010
90
97
N/A
N/A
N/A
9.5
30.5
35.6
N/A
16.0
9.1
10.4
N/A
0.3
2009
61
81
N/A
N/A
N/A
13.3
28.7
30.4
N/A
14.2
N/A
9.9
N/A
3.9
2008
65
98
N/A
N/A
N/A
11.1
31.2
33.7
N/A
16.7
N/A
12.7
1.8
6.3
2007
80
102
N/A
N/A
N/A
11.1
30.8
37.9
N/A
19.8
N/A
13.7
2.8
5.5
2006
75
90
N/A
N/A
N/A
10.3
30.0
33.6
23.7
19.4
N/A
14.9
3.3
5.1
2005
87
83
N/A
0.70
N/A
10.5
29.6
33.1
27.5
19.6
N/A
N/A
4.1
5.1
2004
77
76
N/A
0.56
N/A
12.9
27.8
24.9
24.6
19.8
N/A
N/A
4.4
4.3
2003
91
88
N/A
0.56
N/A
14.8
26.4
29.3
23.9
18.9
N/A
N/A
4.1
5.5
2002
93
99
N/A
0.65
N/A
14.3
31.3
34.8
25.7
19.7
N/A
N/A
4.1
5.0
2001
84
103
N/A
0.70
N/A
16.0
29.2
31.0
25.9
21.4
N/A
N/A
3.5
4.5
2000
57
90
N/A
0.68
N/A
17.1
N/A
31.2
23.5
21.2
N/A
N/A
3.7
4.4
Natural disasters
Type
Columbus
Greensboro
Tornado activity compared to U.S. average
119.1%
76.6%
Earthquake activity compared to U.S. average
96.1%
67.4%
Natural disasters compared to U.S. average
16%
20%
Transportation
Columbus Metropolitan Area features a reliable bus service—the Central Ohio Transit Authority. It also has several major highways with an average commute time slightly below the national average. Meanwhile, Greensboro's public transit system includes buses, shuttles, and Amtrak services, with an average commute time similar to Columbus.
Transport
Type
Columbus
Greensboro
Amtrak stations
1
1
Amtrak stations nearby
1
2
FAA registered aircraft
415
300
FAA registered aircraft manufacturers and dealers
4
13
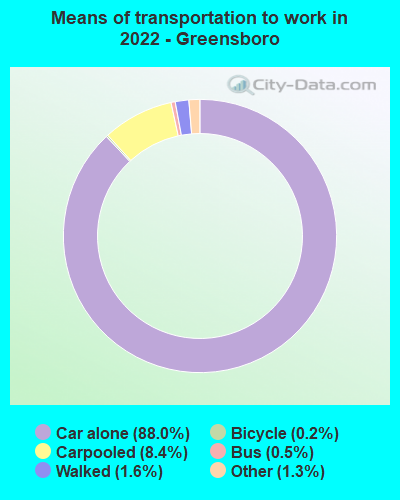
Means of transportation to work
Type
Columbus
Greensboro
Bicycle
0.6%
0.1%
Bus
1.6%
1%
Carpooled
7.4%
6.8%
Car alone
86.7%
89.4%
Taxicab
0.1%
0.2%
Walked
2.2%
1.2%
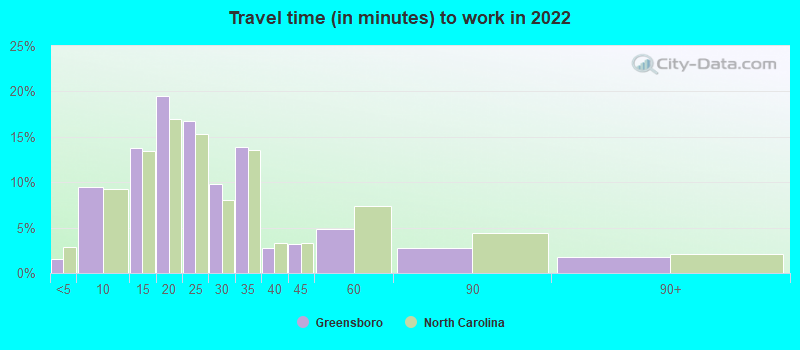
Average travel time to work
Type
Columbus
Greensboro
Average
26.1 min
24.8 min
Other means
21.7 min
20.9 min
Public transportation
35.4 min
42.2 min
Private vehicle occupancy
Type
Columbus
Greensboro
Average
1.1
1.1
Drove alone
90.7%
91.9%
In 2 person carpool
7.3%
5.8%
In 3 person carpool
1.4%
1.5%
In 4 person carpool
0.5%
0.5%
In 7+ person carpool
0.1%
0.2%
How many people usually rode to work in the car, truck or van.
Real Estate
Real estate markets in both cities are competitive. While house prices in Columbus are slightly higher than the national average, they are low in comparison to other major U.S. cities, making it attractive for many potential residents. Conversely, in Greensboro, house prices are lower than the national average.
Neighborhoods
Columbus offers a mix of urban and suburban neighborhoods. Some popular neighborhoods include Clintonville, German Village, and Victorian Village. In contrast, Greensboro offers diverse communities like Fisher Park, Irving Park, and downtown Greensboro, all with their unique charm.
Houses and residents
Type
Columbus
Greensboro
Houses
422,120
139,565
Average household size (people)
2.3
2.3
Median year apartment built
1982
1989
Median year house/condo built
1977
1981
Length of stay in the house since moving in
12.6 years
13.6 years
Houses occupied
390,605 (92.5%)
123,955 (88.8%)
Houses occupied by owners
175,427 (44.9%)
69,834 (56.3%)
Houses occupied by renters
215,178 (55.1%)
54,121 (43.7%)
Median rent asked for vacant for-rent units
$1,371
$1,295
Median monthly housing costs
$1,110
$981
Median price asked for vacant for-sale houses and condos
$195,022
$336,309
Estimated median house or condo value
$219,200
$186,200
Median numbers of rooms
5
5.3
Median number of rooms in apartments
4.2
4
Median number of rooms in houses and condos
6.3
6.3
Median house price - detached houses
$233,452
$261,886
Median house price - in 2-unit structures
$121,729
$205,442
Median house price - in 3-to-4-unit structures
$215,337
$240,978
Median house price - in 5 or more unit structures
$240,711
$129,256
Median house price - mobile homes
$121,578
$86,037
Median house price - Townhouses or other attached units
$218,726
$221,087
Median house price - All housing units
$229,736
$252,845
Median house age
42
37
Renting percentage
53%
47.5%
Housing density (houses/condos per square mile)
2,007.5
1,332.9
House value disparities
30.2%
36.2%
Household income disparities
42.4%
45.9%
Median household income for houses/condes with a mortgage
$89,058
$75,953
Median household income for apartments without a mortgage
$59,295
$62,470
Housing units without a mortgage
4,290 (3.3%)
1,421 (3.1%)
Housing units with both a second mortgage and home equity loan
10,651 (8.2%)
3,736 (8.1%)
Housing units with a mortgage
125,487 (96.7%)
44,909 (96.9%)
Housing units with a home equity loan
775 (0.6%)
227 (0.5%)
Housing units with a second mortgage
13,558 (10.4%)
5,099 (11%)
House/condo owner moved in on average (years ago)
10
12
House/condo renter moved in on average (years ago)
1
1
Housing units lacking complete kitchen facilities
1.6%
1.8%
Housing units lacking complete plumbing facilities
1.3%
0.5%
Housing units in structures
Housing units in structures
Columbus
Greensboro
One, detached
45.8%
55.4%
One, attached
9.1%
7.3%
Two
4.0%
1.7%
3 or 4
8.6%
5.4%
5 to 9
11.8%
9.0%
10 to 19
8.6%
8.6%
20 to 49
4.5%
7.0%
50 or more
6.8%
4.3%
Mobile homes
0.8%
1.3%
Boats, RVs, vans, etc.
0.1%
0.0%
Median real estate property taxes paid for housing units
Self-employed workers in own not incorporated business
20,915
6,258
State government workers
31,881
9,041
Unpaid family workers
724
205
Industries and Occupations
Both cities boast diverse job industries. In Columbus, the financial and insurance sectors also have a strong presence alongside education and healthcare. Greensboro, historically reliant on manufacturing, now sees growth in education, healthcare, and retail trade.
Columbus offers high-quality healthcare with a significant number of top-ranked hospitals including The Ohio State University Wexner Medical Center. Greensboro also provides quality healthcare services, with Cone Health system being the major provider.
Health (county statistics)
Type
Columbus
Greensboro
General health status score of residents in this county from 1 (poor) to 5 (excellent)
As for infrastructure, Columbus benefits from having a major airport, several interstates, and efficient public transportation. In Greensboro, the Piedmont Triad International Airport and a network of highways make travel easy within and outside the city.
Infrastructure
Type
Columbus
Greensboro
Hospitals
47
16
TV stations
14
10
Arenas or stadiums
3
1
Bank branches located here
200
97
Bank institutions located here
25
19
Main business address for public companies
23
11
Drinking water stations with no reported violations in the past
17
3
Drinking water stations with reported violations in the past
HMDA - Conventional home purchase loans - Applications denied
Year
Columbus
Greensboro
1999
2,450
1,540
2000
2,376
1,012
2001
1,897
739
2002
1,483
787
2003
2,087
568
2004
3,216
692
2005
4,275
748
2006
4,662
880
2007
2,679
653
2008
1,015
290
2009
555
164
Culture and Food
On the cultural and culinary front, Columbus boasts a dynamic art scene with a wide variety of restaurants featuring global cuisines, craft breweries, and food festivals. Greensboro is also culturally rich, with Southern traditions alive in its music scene, art galleries, and eateries serving everything from soul food to contemporary cuisine.
Sports Teams
Sports enthusiasts may know that Columbus is home to NHL's Columbus Blue Jackets, MLS's Columbus Crew SC, and Ohio State University's Buckeyes. On the other hand, Greensboro lacks major league teams, but hosts minor league baseball and hockey teams, and the ACC Basketball Tournament.


 Columbus, OH
 Greensboro, NC