Columbus, Ohio, and Huntsville, Alabama are two prominent American cities each offering unique traits that attract both residents and tourists. While both cities seem to play in different leagues due to their different climates, economy, and city landscapes, they deliver exceptional experiences in terms of lifestyle, culture, transportation, education, and work opportunities. Let's compare these two cities in-depth across various domains to understand their distinct characteristics.
Distance between
Columbus, OH and
Huntsville, AL : 414.8 miles
Columbus's population is larger by 318%. Its population has grown by 195,058 people (27.4%) since 2000. The population of Huntsville has grown by 58,747 people (37.1%) during that time.
Columbus, Ohio, reports a higher crime rate than the US average, warranting some caution. However, many neighborhoods are relatively safe, and the overall crime rate has been on a declining trend. Huntsville, Alabama, on the other hand, also has a crime rate slightly higher than the national average. Nevertheless, its crime rate is statistically lower than Columbus, making it comparatively safer.
City-data.com crime index counts serious crimes and violent crime more heavily. It adjusts for the number of visitors and daily workers commuting into cities. (higher means more crime, U.S. average = 301.1)
City-data.com crime index counts serious crimes and violent crime more heavily. It adjusts for the number of visitors and daily workers commuting into cities. (higher means more crime, U.S. average = 301.1)
Sex Offenders
According to our data, there are 1,506 registered sex offenders living in Columbus and 157 registered sex offenders living in . The ratio of residents to sex offenders in Columbus is 573 to 1; the ratio in Huntsville is 1,250 to 1. The number of registered sex offenders compared to the number of residents is larger in Columbus than in Huntsville.
Cost of Living
The cost of living in Huntsville, Alabama, is significantly lower than in Columbus, Ohio, and also below the national average. This directly impacts housing and transportation costs, in favor of Huntsville residents and visitors. On the other hand, Columbus residents experience a slightly more expensive living cost, attributed mostly to housing and specific tax structures.
Income Tax
Ohio has graduated state income tax rates ranging from 0% to 4.797%. Alabama imposes a state income tax that varies from 2% up to 5%. Both states allow cities to add on their income taxes.
Property Tax
Property tax rates in Columbus are relatively high, while Huntsville has much lower rates, reflecting Alabama's overall low property taxes.
Sales Tax
Ohio has statewide 5.75% sales tax, with an added 2.75% in Columbus. Alabama has a statewide 4% sales tax, but combined with local sales taxes, Huntsville's total sales tax can reach up to 9%.
Income
Type
Columbus
Huntsville
Estimated median household income
$58,202
$70,757
Estimated per capita income
$32,392
$42,232
Cost of living index (U.S. average is 100)
96.1
83.8
If you make $50,000 in Huntsville, you will have to make $57,339 in Columbus to maintain the same standard of living.
Geographical Conditions
Columbus is relatively flat, with the Scioto and Olentangy rivers running through the city. Huntsville is situated in the Appalachian region, and it offers a much more hilly terrain with beautiful mountain views.
Both Columbus and Huntsville value education, with numerous public and private institutions present. However, Columbus is home to the prestigious Ohio State University, which regularly ranks among the best in the country. Huntsville, too, has notable institutions, such as the University of Huntsville, Alabama, renowned particularly for its Engineering and Nursing schools.
Columbus has a diverse economy with high employment rates in education, government, insurance, banking, food, logistics, medical research, energy, health care, and technology. Huntsville's economy centers around the aerospace and military technology industries. It's widely known as "Rocket City," earning a reputation for high-paying tech and engineering jobs.
Biggest Employers
In Columbus, some of the biggest employers include Ohio State University, the State of Ohio, and Nationwide Insurance. Huntsville hosts the Redstone Arsenal military installation, NASA's Marshall Space Flight Center, and the Cummings Research Park, representing major employment hubs.
There were 913 building permits issued in Columbus in 2012 (246 more than in 2011) compared to 1,483 building permits issued in Huntsville in 2012 (465 more than in 2011).
In Columbus (Franklin County), 60.8% voted for Democrats and 37.9% for Republicans in 2012 Presidential Election. In Huntsville (Madison County), 40.2% voted for Democrats and 58.9% for Republicans.
Elections
Type
Democrats
Republicans
Other
Year
Columbus
Huntsville
Columbus
Huntsville
Columbus
Huntsville
2020
64.7%
44.8%
33.4%
52.8%
1.9%
2.4%
2016
59.8%
38.4%
33.9%
54.8%
6.2%
6.8%
2012
60.8%
40.2%
37.9%
58.9%
1.3%
1.0%
2008
59.8%
41.9%
39.0%
56.9%
1.2%
1.2%
2004
54.5%
40.2%
45.2%
59.0%
0.3%
0.8%
2000
48.9%
42.6%
47.9%
54.9%
3.2%
2.5%
1996
48.1%
41.9%
44.5%
50.0%
7.3%
8.1%
Breakdown of population affiliated with a religious congregation
Type
Adherents
Congregations
Religion
Columbus
Huntsville
Columbus
Huntsville
CATHOLIC CHURCH
13.2%
4.2%
5.6%
1.4%
EVANGELICAL LUTHERAN CHURCH IN AMERICA
1.6%
0.5%
3.7%
0.9%
SOUTHERN BAPTIST CONVENTION
1.6%
19.9%
6.8%
21.8%
MUSLIM ESTIMATE
1.3%
0.3%
1.9%
0.7%
VINEYARD USA
1.3%
0.0%
1.2%
0.2%
AMERICAN BAPTIST CHURCHES IN THE USA
1.0%
0.6%
3.3%
0.2%
EPISCOPAL CHURCH
0.4%
1.0%
1.3%
1.4%
SEVENTH DAY ADVENTIST CHURCH
0.4%
1.9%
2.0%
2.5%
LUTHERAN CHURCH
0.2%
0.3%
1.0%
1.2%
PRESBYTERIAN CHURCH IN AMERICA
0.0%
0.7%
0.3%
1.4%
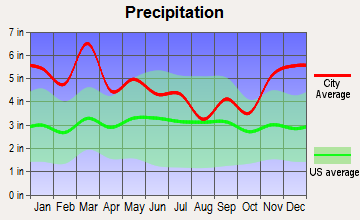
Weather
Weather in Columbus, Ohio, is characterized by hot, muggy summers and cold, windy winters. The city also experiences a fair amount of rainfall throughout the year. Huntsville, Alabama, contrasts with a considerably warmer climate. Winters are relatively mild and short while summers are hot and humid. Differences in the climate of these two cities may play a significant role in the residential preference.
Weather and climate
Type
Columbus
Huntsville
Temperature - Average
52.8°F
60.2°F
Humidity - Average morning or afternoon humidity
74.8%
76.7%
Humidity - Differences between morning and afternoon humidity
34%
39%
Humidity - Maximum monthly morning or afternoon humidity
86%
90%
Humidity - Minimum monthly morning or afternoon humidity
52%
51%
Precipitation - Yearly average
39.3 in
56.7 in
Snowfall - Yearly average
56.6 in
7.2 in
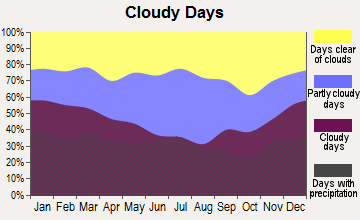
Clouds - Number of days clear of clouds
12%
16.7%
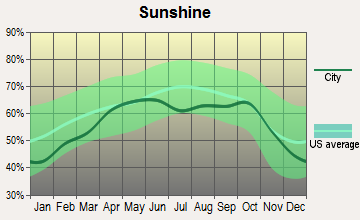
Sunshine amount - Average
49.7%
60.9%
Sunshine amount - Differences during a year
27%
20.2%
Sunshine amount - Maximum monthly
55%
64.5%
Sunshine amount - Minimum monthly
28%
44.3%
Wind speed - Average
8.2 mph
7.8 mph
Average climate in Columbus, Ohio
Average climate in Huntsville, Alabama
Air pollution
Type
AQI
CO
NO2
OZONE
PM10
PM25
SO2
Year
Columbus
Huntsville
Columbus
Columbus
Huntsville
Columbus
Huntsville
Columbus
Columbus
Huntsville
Columbus
Huntsville
2018
69
66
0.11
N/A
10.0
N/A
33.8
31.9
N/A
N/A
6.0
9.3
0.0
N/A
2017
68
60
0.16
N/A
9.6
N/A
28.7
30.4
N/A
N/A
5.5
6.7
0.1
N/A
2016
76
74
0.17
N/A
10.6
N/A
28.5
33.4
N/A
N/A
5.6
7.8
0.1
N/A
2015
74
67
0.16
N/A
11.3
N/A
27.0
30.2
N/A
N/A
6.1
7.7
0.1
N/A
2014
82
60
0.20
N/A
11.0
N/A
28.5
31.5
N/A
N/A
7.4
N/A
0.5
N/A
2013
78
60
N/A
N/A
8.9
N/A
29.6
32.5
N/A
N/A
7.8
N/A
0.6
N/A
2012
87
81
N/A
N/A
N/A
N/A
32.9
34.0
N/A
N/A
8.9
N/A
N/A
N/A
2011
89
82
N/A
N/A
N/A
N/A
28.1
33.9
N/A
N/A
8.9
N/A
N/A
N/A
2010
90
82
N/A
N/A
N/A
N/A
30.5
32.4
N/A
N/A
9.1
11.1
N/A
N/A
2009
61
73
N/A
N/A
N/A
N/A
28.7
31.3
N/A
N/A
N/A
12.2
N/A
N/A
2008
65
70
N/A
N/A
N/A
N/A
31.2
30.4
N/A
N/A
N/A
N/A
1.8
N/A
2007
80
85
N/A
N/A
N/A
N/A
30.8
32.1
N/A
N/A
N/A
N/A
2.8
N/A
2006
75
84
N/A
N/A
N/A
N/A
30.0
31.1
23.7
N/A
N/A
N/A
3.3
N/A
2005
87
81
N/A
N/A
N/A
N/A
29.6
28.6
27.5
N/A
N/A
N/A
4.1
N/A
2004
77
80
N/A
N/A
N/A
N/A
27.8
28.1
24.6
N/A
N/A
N/A
4.4
N/A
2003
91
82
N/A
N/A
N/A
5.3
26.4
27.5
23.9
N/A
N/A
N/A
4.1
1.6
2002
93
83
N/A
N/A
N/A
N/A
31.3
26.6
25.7
N/A
N/A
N/A
4.1
N/A
2001
84
80
N/A
N/A
N/A
N/A
29.2
27.3
25.9
N/A
N/A
N/A
3.5
N/A
2000
57
95
N/A
N/A
N/A
N/A
N/A
29.5
23.5
N/A
N/A
N/A
3.7
N/A
Natural disasters
Type
Columbus
Huntsville
Tornado activity compared to U.S. average
119.1%
246.2%
Earthquake activity compared to U.S. average
96.1%
262.1%
Natural disasters compared to U.S. average
16%
17%
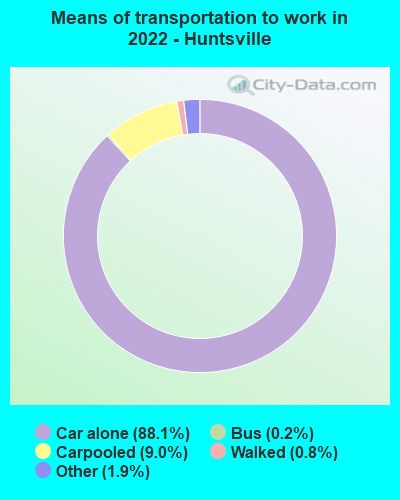
Transportation
Columbus offers robust public transit with the Central Ohio Transit Authority (COTA). The city also has a vast network of bike paths and lanes. Huntsville strongly encourages vehicle possession with limited public transit.
Transport
Type
Columbus
Huntsville
Amtrak stations
1
0
Amtrak stations nearby
1
0
FAA registered aircraft
415
280
FAA registered aircraft manufacturers and dealers
4
5
Means of transportation to work
Type
Columbus
Huntsville
Bicycle
0.6%
0.1%
Bus
1.6%
0.2%
Carpooled
7.4%
6.5%
Car alone
86.7%
91.5%
Taxicab
0.1%
0.2%
Walked
2.2%
0.9%
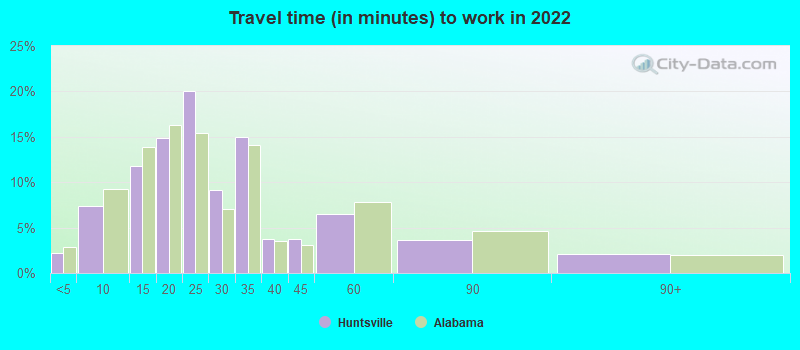
Average travel time to work
Type
Columbus
Huntsville
Average
26.1 min
28.5 min
Other means
21.7 min
19.3 min
Public transportation
35.4 min
31.7 min
Private vehicle occupancy
Type
Columbus
Huntsville
Average
1.1
1.1
Drove alone
90.7%
93.2%
In 2 person carpool
7.3%
4.7%
In 3 person carpool
1.4%
1.3%
In 4 person carpool
0.5%
0.6%
In 5-6 person carpool
0.1%
0.2%
How many people usually rode to work in the car, truck or van.
Real Estate
The real estate market in Columbus is somewhat more expensive than in Huntsville. Both cities offer a mix of urban, suburban, and rural housing options, but Huntsville's lower cost of living gives it an edge for those seeking affordable housing options.
Neighborhoods
Both cities offer varying neighborhoods to suit all lifestyles. Columbus has vibrant areas like Short North and German Village, perfect for young professionals and families. Huntsville's trendy areas include Five Points and Downtown, offering a mix of historic charm and urban convenience.
Houses and residents
Type
Columbus
Huntsville
Houses
422,120
104,141
Average household size (people)
2.3
2.3
Median year apartment built
1982
1985
Median year house/condo built
1977
1983
Length of stay in the house since moving in
12.6 years
12.6 years
Houses occupied
390,605 (92.5%)
96,551 (92.7%)
Houses occupied by owners
175,427 (44.9%)
59,015 (61.1%)
Houses occupied by renters
215,178 (55.1%)
37,536 (38.9%)
Median rent asked for vacant for-rent units
$1,371
$1,286
Median monthly housing costs
$1,110
$935
Median price asked for vacant for-sale houses and condos
$195,022
$246,721
Estimated median house or condo value
$219,200
$250,400
Median numbers of rooms
5
6
Median number of rooms in apartments
4.2
4.3
Median number of rooms in houses and condos
6.3
7.3
Median house price - detached houses
$233,452
$257,633
Median house price - in 2-unit structures
$121,729
$66,368
Median house price - in 3-to-4-unit structures
$215,337
$111,845
Median house price - in 5 or more unit structures
$240,711
$246,169
Median house price - mobile homes
$121,578
$113,555
Median house price - occupied boats, rvs, vans etc.
$27,006
$12,217
Median house price - Townhouses or other attached units
$218,726
$196,303
Median house price - All housing units
$229,736
$253,177
Median house age
42
39
Renting percentage
53%
42%
Housing density (houses/condos per square mile)
2,007.5
598.4
House value disparities
30.2%
36.8%
Household income disparities
42.4%
45%
Median household income for houses/condes with a mortgage
$89,058
$100,571
Median household income for apartments without a mortgage
$59,295
$69,689
Housing units without a mortgage
4,290 (3.3%)
806 (2.3%)
Housing units with both a second mortgage and home equity loan
10,651 (8.2%)
2,456 (6.9%)
Housing units with a mortgage
125,487 (96.7%)
35,004 (97.7%)
Housing units with a home equity loan
775 (0.6%)
0 (0%)
Housing units with a second mortgage
13,558 (10.4%)
2,651 (7.4%)
House/condo owner moved in on average (years ago)
10
10
House/condo renter moved in on average (years ago)
1
1
Housing units lacking complete kitchen facilities
1.6%
2%
Housing units lacking complete plumbing facilities
1.3%
1.1%
Housing units in structures
Housing units in structures
Columbus
Huntsville
One, detached
45.8%
67.1%
One, attached
9.1%
3.5%
Two
4.0%
2.0%
3 or 4
8.6%
5.2%
5 to 9
11.8%
6.3%
10 to 19
8.6%
6.6%
20 to 49
4.5%
3.2%
50 or more
6.8%
5.3%
Mobile homes
0.8%
0.9%
Boats, RVs, vans, etc.
0.1%
0.0%
Median real estate property taxes paid for housing units
Self-employed workers in own not incorporated business
20,915
5,111
State government workers
31,881
4,814
Unpaid family workers
724
668
Industries and Occupations
Central Ohio's diverse economy offers a wide array of career opportunities. Main industries include insurance, healthcare, education, logistics, banking, and food manufacturing. Conversely, Huntsville has a prominent presence of the aerospace and defense industries, providing numerous high-paying technical and engineering roles.
Both cities offer high-quality healthcare services. Columbus is home to the Ohio State University Wexner Medical Center, one of the top hospitals in the country. Huntsville's healthcare is anchored by the Huntsville Hospital Health System.
Health (county statistics)
Type
Columbus
Huntsville
General health status score of residents in this county from 1 (poor) to 5 (excellent)
With a blend of modern and historic architecture, Columbus features advanced infrastructure with robust city services. The city also constantly updates its road system, public spaces, and utility services. Huntsville also boast impressive compact and efficient infrastructure, with continuously evolving development projects.
Infrastructure
Type
Columbus
Huntsville
Hospitals
47
10
TV stations
14
9
Arenas or stadiums
3
1
Bank branches located here
200
62
Bank institutions located here
25
20
Main business address for public companies
23
3
Drinking water stations with no reported violations in the past
17
3
Drinking water stations with reported violations in the past
HMDA - Conventional home purchase loans - Applications denied
Year
Columbus
Huntsville
1999
2,450
536
2000
2,376
393
2001
1,897
234
2002
1,483
259
2003
2,087
261
2004
3,216
393
2005
4,275
556
2006
4,662
607
2007
2,679
425
2008
1,015
178
2009
555
104
Culture and Food
Columbus offers a rich community culture, with a strong music scene, numerous art galleries, and diverse cuisines. Huntsville caters to a variety of tastes, offering barbecue, Southern comfort food, and a rich variety of international cuisines.
Sports Teams
Sports enthusiasts may prefer Columbus, as the city hosts Columbus Blue Jackets (NHL), Columbus Crew SC (MLS), and is a short drive from Cleveland and Cincinnati's professional teams. Huntsville hosts minor league baseball with the Rocket City Trash Pandas.


 Columbus, OH
 Huntsville, AL