Columbus, Ohio and Mobile, Alabama, offer two distinctive living experiences shaped by numerous factors, including economy, weather conditions, and cultural scene. While Columbus's robust economy and vibrant sports culture may appeal to many, Mobile entices with its warm climate and lower cost of living. In comparing these two cities, these and other considerations can help guide your relocation decisions, whether you're interested in work, education, or lifestyle options.
Distance between
Columbus, OH and
Mobile, AL : 704.5 miles
Columbus's population is larger by 390%. Its population has grown by 195,058 people (27.4%) since 2000. The population of Mobile has decreased by 13,963 people (7.0%) during that time.
Columbus has a higher crime rate than the national average, but it's similar to the rate in Mobile. However, Columbus has witnessed a decline in the crime rate over recent years, thanks to the city's proactive initiatives and community engagement in supporting safe neighborhoods. Mobile's crime statistics largely depend on the neighborhood, with safer areas contrasting with more crime-ridden districts. For tourists, both cities offer safe areas busy with attractions, but it's always advisable to research and stay cautious in unfamiliar areas.
City-data.com crime index counts serious crimes and violent crime more heavily. It adjusts for the number of visitors and daily workers commuting into cities. (higher means more crime, U.S. average = 301.1)
City-data.com crime index counts serious crimes and violent crime more heavily. It adjusts for the number of visitors and daily workers commuting into cities. (higher means more crime, U.S. average = 301.1)
Sex Offenders
According to our data, there are 1,506 registered sex offenders living in Columbus and 463 registered sex offenders living in . The ratio of residents to sex offenders in Columbus is 573 to 1; the ratio in Mobile is 419 to 1. The number of registered sex offenders compared to the number of residents is a smaller in Columbus than in Mobile.
Cost of Living
Mobile's cost of living is lower than the national average, making it an affordable place to live, especially compared to Columbus where the cost is slightly higher than national averages. Components such as groceries, housing, and utilities comprise the lower costs in Mobile. For tourists, this translates to more affordable dining and accommodation options.
Income Tax
Ohio has a progressive state income tax, and the rate for Columbus residents can range from 0% to 4.797% based on total income. Alabama also has a progressive income tax system, with rates ranging from 2% to 5%. However, Mobile does not levy a city income tax.
Property Tax
In Columbus, the city property tax includes a base rate plus charges for city services, assessed based on property value. In Mobile, the property tax rate is considerably lower, another factor contributing to the city's affordability.
Sales Tax
Ohio's state sales tax is 5.75%, but Columbus charges an additional 2.5% municipal tax, totaling 8.25%. Alabama's state sales tax is 4%, but Mobile adds up to 10% in city and county taxes, pushing the total potential rate to 14%, among the highest in the U.S.
Income
Type
Columbus
Mobile
Estimated median household income
$58,202
$43,786
Estimated per capita income
$32,392
$28,706
Cost of living index (U.S. average is 100)
96.1
84
If you make $50,000 in Mobile, you will have to make $57,202 in Columbus to maintain the same standard of living.
Geographical Conditions
Columbus enjoys a midwestern landscape with a mix of urban and suburban settings, along with rivers and parks for outdoor exploration. Mobile is located on the Gulf Coast, offering a unique blend of urban living and beachside relaxation, with waterways and wetlands adding to its natural appeal.
Columbus is home to Ohio State University, a major research institution contributing significantly to the city's intellectual and cultural life. Other institutes, including the Columbus College of Art & Design, also provide solid educational foundations. Mobile houses the University of South Alabama, an important regional player. Although it doesn't match the scale of Ohio State, it serves the Gulf Coast region effectively.
Columbus sports a diverse and prosperous economy, anchored by sectors such as education, insurance, banking, fashion, defense, aviation, food, logistics, steel, energy, medical research, health care, and hospitality. Mobile's economy is more reliant on sectors like shipbuilding, oil, retail, and aerospace. Overall, Columbus provides more opportunities for job-seekers in diverse fields.
Biggest Employers
In Columbus, The Ohio State University, Wexner Medical Center, and Nationwide Children's Hospital are major employment hubs. Conversely, Mobile's largest employers include the Mobile County Public School System, Austal USA, Infirmary Health Systems, the City of Mobile, and the University of South Alabama.
There were 913 building permits issued in Columbus in 2012 (246 more than in 2011) compared to 99 building permits issued in Mobile in 2012 (21 less than in 2011).
In Columbus (Franklin County), 60.8% voted for Democrats and 37.9% for Republicans in 2012 Presidential Election. In Mobile (Mobile County), 45.1% voted for Democrats and 54.4% for Republicans.
Elections
Type
Democrats
Republicans
Other
Year
Columbus
Mobile
Columbus
Mobile
Columbus
Mobile
2020
64.7%
43.4%
33.4%
55.3%
1.9%
1.3%
2016
59.8%
41.8%
33.9%
55.1%
6.2%
3.1%
2012
60.8%
45.1%
37.9%
54.4%
1.3%
0.5%
2008
59.8%
45.6%
39.0%
54.4%
1.2%
0.0%
2004
54.5%
40.8%
45.2%
58.9%
0.3%
0.4%
2000
48.9%
42.0%
47.9%
56.0%
3.2%
2.0%
1996
48.1%
42.1%
44.5%
51.3%
7.3%
6.6%
Breakdown of population affiliated with a religious congregation
Type
Adherents
Congregations
Religion
Columbus
Mobile
Columbus
Mobile
CATHOLIC CHURCH
13.2%
7.7%
5.6%
5.8%
EVANGELICAL LUTHERAN CHURCH IN AMERICA
1.6%
0.1%
3.7%
0.3%
SOUTHERN BAPTIST CONVENTION
1.6%
21.9%
6.8%
19.4%
MUSLIM ESTIMATE
1.3%
0.4%
1.9%
0.8%
VINEYARD USA
1.3%
0.0%
1.2%
0.0%
AMERICAN BAPTIST CHURCHES IN THE USA
1.0%
0.3%
3.3%
0.2%
EPISCOPAL CHURCH
0.4%
1.4%
1.3%
2.5%
SEVENTH DAY ADVENTIST CHURCH
0.4%
0.6%
2.0%
0.8%
LUTHERAN CHURCH
0.2%
0.3%
1.0%
1.0%
Weather
Weather may be a significant factor when deciding between Columbus and Mobile. Columbus has a midwestern climate with hot summers, cold winters, and a fair amount of snow. On the other hand, Mobile offers a tropical climate, with humid summers and mild winters. For tourists, Mobile is a great place to escape the cold winters, and Columbus shines in the summer when city events and outdoor activities are at their best.
Weather and climate
Type
Columbus
Mobile
Temperature - Average
52.8°F
66.7°F
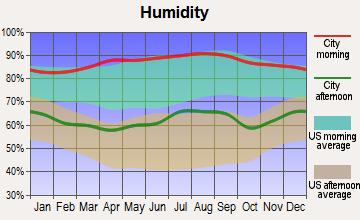
Humidity - Average morning or afternoon humidity
74.8%
78.1%
Humidity - Differences between morning and afternoon humidity
34%
38%
Humidity - Maximum monthly morning or afternoon humidity
86%
91%
Humidity - Minimum monthly morning or afternoon humidity
52%
53%
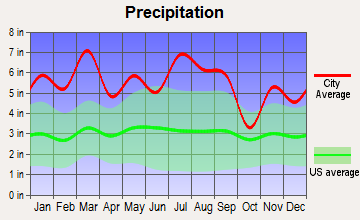
Precipitation - Yearly average
39.3 in
66.3 in
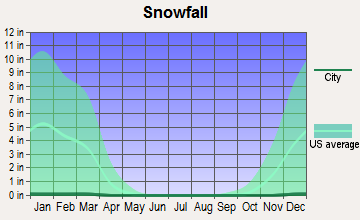
Snowfall - Yearly average
56.6 in
0.8 in
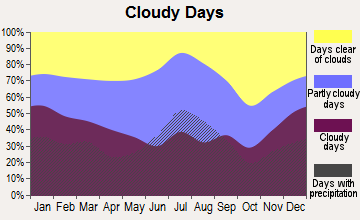
Clouds - Number of days clear of clouds
12%
17.1%
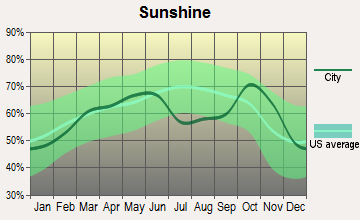
Sunshine amount - Average
49.7%
65.3%
Sunshine amount - Differences during a year
27%
23.7%
Sunshine amount - Maximum monthly
55%
70.9%
Sunshine amount - Minimum monthly
28%
47.2%
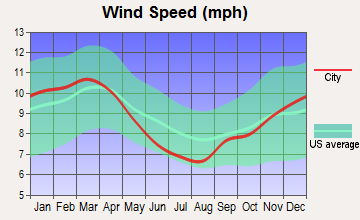
Wind speed - Average
8.2 mph
8.1 mph
Average climate in Columbus, Ohio
Average climate in Mobile, Alabama
Air pollution
Type
AQI
CO
NO2
OZONE
PB
PM10
PM25
SO2
Year
Columbus
Mobile
Columbus
Mobile
Columbus
Columbus
Mobile
Mobile
Columbus
Columbus
Mobile
Columbus
Mobile
2018
69
66
0.11
N/A
10.0
N/A
33.8
24.6
N/A
N/A
N/A
N/A
6.0
8.0
0.0
0.5
2017
68
79
0.16
N/A
9.6
N/A
28.7
25.6
N/A
N/A
N/A
N/A
5.5
6.5
0.1
0.4
2016
76
72
0.17
N/A
10.6
N/A
28.5
23.6
N/A
N/A
N/A
N/A
5.6
9.5
0.1
0.6
2015
74
72
0.16
N/A
11.3
N/A
27.0
24.1
N/A
N/A
N/A
N/A
6.1
9.1
0.1
N/A
2014
82
77
0.20
N/A
11.0
N/A
28.5
25.6
N/A
N/A
N/A
N/A
7.4
N/A
0.5
N/A
2013
78
57
N/A
N/A
8.9
N/A
29.6
24.0
N/A
N/A
N/A
N/A
7.8
N/A
0.6
N/A
2012
87
70
N/A
N/A
N/A
N/A
32.9
25.9
N/A
N/A
N/A
N/A
8.9
N/A
N/A
N/A
2011
89
86
N/A
N/A
N/A
N/A
28.1
28.0
N/A
N/A
N/A
N/A
8.9
N/A
N/A
N/A
2010
90
96
N/A
N/A
N/A
N/A
30.5
27.4
N/A
N/A
N/A
N/A
9.1
N/A
N/A
N/A
2009
61
67
N/A
N/A
N/A
N/A
28.7
25.5
N/A
N/A
N/A
N/A
N/A
N/A
N/A
N/A
2008
65
85
N/A
N/A
N/A
N/A
31.2
25.5
N/A
N/A
N/A
N/A
N/A
N/A
1.8
N/A
2007
80
100
N/A
N/A
N/A
N/A
30.8
28.1
N/A
N/A
N/A
N/A
N/A
N/A
2.8
N/A
2006
75
100
N/A
N/A
N/A
N/A
30.0
29.8
N/A
N/A
23.7
N/A
N/A
N/A
3.3
N/A
2005
87
69
N/A
N/A
N/A
N/A
29.6
27.5
N/A
N/A
27.5
N/A
N/A
N/A
4.1
0.9
2004
77
72
N/A
N/A
N/A
N/A
27.8
27.1
N/A
N/A
24.6
N/A
N/A
N/A
4.4
1.1
2003
91
74
N/A
0.33
N/A
N/A
26.4
25.7
0.003
N/A
23.9
N/A
N/A
N/A
4.1
1.9
2002
93
68
N/A
N/A
N/A
N/A
31.3
26.0
N/A
N/A
25.7
N/A
N/A
N/A
4.1
0.6
2001
84
84
N/A
N/A
N/A
N/A
29.2
26.2
N/A
N/A
25.9
N/A
N/A
N/A
3.5
N/A
2000
57
111
N/A
N/A
N/A
N/A
N/A
30.6
N/A
N/A
23.5
N/A
N/A
N/A
3.7
1.1
Natural disasters
Type
Columbus
Mobile
Tornado activity compared to U.S. average
119.1%
130.1%
Earthquake activity compared to U.S. average
96.1%
42.8%
Natural disasters compared to U.S. average
16%
31%
Transportation
Columbus boasts an efficient public transit system with buses serving most areas and bike-sharing services for short commutes. Mobile, while having a public transit system, is more car-dependent. For commuters, Columbus offers shorter travel times due to a good network of roads and less congestion than Mobile.
Transport
Type
Columbus
Mobile
Amtrak stations
1
1
Amtrak stations nearby
1
1
FAA registered aircraft
415
155
FAA registered aircraft manufacturers and dealers
4
15
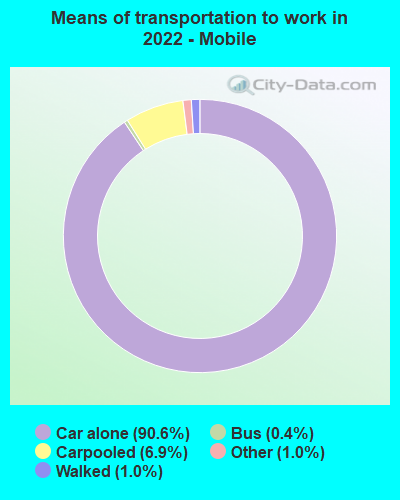
Means of transportation to work
Type
Columbus
Mobile
Bicycle
0.6%
0%
Bus
1.6%
0.5%
Carpooled
7.4%
6.7%
Car alone
86.7%
91%
Taxicab
0.1%
0%
Walked
2.2%
0.9%
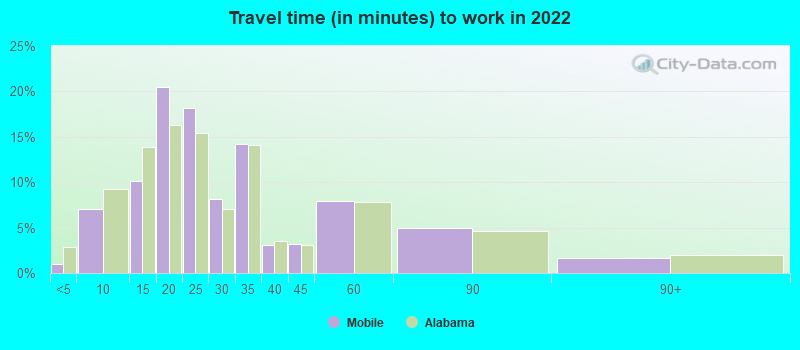
Average travel time to work
Type
Columbus
Mobile
Average
26.1 min
26.7 min
Other means
21.7 min
22.2 min
Public transportation
35.4 min
42.5 min
Private vehicle occupancy
Type
Columbus
Mobile
Average
1.1
1.1
Drove alone
90.7%
91.4%
In 2 person carpool
7.3%
6.7%
In 3 person carpool
1.4%
0.8%
In 4 person carpool
0.5%
0.8%
In 5-6 person carpool
0.1%
0.1%
In 7+ person carpool
0.1%
0.2%
How many people usually rode to work in the car, truck or van.
Real Estate
Columbus's growing economy and population have driven up real estate prices, making it more expensive compared to Mobile. However, it's offset by the city's high pay scales. Mobile's real estate market provides an affordable option for homebuyers and renters alike, especially those seeking proximity to the Gulf Coast.
Neighborhoods
Columbus neighborhoods range from the energetic and youth-centric like Short North to quiet, family-oriented locales like Clintonville. Mobile presents a mix of historic districts like the Church Street East neighborhood, midtown charm in Oakleigh, and modern development in West Mobile, each catering to different lifestyle needs.
Houses and residents
Type
Columbus
Mobile
Houses
422,120
88,507
Average household size (people)
2.3
2.4
Median year apartment built
1982
1977
Median year house/condo built
1977
1972
Length of stay in the house since moving in
12.6 years
15.4 years
Houses occupied
390,605 (92.5%)
77,991 (88.1%)
Houses occupied by owners
175,427 (44.9%)
41,443 (53.1%)
Houses occupied by renters
215,178 (55.1%)
36,548 (46.9%)
Median rent asked for vacant for-rent units
$1,371
$503.72
Median monthly housing costs
$1,110
$905
Median price asked for vacant for-sale houses and condos
$195,022
$139,357
Estimated median house or condo value
$219,200
$158,200
Median numbers of rooms
5
5.7
Median number of rooms in apartments
4.2
4.6
Median number of rooms in houses and condos
6.3
6.8
Median house price - detached houses
$233,452
$207,085
Median house price - in 2-unit structures
$121,729
$45,114
Median house price - in 3-to-4-unit structures
$215,337
$220,201
Median house price - in 5 or more unit structures
$240,711
$224,513
Median house price - mobile homes
$121,578
$98,232
Median house price - Townhouses or other attached units
$218,726
$226,950
Median house price - All housing units
$229,736
$206,375
Median house age
42
48
Renting percentage
53%
43.6%
Housing density (houses/condos per square mile)
2,007.5
750.7
House value disparities
30.2%
42.6%
Household income disparities
42.4%
48.9%
Median household income for houses/condes with a mortgage
$89,058
$68,706
Median household income for apartments without a mortgage
$59,295
$51,029
Housing units without a mortgage
4,290 (3.3%)
944 (3.9%)
Housing units with both a second mortgage and home equity loan
10,651 (8.2%)
1,217 (5%)
Housing units with a mortgage
125,487 (96.7%)
23,333 (96.1%)
Housing units with a home equity loan
775 (0.6%)
0 (0%)
Housing units with a second mortgage
13,558 (10.4%)
1,542 (6.4%)
House/condo owner moved in on average (years ago)
10
15
House/condo renter moved in on average (years ago)
1
1
Housing units lacking complete kitchen facilities
1.6%
5.9%
Housing units lacking complete plumbing facilities
1.3%
4.8%
Housing units in structures
Housing units in structures
Columbus
Mobile
One, detached
45.8%
68.1%
One, attached
9.1%
1.7%
Two
4.0%
2.6%
3 or 4
8.6%
2.6%
5 to 9
11.8%
7.7%
10 to 19
8.6%
8.7%
20 to 49
4.5%
3.8%
50 or more
6.8%
3.4%
Mobile homes
0.8%
1.3%
Boats, RVs, vans, etc.
0.1%
0.0%
Median real estate property taxes paid for housing units
Self-employed workers in own not incorporated business
20,915
4,678
State government workers
31,881
5,996
Unpaid family workers
724
0
Industries and Occupations
Columbus enjoys a diversified industry presence, with a robust balance of educational, government, and private sector jobs. In contrast, Mobile's economy leans more towards shipbuilding, with Austal USA, an Australian shipbuilder, being a significant employer. Other popular industries in Mobile include aerospace and oil production.
Columbus provides high-quality healthcare services, boasting some of the nation's best hospitals including the Wexner Medical Center and Nationwide Children's Hospital. Mobile's healthcare is reliable, with significant institutions like the University of South Alabama Children's & Women's Hospital providing care.
Health (county statistics)
Type
Columbus
Mobile
General health status score of residents in this county from 1 (poor) to 5 (excellent)
Columbus offers modern and well-maintained infrastructure, and a large international airport serves the city. Mobile's infrastructure is older, but ongoing renovations and the presence of a port and an airport ensure well-connected logistics. For tourists, getting around and accessing facilities proves convenient in both cities.
Infrastructure
Type
Columbus
Mobile
Hospitals
47
14
TV stations
14
15
Arenas or stadiums
3
3
Bank branches located here
200
97
Bank institutions located here
25
20
Main business address for public companies
23
3
Drinking water stations with no reported violations in the past
17
0
Drinking water stations with reported violations in the past
HMDA - Conventional home purchase loans - Applications denied
Year
Columbus
Mobile
1999
2,450
1,147
2000
2,376
806
2001
1,897
462
2002
1,483
340
2003
2,087
392
2004
3,216
625
2005
4,275
817
2006
4,662
903
2007
2,679
550
2008
1,015
269
2009
555
120
Culture and Food
Columbus's diverse population contributes to a vibrant cultural and food scene, with festivals, live music, arts, and a myriad of restaurants. Mobile, the birthplace of Mardi Gras, is similarly rich in Southern charm and tradition, and seafood lovers will delight in the local Gulf Coast cuisine.
Sports Teams
Sports lovers will appreciate Columbus for its devotion to its pro and college teams, including the Buckeyes (college football) and Blue Jackets (professional hockey). Mobile lacks major professional teams, but the local love for college football, particularly for the Alabama Crimson Tide, runs deep.


 Columbus, OH
 Mobile, AL