Columbus, Ohio, and Newark, New Jersey, present different scopes for residents and tourists alike. From varying climates to diverse economy sectors, both cities provide unique lifestyles and experiences. This comprehensive comparison will help you understand the contrasts and commonalities between these two cities, providing invaluable insights for relocation or travel decisions.
Distance between
Columbus, OH and
Newark, NJ : 466.3 miles
Columbus's population is larger by 195%. Its population has grown by 195,058 people (27.4%) since 2000. The population of Newark has grown by 33,674 people (12.3%) during that time.
When it comes to safety, Columbus generally fares better than Newark. While both cities experience crime, Newark has a higher crime rate compared to the national average. Therefore, Columbus could be perceived as a safer option. Nevertheless, crime rates can vary significantly within different neighborhoods in both cities.
City-data.com crime index counts serious crimes and violent crime more heavily. It adjusts for the number of visitors and daily workers commuting into cities. (higher means more crime, U.S. average = 301.1)
City-data.com crime index counts serious crimes and violent crime more heavily. It adjusts for the number of visitors and daily workers commuting into cities. (higher means more crime, U.S. average = 301.1)
Sex Offenders
According to our data, there are 1,505 registered sex offenders living in Columbus and 560 registered sex offenders living in . The ratio of residents to sex offenders in Columbus is 573 to 1; the ratio in Newark is 503 to 1. The number of registered sex offenders compared to the number of residents in Columbus is near to than in Newark.
Cost of Living
Living in Columbus is generally less expensive than in Newark. This difference is most notable in housing costs. Columbus offers more affordable housing options compared to Newark, making it a cost-effective choice for relocation.
Income Tax
There's a difference here too, with Newark, New Jersey's state income tax rate peaking at 10.75% for the highest earners, and Columbus, Ohio capping their state income tax at 4.797%.
Property Tax
Newark’s property tax is higher than Columbus’s. The average effective property tax in Essex County (where Newark is located) is 2.13%, whereas in Franklin County (Columbus' location), it's 1.75%.
Sales Tax
There's a considerable difference in the sales tax in Ohio (5.75%) and New Jersey (6.625%). While this might not significantly impact tourists, it could influence the budgets of those considering relocation.
Income
Type
Columbus
Newark
Estimated median household income
$58,202
$43,242
Estimated per capita income
$32,392
$23,767
Cost of living index (U.S. average is 100)
96.1
118.1
If you make $50,000 in Columbus, you will have to make $61,446 in Newark to maintain the same standard of living.
Geographical Conditions
Columbus is characterized by a flat topography while Newark, situated on Newark Bay, characterizes a coastal ecosystem. Newark's proximity to the coast can result in occasional hurricanes and coastal storms.
Both cities offer a range of educational opportunities. Newark has the renowned Rutgers University while Columbus is home to Ohio State University, one of the largest globally. Public schools in Columbus are considered better than those in Newark, a factor to consider when relocating with children.
Columbus offers a robust economy with steady job growth, especially in sectors like technology, healthcare, and education. On the other hand, Newark offers opportunities in healthcare, education, and transportation. Their populations and proximity to other major cities influence the economic dynamics of these cities.
Biggest Employers
In Columbus, Ohio State University, Nationwide Insurance, and Wexner Medical Center are some of the biggest employers. In Newark, top employers include Rutgers University, Amazon, and Newark Beth Israel Medical Center.
There were 913 building permits issued in Columbus in 2012 (246 more than in 2011) compared to 1 building permits issued in Newark in 2012.
In Columbus (Franklin County), 60.8% voted for Democrats and 37.9% for Republicans in 2012 Presidential Election. In Newark (Essex County), 78.3% voted for Democrats and 21.4% for Republicans.
Elections
Type
Democrats
Republicans
Other
Year
Columbus
Newark
Columbus
Newark
Columbus
Newark
2020
64.7%
77.4%
33.4%
21.9%
1.9%
0.7%
2016
59.8%
77.2%
33.9%
20.2%
6.2%
2.6%
2012
60.8%
78.3%
37.9%
21.4%
1.3%
0.3%
2008
59.8%
76.2%
39.0%
23.5%
1.2%
0.3%
2004
54.5%
70.7%
45.2%
28.9%
0.3%
0.4%
2000
48.9%
71.9%
47.9%
25.9%
3.2%
2.2%
1996
48.1%
69.0%
44.5%
25.6%
7.3%
5.4%
Breakdown of population affiliated with a religious congregation
Type
Adherents
Congregations
Religion
Columbus
Newark
Columbus
Newark
CATHOLIC CHURCH
13.2%
33.4%
5.6%
10.7%
EVANGELICAL LUTHERAN CHURCH IN AMERICA
1.6%
0.1%
3.7%
1.0%
SOUTHERN BAPTIST CONVENTION
1.6%
0.3%
6.8%
2.6%
MUSLIM ESTIMATE
1.3%
3.0%
1.9%
2.8%
VINEYARD USA
1.3%
0.0%
1.2%
0.0%
AMERICAN BAPTIST CHURCHES IN THE USA
1.0%
2.1%
3.3%
8.2%
EPISCOPAL CHURCH
0.4%
0.9%
1.3%
3.6%
SEVENTH DAY ADVENTIST CHURCH
0.4%
0.8%
2.0%
2.8%
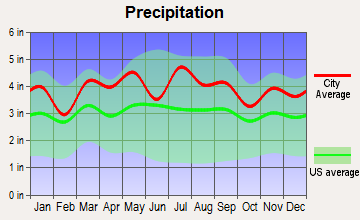
Weather
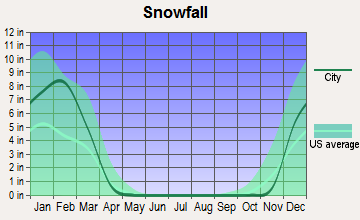
Both Columbus and Newark experience cold winters and hot summers. However, Columbus's winters can be more severe with heavier snowfall, whereas Newark typically experiences milder, wetter winters due to its coastal location.
Weather and climate
Type
Columbus
Newark
Temperature - Average
52.8°F
54°F
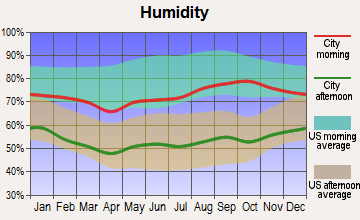
Humidity - Average morning or afternoon humidity
74.8%
67.3%
Humidity - Differences between morning and afternoon humidity
34%
30%
Humidity - Maximum monthly morning or afternoon humidity
86%
77%
Humidity - Minimum monthly morning or afternoon humidity
52%
47%
Precipitation - Yearly average
39.3 in
47 in
Snowfall - Yearly average
56.6 in
60.3 in
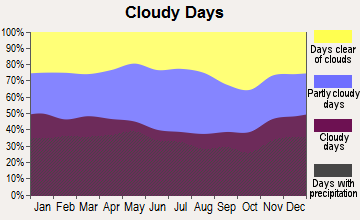
Clouds - Number of days clear of clouds
12%
15.7%
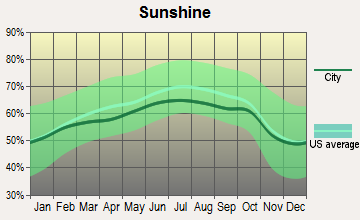
Sunshine amount - Average
49.7%
60.2%
Sunshine amount - Differences during a year
27%
20%
Sunshine amount - Maximum monthly
55%
64%
Sunshine amount - Minimum monthly
28%
44%
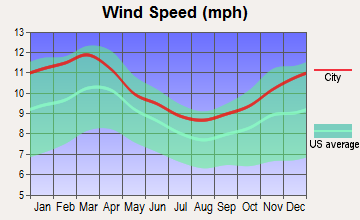
Wind speed - Average
8.2 mph
10.6 mph
Average climate in Columbus, Ohio
Average climate in Newark, New Jersey
Air pollution
Type
AQI
CO
NO2
OZONE
PB
PM10
PM25
SO2
Year
Columbus
Newark
Columbus
Newark
Columbus
Newark
Columbus
Newark
Newark
Columbus
Newark
Columbus
Newark
Columbus
Newark
2018
69
95
0.11
0.30
10.0
14.4
33.8
23.4
N/A
N/A
N/A
N/A
6.0
8.7
0.0
0.2
2017
68
99
0.16
0.30
9.6
15.1
28.7
22.7
N/A
N/A
N/A
N/A
5.5
8.7
0.1
0.2
2016
76
95
0.17
0.31
10.6
15.5
28.5
23.6
N/A
N/A
N/A
N/A
5.6
8.8
0.1
0.3
2015
74
100
0.16
0.33
11.3
16.7
27.0
23.2
N/A
N/A
N/A
N/A
6.1
8.7
0.1
0.5
2014
82
95
0.20
0.33
11.0
18.8
28.5
23.5
N/A
N/A
N/A
N/A
7.4
8.2
0.5
0.8
2013
78
97
N/A
0.35
8.9
18.3
29.6
23.5
N/A
N/A
N/A
N/A
7.8
9.1
0.6
0.8
2012
87
99
N/A
0.33
N/A
18.5
32.9
23.5
N/A
N/A
N/A
N/A
8.9
9.2
N/A
1.1
2011
89
108
N/A
0.36
N/A
21.2
28.1
22.7
N/A
N/A
N/A
N/A
8.9
8.5
N/A
2.0
2010
90
114
N/A
0.33
N/A
19.4
30.5
26.3
N/A
N/A
N/A
N/A
9.1
8.2
N/A
1.9
2009
61
104
N/A
0.38
N/A
21.6
28.7
19.6
N/A
N/A
N/A
N/A
N/A
9.8
N/A
2.3
2008
65
111
N/A
0.46
N/A
22.4
31.2
21.8
0.013
N/A
N/A
N/A
N/A
12.4
1.8
3.4
2007
80
123
N/A
0.51
N/A
23.5
30.8
22.3
0.016
N/A
N/A
N/A
N/A
12.7
2.8
4.3
2006
75
116
N/A
0.64
N/A
24.6
30.0
21.5
0.018
N/A
23.7
N/A
N/A
12.9
3.3
5.3
2005
87
113
N/A
0.78
N/A
26.1
29.6
20.5
N/A
N/A
27.5
N/A
N/A
N/A
4.1
7.2
2004
77
108
N/A
0.79
N/A
25.4
27.8
19.5
0.030
N/A
24.6
N/A
N/A
N/A
4.4
6.8
2003
91
108
N/A
0.76
N/A
26.1
26.4
18.1
0.013
N/A
23.9
26.9
N/A
N/A
4.1
6.0
2002
93
124
N/A
0.65
N/A
28.5
31.3
18.3
0.008
N/A
25.7
26.1
N/A
N/A
4.1
3.8
2001
84
125
N/A
0.79
N/A
30.1
29.2
21.2
0.020
N/A
25.9
26.7
N/A
N/A
3.5
6.2
2000
57
116
N/A
1.02
N/A
31.2
N/A
20.0
0.022
N/A
23.5
22.2
N/A
N/A
3.7
6.7
Natural disasters
Type
Columbus
Newark
Tornado activity compared to U.S. average
119.1%
64.1%
Earthquake activity compared to U.S. average
96.1%
31.6%
Natural disasters compared to U.S. average
16%
30%
Transportation
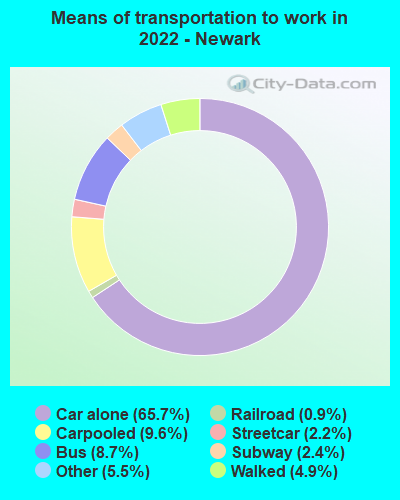
Public transportation is more comprehensive and widely used in Newark, with extensive bus and train systems, including easy access to New York City. Columbus's public transportation includes buses, with the city's layout more suited for car users.
Transport
Type
Columbus
Newark
Amtrak stations
1
2
Amtrak stations nearby
1
3
FAA registered aircraft
415
20
FAA registered aircraft manufacturers and dealers
4
0
Means of transportation to work
Type
Columbus
Newark
Bicycle
0.6%
0.2%
Bus
1.6%
6.8%
Carpooled
7.4%
9.2%
Car alone
86.7%
69.3%
Railroad
0%
0.2%
Streetcar
0%
0.9%
Subway
0%
1.2%
Taxicab
0.1%
0.7%
Walked
2.2%
3.5%
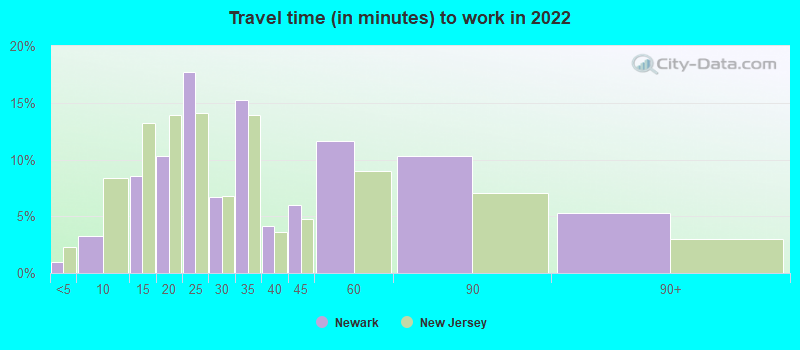
Average travel time to work
Type
Columbus
Newark
Average
26.1 min
33.2 min
Other means
21.7 min
28 min
Public transportation
35.4 min
45.1 min
Private vehicle occupancy
Type
Columbus
Newark
Average
1.1
1.2
Drove alone
90.7%
81.7%
In 2 person carpool
7.3%
14.8%
In 3 person carpool
1.4%
2.4%
In 4 person carpool
0.5%
0.6%
In 7+ person carpool
0.1%
0.4%
How many people usually rode to work in the car, truck or van.
Real Estate
Real estate in Columbus is generally less expensive than in Newark. Once again, this presents Columbus as a more affordable option for those considering relocating or investing in property.
Neighborhoods
Both cities offer a mix of vibrant, bustling neighborhoods and quieter, residential areas. From the Short North Arts District in Columbus to the Ironbound district in Newark, there's a neighborhood to fit different lifestyle needs.
Houses and residents
Type
Columbus
Newark
Houses
422,120
122,145
Average household size (people)
2.3
2.8
Median year apartment built
1982
1967
Median year house/condo built
1977
1960
Length of stay in the house since moving in
12.6 years
17.1 years
Houses occupied
390,605 (92.5%)
115,145 (94.3%)
Houses occupied by owners
175,427 (44.9%)
24,002 (20.8%)
Houses occupied by renters
215,178 (55.1%)
91,143 (79.2%)
Median rent asked for vacant for-rent units
$1,371
$408.22
Median monthly housing costs
$1,110
$1,277
Median price asked for vacant for-sale houses and condos
$195,022
$153,754
Estimated median house or condo value
$219,200
$323,200
Median numbers of rooms
5
4.5
Median number of rooms in apartments
4.2
4.2
Median number of rooms in houses and condos
6.3
5.7
Median house price - detached houses
$233,452
$321,688
Median house price - in 2-unit structures
$121,729
$347,644
Median house price - in 3-to-4-unit structures
$215,337
$337,992
Median house price - in 5 or more unit structures
$240,711
$210,604
Median house price - mobile homes
$121,578
$129,070
Median house price - Townhouses or other attached units
$218,726
$224,107
Median house price - All housing units
$229,736
$325,388
Median house age
42
55
Renting percentage
53%
77.9%
Housing density (houses/condos per square mile)
2,007.5
5,132.8
House value disparities
30.2%
31.5%
Household income disparities
42.4%
47.8%
Median household income for houses/condes with a mortgage
$89,058
$71,676
Median household income for apartments without a mortgage
$59,295
$62,906
Housing units without a mortgage
4,290 (3.3%)
459 (2.7%)
Housing units with both a second mortgage and home equity loan
10,651 (8.2%)
647 (3.8%)
Housing units with a mortgage
125,487 (96.7%)
16,603 (97.3%)
Housing units with a home equity loan
775 (0.6%)
0 (0%)
Housing units with a second mortgage
13,558 (10.4%)
769 (4.5%)
House/condo owner moved in on average (years ago)
10
18
House/condo renter moved in on average (years ago)
1
5
Housing units lacking complete kitchen facilities
1.6%
2.3%
Housing units lacking complete plumbing facilities
1.3%
1%
Housing units in structures
Housing units in structures
Columbus
Newark
One, detached
45.8%
10.7%
One, attached
9.1%
11.4%
Two
4.0%
19.5%
3 or 4
8.6%
21.1%
5 to 9
11.8%
8.2%
10 to 19
8.6%
6.0%
20 to 49
4.5%
6.5%
50 or more
6.8%
15.8%
Mobile homes
0.8%
0.9%
Boats, RVs, vans, etc.
0.1%
0.1%
Median real estate property taxes paid for housing units
Self-employed workers in own not incorporated business
20,915
7,752
State government workers
31,881
5,591
Unpaid family workers
724
121
Industries and Occupations
While both cities thrive on healthcare and education sectors, Columbus has a burgeoning technology industry, and Newark exhibits a vibrant shipping and transportation industry. These different industry focuses provide a variety of occupational opportunities.
Access to quality healthcare is commendable in both cities. Columbus has the Wexner Medical Center, and Newark is home to the University Hospital. Quality healthcare available in both cities can contribute to the decision-making process of potential residents.
Health (county statistics)
Type
Columbus
Newark
General health status score of residents in this county from 1 (poor) to 5 (excellent)
Both cities boast modern infrastructures with continual investments in updates and improvements. Columbus has been focusing on urban regeneration, while Newark's significant infrastructural development is evident due to hosting a major airport, seaport, and railway systems.
Infrastructure
Type
Columbus
Newark
Hospitals
47
8
TV stations
14
31
Bank branches located here
200
69
Bank institutions located here
25
19
Main business address for public companies
23
15
Drinking water stations with no reported violations in the past
17
0
Drinking water stations with reported violations in the past
HMDA - Conventional home purchase loans - Applications denied
Year
Columbus
Newark
1999
2,450
429
2000
2,376
515
2001
1,897
536
2002
1,483
547
2003
2,087
740
2004
3,216
1,167
2005
4,275
2,198
2006
4,662
3,193
2007
2,679
2,300
2008
1,015
508
2009
555
182
Culture and Food
Both cities offer a diverse culinary scene. Columbus is known for its Midwestern charm mixed with innovative culinary trends, while Newark represents East Coast tradition with incredible Portuguese and Brazilian cuisine. The cultural highlights of both cities provide a range of museums, arts venues, and community events.
Sports Teams
Sports lovers also have plenty to choose from. In Columbus, you’ll find dedicated fans of the Ohio State University Buckeyes, the Columbus Crew SC (MLS), and the Blue Jackets (NHL). On the other hand, while Newark doesn’t have its own professional teams, it hosts the New Jersey Devils (NHL) and is in proximity to New York City's array of teams.


 Columbus, OH
 Newark, NJ