Columbus, OH, and Oakland, CA, are vibrant and unique cities each offering a diverse set of opportunities and experiences. Columbus, often considered a "big small town," is known for its affordable cost of living, educational institutions, and friendly Midwestern charm. On the other hand, Oakland, located in the San Francisco Bay Area, is a cultural melting pot known for its Mediterranean climate, thriving arts scene, and multicultural diversity. Both cities have strong economies, yet they differ greatly in their affordability, weather patterns, tax structures, and lifestyle.
Distance between
Columbus, OH and
Oakland, CA : 2,098.3 miles
Columbus's population is larger by 109%. Its population has grown by 195,058 people (27.4%) since 2000. The population of Oakland has grown by 34,339 people (8.6%) during that time.
Crime rates in both cities vary by neighborhood, as in any large urban area. Oakland has a higher overall crime rate compared to Columbus, with certain areas in Oakland experiencing significant challenges related to crime. However, Oakland is also home to many safe neighborhoods. Columbus, while experiencing crime in certain pockets, generally has lower crime rates compared to national averages. As always, individuals should research specific neighborhoods prior to visiting or moving.
City-data.com crime index counts serious crimes and violent crime more heavily. It adjusts for the number of visitors and daily workers commuting into cities. (higher means more crime, U.S. average = 301.1)
City-data.com crime index counts serious crimes and violent crime more heavily. It adjusts for the number of visitors and daily workers commuting into cities. (higher means more crime, U.S. average = 301.1)
Sex Offenders
According to our data, there are 1,506 registered sex offenders living in Columbus and 916 registered sex offenders living in . The ratio of residents to sex offenders in Columbus is 573 to 1; the ratio in Oakland is 459 to 1. The number of registered sex offenders compared to the number of residents in Columbus is near to than in Oakland.
Cost of Living
The cost of living in Oakland is significantly higher than in Columbus. Housing, groceries, transportation, and healthcare cost more in Oakland due to its location within the expensive San Francisco Bay Area. Columbus, on the other hand, ranks below the national average for cost of living, making it an attractive option for people seeking an affordable urban lifestyle.
Income Tax
On income tax, California rates are progressive, and can be quite high for high-income earners. Ohio also has a progressive income tax system, but the rates are generally lower. Additionally, Columbus levies a 2.5% income tax on residents and individuals working in the city.
Property Tax
Property taxes in Oakland are higher than in Columbus, reflecting the costlier real estate market. The median real estate tax in Alameda County, where Oakland is located, is higher than Franklin County, where Columbus is situated.
Sales Tax
Ohio’s state sales tax rate is 5.75%, while Columbus tacks on an additional 2.5%, resulting in a total rate of 7.5%. California’s state sales tax is 7.25%, but Oakland adds another 2.75%, making the total sales tax rate in Oakland 9.25%.
Income
Type
Columbus
Oakland
Estimated median household income
$58,202
$82,236
Estimated per capita income
$32,392
$49,966
Cost of living index (U.S. average is 100)
96.1
126.7
If you make $50,000 in Columbus, you will have to make $65,921 in Oakland to maintain the same standard of living.
Geographical Conditions
Columbus is flat, characterized by a mix of urban and suburban landscapes. Oakland is more geographically varied, with hills, a coastline, and proximity to both mountains and deserts, offering more outdoor adventure opportunities.
Both cities have strong educational infrastructures. Columbus is home to The Ohio State University, one of the largest universities in the US, and several other institutions offering a variety of educational opportunities. Oakland, part of the University of California system with nearby UC Berkeley, has a great educational environment paired with cultural diversity.
Columbus has a diversified economy with a broad base in education, government, insurance, banking, fashion, defense, aviation, food, logistics, steel, energy, medical research, health care, hospitality, retail, and technology. On the other hand, Oakland's economy is driven by sectors like technology, health care, and services, with a growing emphasis on green jobs due to its location in the environmentally-conscious Bay Area.
Biggest Employers
The largest employers in Columbus are Ohio State University, the State of Ohio, and Nationwide Mutual Insurance Company. In Oakland, the top employers are Kaiser Permanente, Oakland Unified School District, and the City of Oakland.
There were 913 building permits issued in Columbus in 2012 (246 more than in 2011) compared to 114 building permits issued in Oakland in 2012 (73 more than in 2011).
In Columbus (Franklin County), 60.8% voted for Democrats and 37.9% for Republicans in 2012 Presidential Election. In Oakland (Alameda County), 78.9% voted for Democrats and 18.2% for Republicans.
Elections
Type
Democrats
Republicans
Other
Year
Columbus
Oakland
Columbus
Oakland
Columbus
Oakland
2020
64.7%
79.8%
33.4%
17.6%
1.9%
2.6%
2016
59.8%
78.2%
33.9%
14.6%
6.2%
7.2%
2012
60.8%
78.9%
37.9%
18.2%
1.3%
3.0%
2008
59.8%
78.8%
39.0%
19.3%
1.2%
2.0%
2004
54.5%
75.5%
45.2%
23.4%
0.3%
1.1%
2000
48.9%
69.6%
47.9%
24.2%
3.2%
6.2%
1996
48.1%
65.8%
44.5%
23.1%
7.3%
11.2%
Breakdown of population affiliated with a religious congregation
Type
Adherents
Congregations
Religion
Columbus
Oakland
Columbus
Oakland
CATHOLIC CHURCH
13.2%
15.3%
5.6%
4.9%
EVANGELICAL LUTHERAN CHURCH IN AMERICA
1.6%
0.3%
3.7%
2.3%
SOUTHERN BAPTIST CONVENTION
1.6%
1.5%
6.8%
10.9%
MUSLIM ESTIMATE
1.3%
2.0%
1.9%
2.5%
VINEYARD USA
1.3%
0.0%
1.2%
0.1%
AMERICAN BAPTIST CHURCHES IN THE USA
1.0%
0.5%
3.3%
2.5%
EPISCOPAL CHURCH
0.4%
0.3%
1.3%
1.7%
SEVENTH DAY ADVENTIST CHURCH
0.4%
0.3%
2.0%
1.4%
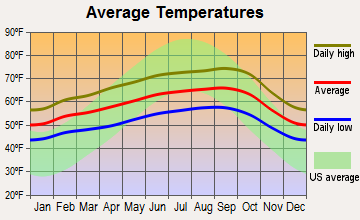
Weather
Oakland, CA enjoys a Mediterranean climate with mild, wet winters and warm, dry summers, making it a destination for those averse to harsh weather conditions. Conversely, Columbus, OH experiences a humid continental climate, characterized by hot, muggy summers and cold, dry winters. It's crucial for people considering relocating or visiting to take their weather preferences into account.
Weather and climate
Type
Columbus
Oakland
Temperature - Average
52.8°F
59.1°F
Humidity - Average morning or afternoon humidity
74.8%
84.2%
Humidity - Differences between morning and afternoon humidity
34%
29%
Humidity - Maximum monthly morning or afternoon humidity
86%
90.9%
Humidity - Minimum monthly morning or afternoon humidity
52%
61.9%
Precipitation - Yearly average
39.3 in
23.5 in
Snowfall - Yearly average
56.6 in
0 in
Clouds - Number of days clear of clouds
12%
26.9%
Sunshine amount - Average
49.7%
73%
Sunshine amount - Differences during a year
27%
22%
Sunshine amount - Maximum monthly
55%
77%
Sunshine amount - Minimum monthly
28%
55%
Wind speed - Average
8.2 mph
11.4 mph
Average climate in Columbus, Ohio
Average climate in Oakland, California
Air pollution
Type
AQI
CO
NO2
OZONE
PB
PM10
PM25
SO2
Year
Columbus
Oakland
Columbus
Oakland
Columbus
Oakland
Columbus
Oakland
Oakland
Columbus
Columbus
Oakland
Columbus
Oakland
2018
69
105
0.11
0.46
10.0
13.0
33.8
20.9
0.012
N/A
N/A
N/A
6.0
13.7
0.0
0.4
2017
68
100
0.16
0.48
9.6
13.5
28.7
21.2
0.008
N/A
N/A
N/A
5.5
11.3
0.1
0.5
2016
76
80
0.17
0.41
10.6
12.9
28.5
20.3
0.005
N/A
N/A
N/A
5.6
7.9
0.1
0.9
2015
74
93
0.16
0.43
11.3
14.5
27.0
20.6
0.004
N/A
N/A
N/A
6.1
9.5
0.1
0.8
2014
82
90
0.20
0.42
11.0
14.7
28.5
20.6
0.005
N/A
N/A
N/A
7.4
9.1
0.5
0.5
2013
78
89
N/A
0.39
8.9
15.2
29.6
18.0
0.004
N/A
N/A
N/A
7.8
11.6
0.6
0.5
2012
87
87
N/A
0.38
N/A
13.7
32.9
18.7
0.003
N/A
N/A
N/A
8.9
8.5
N/A
0.7
2011
89
94
N/A
0.32
N/A
14.4
28.1
18.5
0.003
N/A
N/A
N/A
8.9
10.1
N/A
1.1
2010
90
90
N/A
0.21
N/A
14.4
30.5
19.4
0.013
N/A
N/A
N/A
9.1
8.4
N/A
1.0
2009
61
99
N/A
0.22
N/A
15.2
28.7
19.0
0.006
N/A
N/A
N/A
N/A
11.3
N/A
1.3
2008
65
110
N/A
0.29
N/A
15.1
31.2
20.1
0.006
N/A
N/A
N/A
N/A
12.4
1.8
1.0
2007
80
100
N/A
0.41
N/A
13.4
30.8
21.3
0.006
N/A
N/A
N/A
N/A
9.5
2.8
1.1
2006
75
106
N/A
0.47
N/A
13.8
30.0
22.6
N/A
N/A
23.7
N/A
N/A
9.4
3.3
1.3
2005
87
97
N/A
0.56
N/A
13.3
29.6
15.3
N/A
N/A
27.5
N/A
N/A
9.6
4.1
1.4
2004
77
107
N/A
0.51
N/A
14.3
27.8
15.3
0.004
N/A
24.6
N/A
N/A
11.3
4.4
1.8
2003
91
82
N/A
0.63
N/A
16.1
26.4
15.8
N/A
N/A
23.9
N/A
N/A
N/A
4.1
1.7
2002
93
81
N/A
0.69
N/A
18.8
31.3
16.7
0.008
N/A
25.7
N/A
N/A
N/A
4.1
1.6
2001
84
87
N/A
0.70
N/A
17.2
29.2
12.7
0.008
N/A
25.9
N/A
N/A
N/A
3.5
1.5
2000
57
78
N/A
0.84
N/A
17.1
N/A
11.8
0.012
N/A
23.5
N/A
N/A
N/A
3.7
1.8
Natural disasters
Type
Columbus
Oakland
Tornado activity compared to U.S. average
119.1%
8.8%
Earthquake activity compared to U.S. average
96.1%
7,647.7%
Natural disasters compared to U.S. average
16%
20%
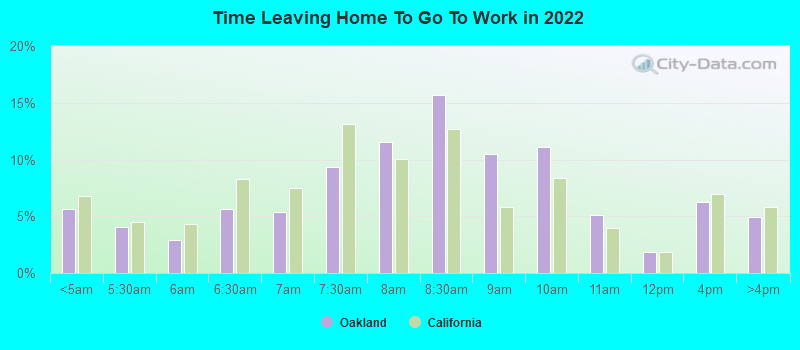
Transportation
Both cities have robust public transportation systems. Columbus has COTA, which operates the public bus system, while Oakland is served by BART, AC Transit buses, and the San Francisco Bay Ferry. Traffic in Oakland is typically heavier than in Columbus, and commuting times can be longer, particularly for those commuting to other parts of the Bay Area.
Transport
Type
Columbus
Oakland
Amtrak stations
1
1
Amtrak stations nearby
1
3
FAA registered aircraft
415
154
FAA registered aircraft manufacturers and dealers
4
2
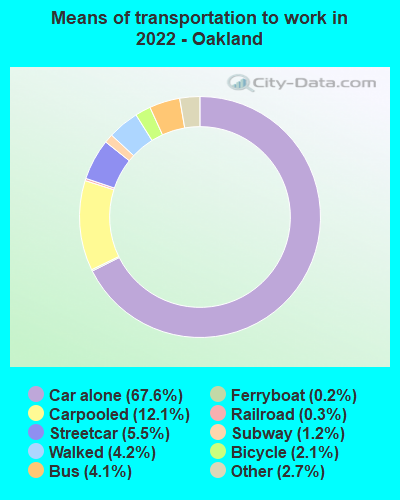
Means of transportation to work
Type
Columbus
Oakland
Bicycle
0.6%
1%
Bus
1.6%
3.2%
Carpooled
7.4%
12.6%
Car alone
86.7%
72.2%
Ferryboat
0%
0.1%
Motorcycle
0%
0.4%
Streetcar
0%
2.3%
Subway
0%
0.5%
Taxicab
0.1%
0.1%
Walked
2.2%
5.5%
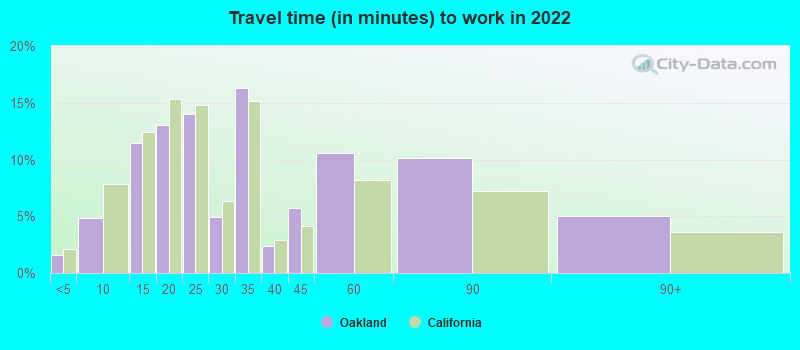
Average travel time to work
Type
Columbus
Oakland
Average
26.1 min
33.6 min
Other means
21.7 min
29 min
Public transportation
35.4 min
45.3 min
Private vehicle occupancy
Type
Columbus
Oakland
Average
1.1
1.2
Drove alone
90.7%
88.1%
In 2 person carpool
7.3%
9.2%
In 3 person carpool
1.4%
2%
In 4 person carpool
0.5%
0.6%
How many people usually rode to work in the car, truck or van.
Real Estate
Real estate in Columbus is, on average, more affordable than in Oakland. Median home prices in Oakland are significantly higher due to its proximity to San Francisco, making it one of the most expensive real estate markets in the country. However, both cities have a variety of rental and purchasing options, catering to different income groups and preferences.
Neighborhoods
Columbus has a variety of family-friendly neighborhoods like German Village, Clintonville, and Upper Arlington. Oakland has numerous diverse neighborhoods like Rockridge, Montclair, and Lake Merritt, each boasting a unique character, history, and cultural identity.
Houses and residents
Type
Columbus
Oakland
Houses
422,120
186,660
Average household size (people)
2.3
2.5
Median year apartment built
1982
1958
Median year house/condo built
1977
1943
Length of stay in the house since moving in
12.6 years
15.4 years
Houses occupied
390,605 (92.5%)
170,366 (91.3%)
Houses occupied by owners
175,427 (44.9%)
72,661 (42.7%)
Houses occupied by renters
215,178 (55.1%)
97,705 (57.4%)
Median rent asked for vacant for-rent units
$1,371
$3,127
Median monthly housing costs
$1,110
$1,921
Median price asked for vacant for-sale houses and condos
$195,022
$923,387
Estimated median house or condo value
$219,200
$848,600
Median numbers of rooms
5
4.3
Median number of rooms in apartments
4.2
3.6
Median number of rooms in houses and condos
6.3
5.7
Median house price - detached houses
$233,452
Over $1,000,000
Median house price - in 2-unit structures
$121,729
$781,885
Median house price - in 3-to-4-unit structures
$215,337
$716,428
Median house price - in 5 or more unit structures
$240,711
$709,698
Median house price - mobile homes
$121,578
$365,144
Median house price - occupied boats, rvs, vans etc.
$27,006
$485,645
Median house price - Townhouses or other attached units
$218,726
$834,685
Median house price - All housing units
$229,736
$991,120
Median house age
42
69
Renting percentage
53%
58.9%
Housing density (houses/condos per square mile)
2,007.5
3,329.9
House value disparities
30.2%
22.3%
Household income disparities
42.4%
45.9%
Median household income for houses/condes with a mortgage
$89,058
$153,718
Median household income for apartments without a mortgage
$59,295
$81,904
Housing units without a mortgage
4,290 (3.3%)
1,176 (2.2%)
Housing units with both a second mortgage and home equity loan
10,651 (8.2%)
4,996 (9.4%)
Housing units with a mortgage
125,487 (96.7%)
51,720 (97.8%)
Housing units with a home equity loan
775 (0.6%)
139 (0.3%)
Housing units with a second mortgage
13,558 (10.4%)
6,096 (11.5%)
House/condo owner moved in on average (years ago)
10
13
House/condo renter moved in on average (years ago)
1
4
Housing units lacking complete kitchen facilities
1.6%
2.4%
Housing units lacking complete plumbing facilities
1.3%
1.6%
Housing units in structures
Housing units in structures
Columbus
Oakland
One, detached
45.8%
42.3%
One, attached
9.1%
4.9%
Two
4.0%
6.2%
3 or 4
8.6%
11.1%
5 to 9
11.8%
6.6%
10 to 19
8.6%
6.9%
20 to 49
4.5%
9.9%
50 or more
6.8%
11.7%
Mobile homes
0.8%
0.3%
Boats, RVs, vans, etc.
0.1%
0.1%
Median real estate property taxes paid for housing units
Self-employed workers in own not incorporated business
20,915
20,615
State government workers
31,881
9,112
Unpaid family workers
724
529
Industries and Occupations
In Columbus, occupations in healthcare, education, and government dominate the job market. Looking towards the future, Columbus is emerging as a smart city with a focus on technology and innovation-driven jobs. Oakland has a more diverse range of industries, with healthcare, digital media, clean energy, and food processing taking a significant share of the occupational pie.
Columbus has numerous well-regarded hospitals and healthcare systems, including Ohio State University Wexner Medical Center. Oakland isn't far behind with access to top-notch healthcare through facilities like Kaiser Permanente Oakland Medical Center.
Health (county statistics)
Type
Columbus
Oakland
General health status score of residents in this county from 1 (poor) to 5 (excellent)
Oakland boasts an impressive infrastructure with substantial road, rail, and water connections, making it a significant West Coast port. Conversely, Columbus, situated in the heartland of America, has its strength in logistic centers and an expanding tech sector, though it lacks the coastal access Oakland enjoys.
Infrastructure
Type
Columbus
Oakland
Hospitals
47
9
TV stations
14
28
Arenas or stadiums
3
2
Bank branches located here
200
76
Bank institutions located here
25
29
Main business address for public companies
23
10
Drinking water stations with no reported violations in the past
17
10
Drinking water stations with reported violations in the past
HMDA - Conventional home purchase loans - Applications denied
Year
Columbus
Oakland
1999
2,450
1,291
2000
2,376
1,721
2001
1,897
1,244
2002
1,483
1,370
2003
2,087
2,021
2004
3,216
3,261
2005
4,275
3,850
2006
4,662
4,422
2007
2,679
2,645
2008
1,015
1,041
2009
555
700
Culture and Food
Oakland is known for its eclectic cultural scene and diverse food offerings, influenced by its notable racial and ethnic diversity. Columbus also boasts a vibrant culture and food scene, with a Midwestern flair, represented by countless breweries, restaurants, festivals, art galleries, and theaters.
Sports Teams
Both cities are home to passionate sports cultures. Columbus is home to the NHL's Blue Jackets, MLS's Crew, and the highly followed Ohio State Buckeyes. Oakland, once home to the NFL's Raiders and MLB's Athletics, still enjoys a strong sports culture particularly through its passionate support of the NBA's Golden State Warriors.


 Columbus, OH
 Oakland, CA