Living in Columbus, Ohio and Portland, Oregon, provides varying experiences due to their distinct geographical locations, economic situations, cultural backgrounds, and civic amenities. The variations come into play across several factors, including crime and safety, weather conditions, cost of living, education, work and economy, infrastructure, industries, real estate, neighborhoods, public transit, taxes, and healthcare, among others. This comprehensive comparison will help potential residents and tourists understand what each city has to offer and what sets them apart.
Distance between
Columbus, OH and
Portland, OR : 2,026.0 miles
Columbus's population is larger by 41%. Its population has grown by 195,058 people (27.4%) since 2000. The population of Portland has grown by 112,041 people (21.2%) during that time.
Columbus has a higher crime rate than the average US city, but it varies widely by neighborhood. Portland's overall crime rate is higher, especially property crime. However, the majority of Portland neighborhoods are safe and peaceful. It's recommended for potential residents and visitors to research and choose the areas they reside or visit wisely.
City-data.com crime index counts serious crimes and violent crime more heavily. It adjusts for the number of visitors and daily workers commuting into cities. (higher means more crime, U.S. average = 301.1)
City-data.com crime index counts serious crimes and violent crime more heavily. It adjusts for the number of visitors and daily workers commuting into cities. (higher means more crime, U.S. average = 301.1)
Sex Offenders
According to our data, there are 1,582 registered sex offenders living in Columbus and 371 registered sex offenders living in . The ratio of residents to sex offenders in Columbus is 545 to 1; the ratio in Portland is 1,724 to 1. The number of registered sex offenders compared to the number of residents is much larger in Columbus than that in Portland.
Cost of Living
The cost of living in Columbus is generally lower than in Portland. Housing is particularly more affordable in Columbus. While Portland offers a higher median salary, it also comes with higher average housing costs and general expenses, making Columbus a potentially more affordable choice.
Income Tax
In terms of income tax, Ohio residents pay a state income tax with the rate ranging from 0% to 4.797%, while Columbus imposes an additional 2.5% city income tax. Oregon has one of the highest state income taxes, ranging from 5% to 9.9%, but there's no city income tax in Portland.
Property Tax
Property tax rates in Columbus tend to be below the national average, with Franklin County averaging 1.72%. In contrast, Multnomah County, where Portland is located, has a higher average property tax rate, at 1.13% of the property's market value, which is above the national average.
Sales Tax
Ohio has a state sales tax rate of 5.75%, while Columbus has an additional 2.5% city sales tax. Oregon, and by extension Portland, has no state or city sales tax, making shopping potentially more attractive for residents and visitors alike.
Income
Type
Columbus
Portland
Estimated median household income
$58,202
$79,057
Estimated per capita income
$32,392
$49,003
Cost of living index (U.S. average is 100)
96.1
106.5
If you make $50,000 in Columbus, you will have to make $55,411 in Portland to maintain the same standard of living.
Geographical Conditions
Columbus is relatively flat, situated in the heartland of Ohio. Portland is known for its beautiful scenery, nestled between the Pacific Ocean and Cascade Mountains, offering lots of outdoor activities.
Columbus is home to the Ohio State University, one of the largest universities in the nation, known for its research programs. Portland is also known for its quality education with well-regarded institutions like Portland State University and Reed College. Both cities take education and research seriously, making either a viable choice for those focused on academics.
Columbus' economy is strong and diverse, with industries such as government, education, insurance, banking, fashion, defense, aviation, food, logistics, steel, energy, medical research, and healthcare. Portland, on the other hand, is known for its strong tech industry presence, alongside manufacturing, healthcare, and professional services.
Biggest Employers
In Columbus, some of the largest employers are Ohio State University, the federal and state government, and Nationwide Insurance. In Portland, Intel, Oregon Health & Science University, and Providence Health & Services are amongst the largest employers.
There were 913 building permits issued in Columbus in 2012 (246 more than in 2011) compared to 474 building permits issued in Portland in 2012 (23 more than in 2011).
In Columbus (Franklin County), 60.8% voted for Democrats and 37.9% for Republicans in 2012 Presidential Election. In Portland (Multnomah County), 75.4% voted for Democrats and 20.6% for Republicans.
Elections
Type
Democrats
Republicans
Other
Year
Columbus
Portland
Columbus
Portland
Columbus
Portland
2020
64.7%
79.2%
33.4%
17.9%
1.9%
2.9%
2016
59.8%
73.3%
33.9%
17.0%
6.2%
9.7%
2012
60.8%
75.4%
37.9%
20.6%
1.3%
4.0%
2008
59.8%
76.7%
39.0%
20.6%
1.2%
2.7%
2004
54.5%
71.6%
45.2%
27.1%
0.3%
1.3%
2000
48.9%
63.8%
47.9%
28.3%
3.2%
7.9%
1996
48.1%
59.2%
44.5%
26.3%
7.3%
14.4%
Breakdown of population affiliated with a religious congregation
Type
Adherents
Congregations
Religion
Columbus
Portland
Columbus
Portland
CATHOLIC CHURCH
13.2%
15.2%
5.6%
6.7%
EVANGELICAL LUTHERAN CHURCH IN AMERICA
1.6%
0.9%
3.7%
4.0%
SOUTHERN BAPTIST CONVENTION
1.6%
0.5%
6.8%
3.8%
MUSLIM ESTIMATE
1.3%
0.3%
1.9%
1.0%
VINEYARD USA
1.3%
0.0%
1.2%
0.2%
AMERICAN BAPTIST CHURCHES IN THE USA
1.0%
0.8%
3.3%
2.7%
EPISCOPAL CHURCH
0.4%
0.7%
1.3%
2.2%
SEVENTH DAY ADVENTIST CHURCH
0.4%
0.9%
2.0%
3.4%
LUTHERAN CHURCH
0.2%
0.4%
1.0%
2.2%
Weather
Columbus residents experience a humid continental climate, with cold, snowy winters and hot, muggy summers. Portland experiences a more moderate oceanic climate with cooler, rainy winters and dry, pleasant summers. The city is known for its environmentally-friendly initiatives, which might appeal to eco-conscious individuals.
Weather and climate
Type
Columbus
Portland
Temperature - Average
52.8°F
53.9°F
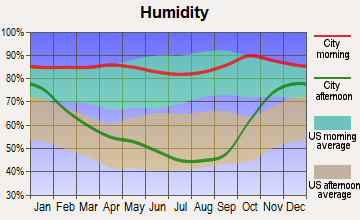
Humidity - Average morning or afternoon humidity
74.8%
76.5%
Humidity - Differences between morning and afternoon humidity
34%
42%
Humidity - Maximum monthly morning or afternoon humidity
86%
86%
Humidity - Minimum monthly morning or afternoon humidity
52%
44%
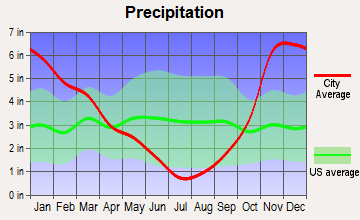
Precipitation - Yearly average
39.3 in
41.6 in
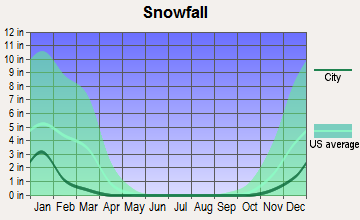
Snowfall - Yearly average
56.6 in
12.8 in
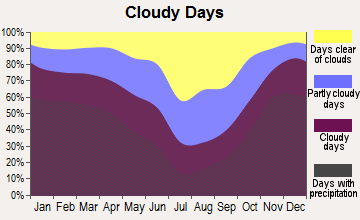
Clouds - Number of days clear of clouds
12%
11.3%
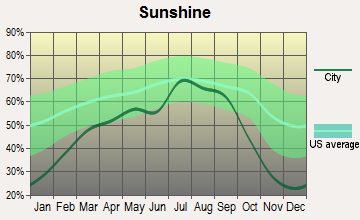
Sunshine amount - Average
49.7%
54.7%
Sunshine amount - Differences during a year
27%
52%
Sunshine amount - Maximum monthly
55%
72%
Sunshine amount - Minimum monthly
28%
20%
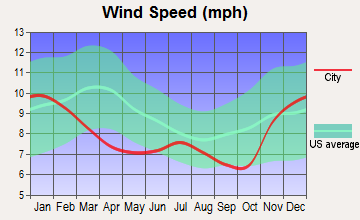
Wind speed - Average
8.2 mph
8.1 mph
Average climate in Columbus, Ohio
Average climate in Portland, Oregon
Air pollution
Type
AQI
CO
NO2
OZONE
PB
PM10
PM25
SO2
Year
Columbus
Portland
Columbus
Portland
Columbus
Portland
Columbus
Portland
Portland
Columbus
Columbus
Portland
Columbus
Portland
2018
69
79
0.11
0.26
10.0
8.8
33.8
21.4
N/A
N/A
N/A
N/A
6.0
7.2
0.0
0.4
2017
68
93
0.16
0.26
9.6
8.7
28.7
22.6
N/A
N/A
N/A
N/A
5.5
7.1
0.1
0.4
2016
76
72
0.17
0.25
10.6
8.7
28.5
20.8
N/A
N/A
N/A
N/A
5.6
5.2
0.1
0.2
2015
74
91
0.16
0.28
11.3
9.2
27.0
20.1
N/A
N/A
N/A
N/A
6.1
7.4
0.1
0.5
2014
82
91
0.20
0.24
11.0
8.5
28.5
21.0
N/A
N/A
N/A
N/A
7.4
6.3
0.5
0.8
2013
78
85
N/A
0.29
8.9
9.6
29.6
17.9
N/A
N/A
N/A
N/A
7.8
8.6
0.6
1.1
2012
87
78
N/A
0.30
N/A
9.1
32.9
21.0
N/A
N/A
N/A
N/A
8.9
7.4
N/A
0.6
2011
89
89
N/A
0.34
N/A
9.4
28.1
18.5
N/A
N/A
N/A
N/A
8.9
8.1
N/A
0.8
2010
90
80
N/A
0.33
N/A
9.1
30.5
19.4
N/A
N/A
N/A
N/A
9.1
6.4
N/A
1.4
2009
61
95
N/A
0.32
N/A
10.2
28.7
20.0
N/A
N/A
N/A
N/A
N/A
8.4
N/A
1.6
2008
65
101
N/A
0.34
N/A
10.9
31.2
19.2
N/A
N/A
N/A
N/A
N/A
8.8
1.8
1.0
2007
80
101
N/A
0.35
N/A
11.4
30.8
18.1
N/A
N/A
N/A
N/A
N/A
8.8
2.8
1.3
2006
75
106
N/A
N/A
N/A
N/A
30.0
N/A
N/A
N/A
23.7
N/A
N/A
7.8
3.3
1.5
2005
87
96
N/A
N/A
N/A
N/A
29.6
N/A
N/A
N/A
27.5
N/A
N/A
8.9
4.1
1.7
2004
77
92
N/A
N/A
N/A
N/A
27.8
N/A
N/A
N/A
24.6
N/A
N/A
9.8
4.4
N/A
2003
91
77
N/A
N/A
N/A
N/A
26.4
N/A
0.008
N/A
23.9
N/A
N/A
8.6
4.1
N/A
2002
93
68
N/A
N/A
N/A
N/A
31.3
N/A
0.010
N/A
25.7
N/A
N/A
8.4
4.1
N/A
2001
84
73
N/A
N/A
N/A
N/A
29.2
N/A
0.008
N/A
25.9
N/A
N/A
8.9
3.5
N/A
2000
57
52
N/A
N/A
N/A
N/A
N/A
N/A
N/A
N/A
23.5
N/A
N/A
N/A
3.7
N/A
Natural disasters
Type
Columbus
Portland
Tornado activity compared to U.S. average
119.1%
8.4%
Earthquake activity compared to U.S. average
96.1%
1,575.5%
Natural disasters compared to U.S. average
16%
9%
Transportation
Columbus boasts an efficient bus transportation system, but car is still the most common commuting method. Portland, known for its green efforts, has an effective public transit network including buses, light rail, and streetcar, plus biking is a popular commuting option.
Transport
Type
Columbus
Portland
Amtrak stations
1
1
Amtrak stations nearby
1
3
FAA registered aircraft
415
804
FAA registered aircraft manufacturers and dealers
4
6
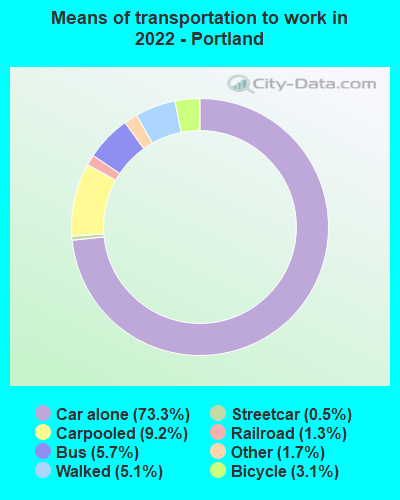
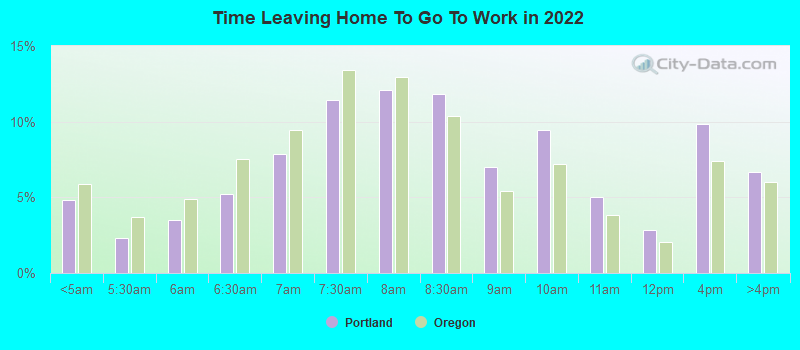
Means of transportation to work
Type
Columbus
Portland
Bicycle
0.6%
3.1%
Bus
1.6%
4.6%
Carpooled
7.4%
9.4%
Car alone
86.7%
76.2%
Motorcycle
0%
0.2%
Railroad
0%
0.9%
Streetcar
0%
0.3%
Taxicab
0.1%
0.1%
Walked
2.2%
3.8%
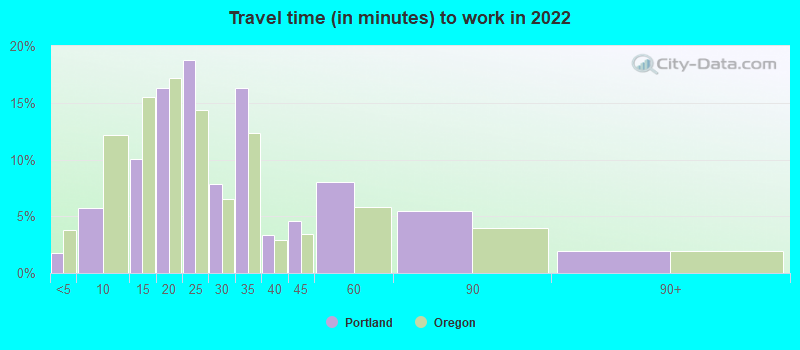
Average travel time to work
Type
Columbus
Portland
Average
26.1 min
28.8 min
Other means
21.7 min
21.8 min
Public transportation
35.4 min
38.2 min
Private vehicle occupancy
Type
Columbus
Portland
Average
1.1
1.2
Drove alone
90.7%
88.2%
In 2 person carpool
7.3%
8.4%
In 3 person carpool
1.4%
1.6%
In 4 person carpool
0.5%
0.8%
In 5-6 person carpool
0.1%
0.6%
In 7+ person carpool
0.1%
0.4%
How many people usually rode to work in the car, truck or van.
Real Estate
In terms of real estate, the median home price in Columbus is far less than in Portland, making Columbus a more affordable option overall. Portland's real estate market, though more expensive, offers a variety of housing styles from classic bungalows to modern apartments.
Neighborhoods
Columbus has various neighborhoods to suit diverse lifestyles, from the urban living in downtown to quiet suburban communities. Portland's neighborhoods also offer variety, from trendy Pearl District to the bohemian Hawthorne Blvd.
Houses and residents
Type
Columbus
Portland
Houses
422,120
303,483
Average household size (people)
2.3
2.3
Median year apartment built
1982
1976
Median year house/condo built
1977
1954
Length of stay in the house since moving in
12.6 years
12.1 years
Houses occupied
390,605 (92.5%)
286,734 (94.5%)
Houses occupied by owners
175,427 (44.9%)
153,121 (53.4%)
Houses occupied by renters
215,178 (55.1%)
133,613 (46.6%)
Median rent asked for vacant for-rent units
$1,371
$1,917
Median monthly housing costs
$1,110
$1,535
Median price asked for vacant for-sale houses and condos
$195,022
$248,225
Estimated median house or condo value
$219,200
$520,200
Median numbers of rooms
5
4.8
Median number of rooms in apartments
4.2
3.4
Median number of rooms in houses and condos
6.3
6.2
Median house price - detached houses
$233,452
$568,464
Median house price - in 2-unit structures
$121,729
$576,814
Median house price - in 3-to-4-unit structures
$215,337
$426,181
Median house price - in 5 or more unit structures
$240,711
$466,898
Median house price - mobile homes
$121,578
$136,996
Median house price - occupied boats, rvs, vans etc.
$27,006
$126,313
Median house price - Townhouses or other attached units
$218,726
$416,951
Median house price - All housing units
$229,736
$544,799
Median house age
42
56
Renting percentage
53%
46.3%
Housing density (houses/condos per square mile)
2,007.5
2,259.4
House value disparities
30.2%
23.1%
Household income disparities
42.4%
44.7%
Median household income for houses/condes with a mortgage
$89,058
$122,948
Median household income for apartments without a mortgage
$59,295
$72,663
Housing units without a mortgage
4,290 (3.3%)
2,404 (2.2%)
Housing units with both a second mortgage and home equity loan
10,651 (8.2%)
11,239 (10.1%)
Housing units with a mortgage
125,487 (96.7%)
108,864 (97.8%)
Housing units with a home equity loan
775 (0.6%)
396 (0.4%)
Housing units with a second mortgage
13,558 (10.4%)
12,832 (11.5%)
House/condo owner moved in on average (years ago)
10
9
House/condo renter moved in on average (years ago)
1
1
Housing units lacking complete kitchen facilities
1.6%
1.2%
Housing units lacking complete plumbing facilities
1.3%
0.9%
Housing units in structures
Housing units in structures
Columbus
Portland
One, detached
45.8%
53.3%
One, attached
9.1%
5.7%
Two
4.0%
3.5%
3 or 4
8.6%
4.5%
5 to 9
11.8%
4.0%
10 to 19
8.6%
4.7%
20 to 49
4.5%
6.6%
50 or more
6.8%
16.2%
Mobile homes
0.8%
1.2%
Boats, RVs, vans, etc.
0.1%
0.3%
Median real estate property taxes paid for housing units
Self-employed workers in own not incorporated business
20,915
25,437
State government workers
31,881
15,615
Unpaid family workers
724
688
Industries and Occupations
Key industries in Columbus include education, government, and healthcare, with Ohio State University and the State of Ohio being major employers. In Portland, tech is a significant sector, with Intel being the city's largest employer.
Both cities have strong healthcare systems. In Columbus, the OhioHealth and OSU Medical Center provide quality healthcare. Portland is home to the Oregon Health & Science University, one of the top research institutions in the nation, providing high-quality healthcare services.
Health (county statistics)
Type
Columbus
Portland
General health status score of residents in this county from 1 (poor) to 5 (excellent)
Both cities have robust infrastructures. Columbus is known for its well-structured city layout, with major freeways allowing easy access across the city. Portland, on the other hand, known as a "green city", has a focus on environmental sustainability and has considerable infrastructure in place to support biking and walking.
Infrastructure
Type
Columbus
Portland
Hospitals
47
21
TV stations
14
18
Arenas or stadiums
3
3
Bank branches located here
200
208
Bank institutions located here
25
30
Main business address for public companies
23
32
Drinking water stations with no reported violations in the past
17
2
Drinking water stations with reported violations in the past
HMDA - Conventional home purchase loans - Applications denied
Year
Columbus
Portland
1999
2,450
1,922
2000
2,376
1,651
2001
1,897
1,193
2002
1,483
1,235
2003
2,087
1,844
2004
3,216
2,651
2005
4,275
3,396
2006
4,662
3,510
2007
2,679
3,008
2008
1,015
1,465
2009
555
712
Culture and Food
Both cities are cultural hubs, Columbus is known for its Midwest hospitality, food, and sports culture. On the other hand, Portland is popular for its foodie culture, breweries, eco-mindedness, and indie music and arts scene.
Sports Teams
Columbus is home to two major sports teams: the Columbus Blue Jackets (NHL) and the Columbus Crew (MLS). Portland has the Portland Trail Blazers (NBA) and the Portland Timbers (MLS). Both cities have passionate sports fans.


 Columbus, OH
 Portland, OR