Columbus and Toledo, both in Ohio, offer distinct experiences to residents and visitors. While Columbus is a bustling city with a busy lifestyle and a thriving business and education environment, Toledo, on the western side of Lake Erie, is rich in culture, art, and history. Both cities have their unique charms, which will be discussed in the sections that follow.
Distance between
Columbus, OH and
Toledo, OH : 119.7 miles
Columbus's population is larger by 238%. Its population has grown by 195,058 people (27.4%) since 2000. The population of Toledo has decreased by 45,111 people (14.4%) during that time.
Columbus has a higher crime rate compared to Toledo, although it's on par with the national average. However, certain areas such as German Village and Victorian Village in Columbus are considered safe. Toledo, on the other hand, has pockets with higher crime rates although the city, in general, has an average crime rate lower than Columbus. Safety should be evaluated on a neighborhood-wise basis in both cities.
City-data.com crime index counts serious crimes and violent crime more heavily. It adjusts for the number of visitors and daily workers commuting into cities. (higher means more crime, U.S. average = 301.1)
City-data.com crime index counts serious crimes and violent crime more heavily. It adjusts for the number of visitors and daily workers commuting into cities. (higher means more crime, U.S. average = 301.1)
Sex Offenders
According to our data, there are 1,505 registered sex offenders living in Columbus and 850 registered sex offenders living in . The ratio of residents to sex offenders in Columbus is 573 to 1; the ratio in Toledo is 328 to 1. The number of registered sex offenders compared to the number of residents is a smaller in Columbus than in Toledo.
Cost of Living
The cost of living in Toledo is lower than the national average and significantly lower than that in Columbus. Housing is particularly more affordable in Toledo, which makes it an attractive option for people planning to relocate.
Income Tax
As for income taxes, both cities offer a rate of 2.5%.
Property Tax
Property tax is higher in Toledo compared to Columbus, reflecting the different tax policies of Lucas County (Toledo) and Franklin County (Columbus).
Sales Tax
Both cities lie in the same tax jurisdiction of Ohio and therefore have the same sales tax rate. The combined sales tax rate for the state, county, and city is 7.25% in Columbus and 7.25% in Toledo.
Income
Type
Columbus
Toledo
Estimated median household income
$58,202
$44,150
Estimated per capita income
$32,392
$25,641
Cost of living index (U.S. average is 100)
96.1
91.8
If you make $50,000 in Toledo, you will have to make $52,342 in Columbus to maintain the same standard of living.
Geographical Conditions
Columbus, located more centrally in Ohio, is characterized by flat terrains and broad, tree-lined avenues. Toledo is near Lake Erie and the Maumee River, resulting in a more water-influenced climate and geography, with beautiful riverfront views and access to the Great Lakes region.
Columbus is home to the Ohio State University, one of the largest universities in the U.S. This leads to a lively student population and a wealth of academic and cultural activities. Toledo also has good educational institutions, including the University of Toledo, but it cannot compete with the sheer volume and diversity of opportunities in Columbus.
Columbus has a more robust economy with a lower unemployment rate compared to Toledo. Major industries in Columbus include education, health services, and finance. Toledo's economy, although smaller, has been growing steadily, with healthcare and manufacturing playing significant roles.
Biggest Employers
The biggest employers of Columbus include Ohio State University, the State of Ohio, JP Morgan Chase, Nationwide, and Honda. In Toledo, key employers are ProMedica, Mercy Health, and the University of Toledo.
There were 913 building permits issued in Columbus in 2012 (246 more than in 2011) compared to 23 building permits issued in Toledo in 2012 (10 less than in 2011).
In Columbus (Franklin County), 60.8% voted for Democrats and 37.9% for Republicans in 2012 Presidential Election. In Toledo (Lucas County), 65.2% voted for Democrats and 33.4% for Republicans.
Elections
Type
Democrats
Republicans
Other
Year
Columbus
Toledo
Columbus
Toledo
Columbus
Toledo
2020
64.7%
57.5%
33.4%
40.8%
1.9%
1.7%
2016
59.8%
55.9%
33.9%
38.2%
6.2%
5.9%
2012
60.8%
65.2%
37.9%
33.4%
1.3%
1.4%
2008
59.8%
65.1%
39.0%
33.6%
1.2%
1.4%
2004
54.5%
60.4%
45.2%
39.6%
0.3%
0.0%
2000
48.9%
57.9%
47.9%
39.2%
3.2%
2.8%
1996
48.1%
57.7%
44.5%
32.0%
7.3%
10.3%
Breakdown of population affiliated with a religious congregation
Type
Adherents
Congregations
Religion
Columbus
Toledo
Columbus
Toledo
CATHOLIC CHURCH
13.2%
20.9%
5.6%
9.4%
EVANGELICAL LUTHERAN CHURCH IN AMERICA
1.6%
4.1%
3.7%
9.1%
SOUTHERN BAPTIST CONVENTION
1.6%
0.3%
6.8%
3.5%
MUSLIM ESTIMATE
1.3%
0.4%
1.9%
0.8%
VINEYARD USA
1.3%
0.0%
1.2%
0.3%
AMERICAN BAPTIST CHURCHES IN THE USA
1.0%
0.5%
3.3%
3.2%
EPISCOPAL CHURCH
0.4%
0.5%
1.3%
2.2%
SEVENTH DAY ADVENTIST CHURCH
0.4%
0.2%
2.0%
0.5%
LUTHERAN CHURCH
0.2%
0.7%
1.0%
2.7%
NATIONA ASSOCIA CONGREG CHRISTIAN CHURCHES
0.0%
0.3%
0.1%
1.3%
Weather
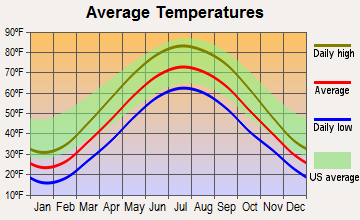
Both cities experience cold winters with snowfall and hot, humid summers. Columbus generally has milder winters and hotter summers than Toledo. Toledo, being closer to Lake Erie, can experience lake-effect snow and cooler summer breezes.
Weather and climate
Type
Columbus
Toledo
Temperature - Average
52.8°F
49.2°F
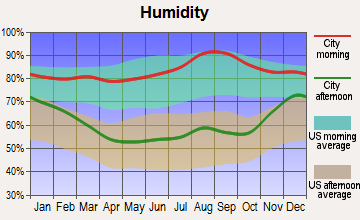
Humidity - Average morning or afternoon humidity
74.8%
76.9%
Humidity - Differences between morning and afternoon humidity
34%
37%
Humidity - Maximum monthly morning or afternoon humidity
86%
89%
Humidity - Minimum monthly morning or afternoon humidity
52%
52%
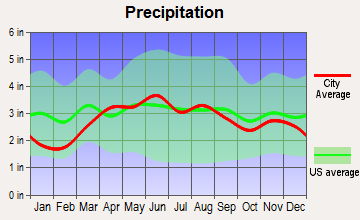
Precipitation - Yearly average
39.3 in
33.3 in
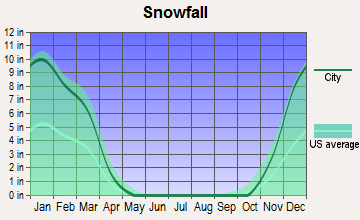
Snowfall - Yearly average
56.6 in
75.3 in
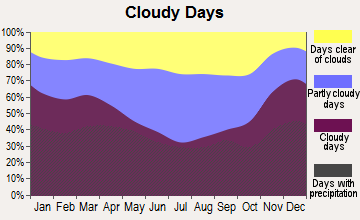
Clouds - Number of days clear of clouds
12%
12.3%
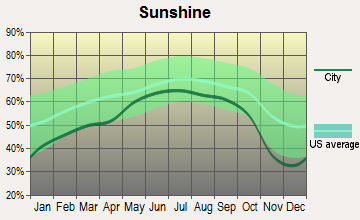
Sunshine amount - Average
49.7%
55.1%
Sunshine amount - Differences during a year
27%
36%
Sunshine amount - Maximum monthly
55%
65%
Sunshine amount - Minimum monthly
28%
29%
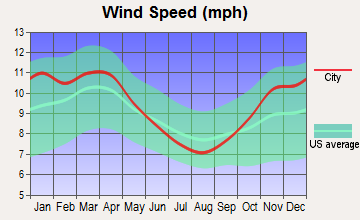
Wind speed - Average
8.2 mph
9.4 mph
Average climate in Columbus, Ohio
Average climate in Toledo, Ohio
Air pollution
Type
AQI
CO
NO2
OZONE
PM10
PM25
SO2
Year
Columbus
Toledo
Columbus
Columbus
Columbus
Toledo
Columbus
Toledo
Columbus
Columbus
Toledo
2018
69
47
0.11
N/A
10.0
N/A
33.8
30.1
N/A
N/A
6.0
N/A
0.0
0.7
2017
68
45
0.16
N/A
9.6
N/A
28.7
29.0
N/A
N/A
5.5
N/A
0.1
0.4
2016
76
50
0.17
N/A
10.6
N/A
28.5
29.9
N/A
N/A
5.6
N/A
0.1
0.5
2015
74
45
0.16
N/A
11.3
N/A
27.0
28.7
N/A
N/A
6.1
N/A
0.1
0.9
2014
82
50
0.20
N/A
11.0
N/A
28.5
28.8
N/A
N/A
7.4
N/A
0.5
1.7
2013
78
40
N/A
N/A
8.9
N/A
29.6
25.2
N/A
N/A
7.8
N/A
0.6
1.0
2012
87
84
N/A
N/A
N/A
N/A
32.9
30.6
N/A
23.5
8.9
N/A
N/A
N/A
2011
89
65
N/A
N/A
N/A
N/A
28.1
25.7
N/A
21.0
8.9
N/A
N/A
N/A
2010
90
69
N/A
N/A
N/A
N/A
30.5
27.2
N/A
24.6
9.1
N/A
N/A
N/A
2009
61
64
N/A
N/A
N/A
N/A
28.7
25.4
N/A
21.4
N/A
N/A
N/A
N/A
2008
65
68
N/A
N/A
N/A
N/A
31.2
26.8
N/A
21.6
N/A
N/A
1.8
N/A
2007
80
86
N/A
N/A
N/A
N/A
30.8
25.9
N/A
24.2
N/A
N/A
2.8
3.8
2006
75
70
N/A
N/A
N/A
N/A
30.0
24.7
23.7
22.8
N/A
N/A
3.3
3.7
2005
87
84
N/A
N/A
N/A
N/A
29.6
27.8
27.5
21.6
N/A
N/A
4.1
5.1
2004
77
67
N/A
N/A
N/A
N/A
27.8
23.6
24.6
19.2
N/A
N/A
4.4
5.6
2003
91
77
N/A
N/A
N/A
N/A
26.4
26.0
23.9
18.5
N/A
N/A
4.1
6.5
2002
93
85
N/A
N/A
N/A
N/A
31.3
27.5
25.7
23.5
N/A
N/A
4.1
5.7
2001
84
76
N/A
N/A
N/A
N/A
29.2
26.9
25.9
23.4
N/A
N/A
3.5
5.3
2000
57
64
N/A
N/A
N/A
N/A
N/A
24.0
23.5
23.4
N/A
N/A
3.7
4.2
Natural disasters
Type
Columbus
Toledo
Tornado activity compared to U.S. average
119.1%
144.4%
Earthquake activity compared to U.S. average
96.1%
67.7%
Natural disasters compared to U.S. average
16%
13%
Transportation
Columbus has a more developed public transportation system with a number of bus and bike-share services. The commute time is also better in Columbus. Toledo has a comprehensive bus service, but is a more car-dependent city.
Transport
Type
Columbus
Toledo
Amtrak stations
1
1
Amtrak stations nearby
1
1
FAA registered aircraft
415
102
FAA registered aircraft manufacturers and dealers
4
7
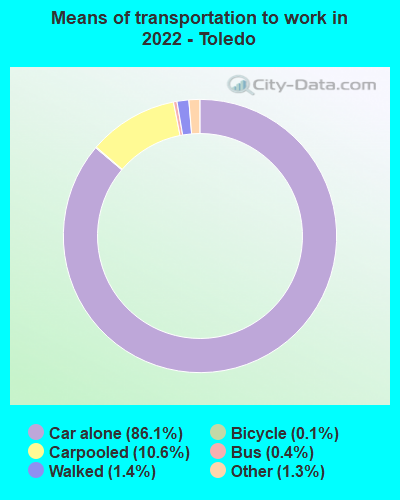
Means of transportation to work
Type
Columbus
Toledo
Bicycle
0.6%
0.2%
Bus
1.6%
1.1%
Carpooled
7.4%
9.2%
Car alone
86.7%
85.7%
Taxicab
0.1%
0.2%
Walked
2.2%
2.2%
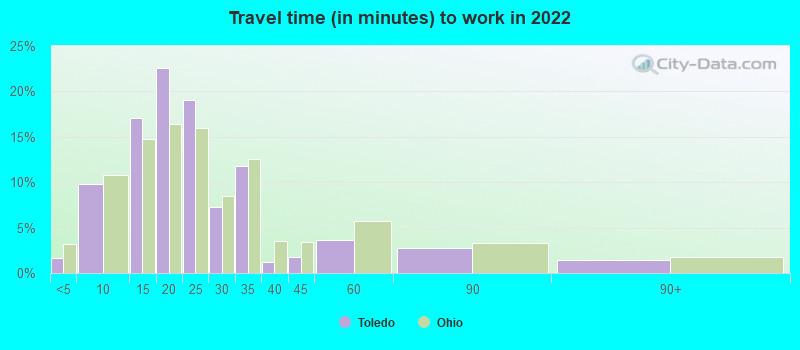
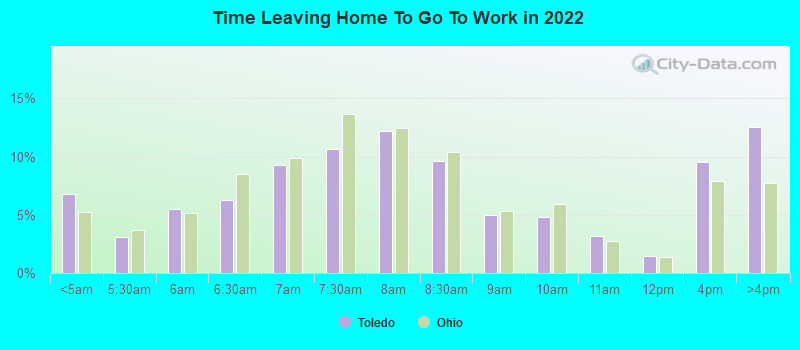
Average travel time to work
Type
Columbus
Toledo
Average
26.1 min
22.9 min
Other means
21.7 min
20.4 min
Public transportation
35.4 min
37.9 min
Private vehicle occupancy
Type
Columbus
Toledo
Average
1.1
1.1
Drove alone
90.7%
88.6%
In 2 person carpool
7.3%
9.9%
In 3 person carpool
1.4%
0.6%
In 4 person carpool
0.5%
0.6%
In 5-6 person carpool
0.1%
0.2%
In 7+ person carpool
0.1%
0.1%
How many people usually rode to work in the car, truck or van.
Real Estate
Real estate in Columbus is more expensive compared to Toledo. However, both cities offer a wide range of options from downtown apartments to suburban homes. Gentrification is also occurring in certain neighborhoods in both cities, leading to an increase in property values.
Neighborhoods
Both cities boast diverse neighborhoods. In Columbus, SoHud is famous for its artistic community, while Victorian Village for its historic homes. In Toledo, Old West End is known for its architectural beauty and festivals, while Point Place presents a maritime charm.
Houses and residents
Type
Columbus
Toledo
Houses
422,120
133,129
Average household size (people)
2.3
2.3
Median year apartment built
1982
1967
Median year house/condo built
1977
1953
Length of stay in the house since moving in
12.6 years
15.4 years
Houses occupied
390,605 (92.5%)
120,895 (90.8%)
Houses occupied by owners
175,427 (44.9%)
67,831 (56.1%)
Houses occupied by renters
215,178 (55.1%)
53,064 (43.9%)
Median rent asked for vacant for-rent units
$1,371
$666.64
Median monthly housing costs
$1,110
$752
Median price asked for vacant for-sale houses and condos
$195,022
$77,176
Estimated median house or condo value
$219,200
$100,100
Median numbers of rooms
5
5.7
Median number of rooms in apartments
4.2
4.5
Median number of rooms in houses and condos
6.3
6.4
Median house price - detached houses
$233,452
$114,880
Median house price - in 2-unit structures
$121,729
$106,468
Median house price - in 3-to-4-unit structures
$215,337
$56,240
Median house price - in 5 or more unit structures
$240,711
$108,374
Median house price - mobile homes
$121,578
$141,902
Median house price - Townhouses or other attached units
$218,726
$127,839
Median house price - All housing units
$229,736
$114,763
Median house age
42
65
Renting percentage
53%
44.5%
Housing density (houses/condos per square mile)
2,007.5
1,651.3
House value disparities
30.2%
38.9%
Household income disparities
42.4%
45.1%
Median household income for houses/condes with a mortgage
$89,058
$70,155
Median household income for apartments without a mortgage
$59,295
$46,019
Housing units without a mortgage
4,290 (3.3%)
1,756 (4.5%)
Housing units with both a second mortgage and home equity loan
10,651 (8.2%)
2,444 (6.2%)
Housing units with a mortgage
125,487 (96.7%)
37,635 (95.5%)
Housing units with a home equity loan
775 (0.6%)
70 (0.2%)
Housing units with a second mortgage
13,558 (10.4%)
3,377 (8.6%)
House/condo owner moved in on average (years ago)
10
15
House/condo renter moved in on average (years ago)
1
3
Housing units lacking complete kitchen facilities
1.6%
4.1%
Housing units lacking complete plumbing facilities
1.3%
4.3%
Housing units in structures
Housing units in structures
Columbus
Toledo
One, detached
45.8%
66.3%
One, attached
9.1%
3.4%
Two
4.0%
5.0%
3 or 4
8.6%
4.7%
5 to 9
11.8%
5.2%
10 to 19
8.6%
4.9%
20 to 49
4.5%
3.1%
50 or more
6.8%
5.4%
Mobile homes
0.8%
2.0%
Boats, RVs, vans, etc.
0.1%
0.0%
Median real estate property taxes paid for housing units
Self-employed workers in own not incorporated business
20,915
5,059
State government workers
31,881
3,238
Unpaid family workers
724
91
Industries and Occupations
Columbus has a diversified economy wherein government, education, insurance, banking, fashion, defense, aviation, food, logistics, steel, energy, medical research, healthcare, hospitality, retail, and technology contribute significantly. In contrast, Toledo's economy is more focused on auto assembly, glass, solar, healthcare, education, and is known for its growing art community.
Both cities offer competent healthcare services. However, Columbus, being significantly larger, provides more extensive facilities with several major hospitals, medical centers, and research facilities. In Toledo, ProMedica Toledo Hospital and Mercy Health - St. Vincent Medical Center are notable healthcare service providers.
Health (county statistics)
Type
Columbus
Toledo
General health status score of residents in this county from 1 (poor) to 5 (excellent)
Columbus, being the state capitol, has well-developed infrastructure with numerous public buildings, parks, an efficient power grid, and good internet connectivity. Toledo's infrastructure is older but has been seeing improvements with recent developments in downtown and the warehouse district.
Infrastructure
Type
Columbus
Toledo
Hospitals
47
18
TV stations
14
12
Arenas or stadiums
3
2
Bank branches located here
200
77
Bank institutions located here
25
11
Main business address for public companies
23
9
Drinking water stations with no reported violations in the past
17
10
Drinking water stations with reported violations in the past
HMDA - Conventional home purchase loans - Applications denied
Year
Columbus
Toledo
1999
2,450
1,192
2000
2,376
1,302
2001
1,897
1,034
2002
1,483
719
2003
2,087
841
2004
3,216
1,086
2005
4,275
1,399
2006
4,662
1,229
2007
2,679
767
2008
1,015
408
2009
555
149
Culture and Food
Columbus has a vibrant cultural scene with numerous festivals, museums, and a thriving music scene. The city is also known for its diverse culinary scene. Toledo, on the other hand, showcases a rich artistic culture, with many museums, galleries, and a distinctive glass-making heritage. Toledo has a strong culinary presence with local favorites like the Toledo-style pizza.
Sports Teams
Columbus sports fans enjoy cheering for the Ohio State Buckeyes, as well as pro teams like the Columbus Crew SC and Columbus Blue Jackets. Toledo supports its local minor league teams, such as the Mud Hens (baseball) and Walleye (hockey).


 Columbus, OH
 Toledo, OH