Dallas, Texas, and Cincinnati, Ohio, are two distinct cities with unique attributes. Dallas is larger and has a growing economy, pro-business environment, and a warmer climate. In contrast, Cincinnati has a rich history, a vibrant arts scene, and experiences a cooler climate with diverse seasons. Each city has its share of benefits and drawbacks, and the choice between them could be influenced by personal needs and preferences such as career, lifestyle, and weather preferences.
Distance between
Dallas, TX and
Cincinnati, OH : 813.4 miles
Dallas's population is larger by 317%. Its population has grown by 99,877 people (8.4%) since 2000. The population of Cincinnati has decreased by 22,350 people (6.7%) during that time.
Regarding crime and safety, both Dallas and Cincinnati face challenges. The crime rate in Dallas is higher than the national average. However, the crime rate varies throughout the city, with some neighborhoods comparatively safer than others. Cincinnati also has a crime rate above the national average, with violent crime being a particular concern. In both cities, it is important for residents and visitors to stay aware of their surroundings, particularly in certain areas and during night times.
City-data.com crime index counts serious crimes and violent crime more heavily. It adjusts for the number of visitors and daily workers commuting into cities. (higher means more crime, U.S. average = 301.1)
City-data.com crime index counts serious crimes and violent crime more heavily. It adjusts for the number of visitors and daily workers commuting into cities. (higher means more crime, U.S. average = 301.1)
Sex Offenders
According to our data, there are 4,297 registered sex offenders living in Dallas and 1,094 registered sex offenders living in . The ratio of residents to sex offenders in Dallas is 307 to 1; the ratio in Cincinnati is 273 to 1. The number of registered sex offenders compared to the number of residents in Dallas is near to than in Cincinnati.
Cost of Living
The cost of living in Dallas is slightly above the national average, driven higher by housing costs. However, it's still quite affordable compared to other major U.S. cities. Cincinnati, in contrast, has a lower cost of living than the national average, making it an affordable option for many people, especially those looking for lower housing costs.
Income Tax
Texas is one of the few states that does not impose an income tax, which means Dallas residents are not subject to state income tax. Ohio, on the other hand, imposes a state income tax, and Cincinnati also imposes a city income tax.
Property Tax
In terms of property tax, Texas is known for its high property tax rates, which applies to Dallas. While home prices are lower in Cincinnati, property taxes in Ohio are higher than the national average.
Sales Tax
The combined state and local sales tax rate in Dallas, Texas is 8.25%. In contrast, Cincinnati, Ohio, has a combined state and local sales tax rate of 7%.
Income
Type
Dallas
Cincinnati
Estimated median household income
$57,995
$42,733
Estimated per capita income
$38,479
$34,519
Cost of living index (U.S. average is 100)
96.1
89
If you make $50,000 in Cincinnati, you will have to make $53,989 in Dallas to maintain the same standard of living.
Geographical Conditions
Geographically, Dallas is part of the flat Texas plains, with few natural landmarks. Cincinnati is located by the Ohio River and is rich in rolling hills and green spaces.
Both Dallas and Cincinnati have robust educational systems. Dallas is home to several top-notch universities like Southern Methodist University and the University of Texas at Dallas. Cincinnati also boasts renowned institutions like the University of Cincinnati and Xavier University. In terms of primary and secondary education, both cities have public, private, and charter schools.
Dallas has a strong and diverse economy with thriving sectors including technology, healthcare, and finance. Cincinnati, while smaller, also has a varied economy with strengths in manufacturing, health services, and education. Both cities have a lower unemployment rate than the national average.
Biggest Employers
In Dallas, some of the biggest employers include AT&T, Texas Health Resources, and American Airlines. Cincinnati also hosts several Fortune 500 companies, including Procter & Gamble, Kroger, and Fifth Third Bank.
There were 2,245 building permits issued in Dallas in 2012 (1436 more than in 2011) compared to 206 building permits issued in Cincinnati in 2012 (122 more than in 2011).
In Dallas (Dallas County), 57.3% voted for Democrats and 41.8% for Republicans in 2012 Presidential Election. In Cincinnati (Hamilton County), 52.7% voted for Democrats and 46.4% for Republicans.
Elections
Type
Democrats
Republicans
Other
Year
Dallas
Cincinnati
Dallas
Cincinnati
Dallas
Cincinnati
2020
65.1%
57.2%
33.4%
41.3%
1.4%
1.5%
2016
60.8%
52.8%
34.7%
42.5%
4.5%
4.8%
2012
57.3%
52.7%
41.8%
46.4%
1.0%
0.9%
2008
57.4%
53.1%
42.0%
46.1%
0.6%
0.7%
2004
49.0%
47.3%
50.4%
52.7%
0.5%
0.0%
2000
45.0%
42.8%
52.7%
54.1%
2.4%
3.1%
1996
46.0%
43.1%
46.8%
50.1%
7.2%
6.8%
Breakdown of population affiliated with a religious congregation
Type
Adherents
Congregations
Religion
Dallas
Cincinnati
Dallas
Cincinnati
CATHOLIC CHURCH
18.9%
25.6%
2.4%
12.5%
SOUTHERN BAPTIST CONVENTION
11.0%
1.2%
31.1%
6.5%
MUSLIM ESTIMATE
3.6%
0.2%
1.1%
0.6%
EPISCOPAL CHURCH
1.0%
1.1%
1.5%
3.0%
SEVENTH DAY ADVENTIST CHURCH
0.5%
0.2%
1.7%
0.9%
EVANGELICAL LUTHERAN CHURCH IN AMERICA
0.3%
0.6%
0.9%
1.8%
LUTHERAN CHURCH
0.3%
0.3%
0.7%
1.5%
AMERICAN BAPTIST CHURCHES IN THE USA
0.1%
1.3%
0.2%
2.6%
VINEYARD USA
0.0%
1.8%
0.0%
1.1%
Weather
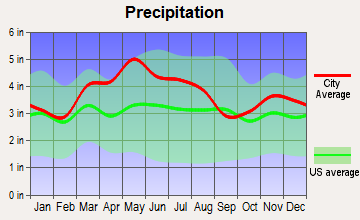
In terms of weather, Dallas is hotter, with a semi-arid climate. It experiences hot, humid summers and mild winters. Tornadoes are a weather concern in the Dallas area. On the other hand, Cincinnati experiences a more diverse range of seasons. Summers are typically hot and humid, while winters can be cold and snowy. Cincinnati can also experience severe weather, such as thunderstorms, particularly in spring and summer.
Weather and climate
Type
Dallas
Cincinnati
Temperature - Average
66.6°F
52.9°F
Humidity - Average morning or afternoon humidity
71.3%
75.8%
Humidity - Differences between morning and afternoon humidity
34%
34%
Humidity - Maximum monthly morning or afternoon humidity
82%
87%
Humidity - Minimum monthly morning or afternoon humidity
48%
53%
Precipitation - Yearly average
37.3 in
45 in
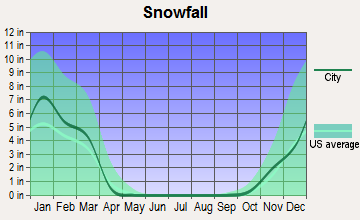
Snowfall - Yearly average
4.2 in
47.6 in
Clouds - Number of days clear of clouds
22.8%
13.5%
Sunshine amount - Average
66.6%
57.8%
Sunshine amount - Differences during a year
20%
33.1%
Sunshine amount - Maximum monthly
74%
67%
Sunshine amount - Minimum monthly
54%
33.9%
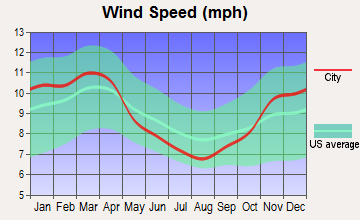
Wind speed - Average
10.3 mph
9 mph
Average climate in Dallas, Texas
Average climate in Cincinnati, Ohio
Air pollution
Type
AQI
CO
NO2
OZONE
PB
PM10
PM25
SO2
Year
Dallas
Cincinnati
Cincinnati
Dallas
Cincinnati
Dallas
Cincinnati
Dallas
Cincinnati
Dallas
Cincinnati
Dallas
Cincinnati
2018
86
87
0.20
N/A
5.7
9.6
28.7
27.8
N/A
N/A
18.3
N/A
9.7
10.5
0.4
0.8
2017
84
81
0.23
N/A
5.5
8.5
28.6
29.2
N/A
N/A
18.8
N/A
9.1
9.2
0.3
1.1
2016
81
88
0.24
N/A
6.1
9.4
27.2
28.4
N/A
N/A
21.2
N/A
8.4
8.4
0.2
1.1
2015
85
91
0.26
N/A
6.5
11.0
26.7
26.4
N/A
N/A
21.5
N/A
8.9
9.5
0.3
1.5
2014
83
89
0.24
N/A
6.3
11.4
27.6
27.3
N/A
N/A
19.5
N/A
9.9
12.0
0.3
2.0
2013
97
92
0.24
N/A
7.3
11.5
28.8
27.0
N/A
N/A
22.9
N/A
13.0
11.9
0.2
2.6
2012
116
97
0.26
N/A
8.6
4.8
31.0
27.6
N/A
N/A
23.4
N/A
12.0
13.6
0.3
3.4
2011
98
102
0.26
N/A
9.4
12.9
30.9
28.1
N/A
N/A
22.1
N/A
11.9
13.1
0.6
4.0
2010
79
113
N/A
N/A
9.4
14.7
28.3
29.7
N/A
N/A
26.6
N/A
N/A
18.7
0.7
3.7
2009
88
77
N/A
N/A
9.2
14.4
28.8
25.6
N/A
N/A
22.6
N/A
N/A
8.2
0.5
2.2
2008
88
85
N/A
N/A
9.8
16.0
29.2
26.5
0.121
N/A
N/A
N/A
N/A
9.4
0.5
3.0
2007
94
100
N/A
N/A
11.0
17.1
25.7
30.2
0.070
N/A
N/A
N/A
N/A
12.7
0.3
4.0
2006
107
83
N/A
N/A
10.8
18.0
30.6
29.3
0.106
N/A
21.9
N/A
N/A
N/A
0.7
4.2
2005
108
110
0.49
N/A
13.0
20.6
29.7
30.9
0.142
N/A
N/A
N/A
11.0
N/A
0.9
5.6
2004
96
91
0.36
N/A
12.3
18.7
26.0
27.7
0.099
N/A
N/A
N/A
N/A
N/A
0.8
5.5
2003
102
86
0.33
N/A
13.6
21.9
27.1
27.6
0.121
N/A
N/A
N/A
N/A
N/A
1.0
4.9
2002
100
98
0.32
N/A
14.0
21.4
25.2
29.4
0.080
N/A
20.0
N/A
N/A
N/A
0.4
4.5
2001
100
102
0.41
N/A
14.3
21.4
26.0
29.4
0.069
N/A
22.9
N/A
N/A
N/A
1.0
5.0
2000
109
104
0.40
N/A
14.5
22.1
27.0
28.0
0.092
N/A
N/A
N/A
N/A
N/A
1.1
6.3
Natural disasters
Type
Dallas
Cincinnati
Tornado activity compared to U.S. average
254.7%
166.3%
Earthquake activity compared to U.S. average
567%
148.2%
Natural disasters compared to U.S. average
21%
15%
Transportation
Dallas has an extensive freeway system and public transit options like buses and light rail offered by DART. Cincinnati has the Cincinnati Metro bus system and streetcars in the Downtown area. Both cities require a car for many errands, but efforts to improve bike and pedestrian networks are ongoing.
Transport
Type
Dallas
Cincinnati
Amtrak stations
1
1
Amtrak stations nearby
1
2
FAA registered aircraft
2
454
FAA registered aircraft manufacturers and dealers
56
16
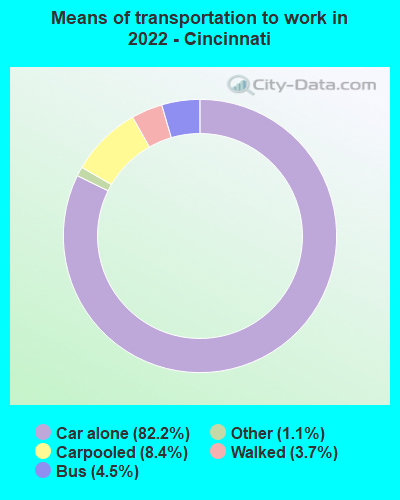
Means of transportation to work
Type
Dallas
Cincinnati
Bicycle
0.3%
0.3%
Bus
1.4%
3.2%
Carpooled
10.9%
7.2%
Car alone
83.9%
84.7%
Railroad
0.2%
0%
Subway
0.2%
0%
Taxicab
0.1%
0.3%
Walked
1.6%
3.4%
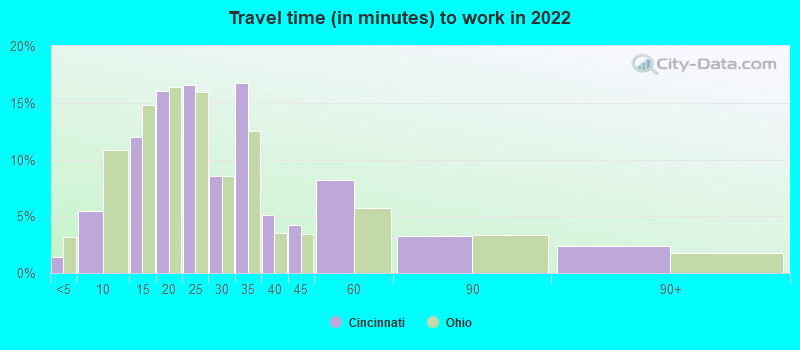
Average travel time to work
Type
Dallas
Cincinnati
Average
31.5 min
26.9 min
Other means
26.5 min
21.8 min
Public transportation
46 min
38 min
Private vehicle occupancy
Type
Dallas
Cincinnati
Average
1.2
1.1
Drove alone
86.8%
89.6%
In 2 person carpool
9%
8.6%
In 3 person carpool
2.6%
1%
In 4 person carpool
0.9%
0.6%
In 5-6 person carpool
0.5%
0.2%
In 7+ person carpool
0.2%
0%
How many people usually rode to work in the car, truck or van.
Real Estate
Dallas has a booming real estate market, with a high demand for homes. This demand pushes the prices up, leading to a higher cost of living. Cincinnati, on the other hand, has a more affordable housing market, with home prices well below the national median.
Neighborhoods
Both cities boast a variety of neighborhoods each with its own characteristics. Dallas neighborhoods range from bustling urban locales like Downtown and artsy areas like Deep Ellum to tranquil, suburban areas like Lake Highlands. Cincinnati also offers a diverse mix of neighborhoods, such as the historic Over-the-Rhine district and the family-friendly Hyde Park.
Houses and residents
Type
Dallas
Cincinnati
Houses
591,773
160,420
Average household size (people)
2.6
2.1
Median year apartment built
1987
1961
Length of stay in the house since moving in
13.9 years
13.7 years
Houses occupied
536,008 (90.6%)
144,929 (90.3%)
Houses occupied by owners
229,518 (42.8%)
55,411 (38.2%)
Houses occupied by renters
306,490 (57.2%)
89,518 (61.8%)
Median rent asked for vacant for-rent units
$1,403
$823.02
Median monthly housing costs
$1,225
$918
Median price asked for vacant for-sale houses and condos
$574,934
$55,446
Estimated median house or condo value
$267,600
$190,300
Median numbers of rooms
4.6
4.6
Median number of rooms in apartments
3.7
3.7
Median number of rooms in houses and condos
6.1
6.5
Median house price - detached houses
$410,272
$271,565
Median house price - in 2-unit structures
$255,160
$236,559
Median house price - in 3-to-4-unit structures
$230,927
$378,023
Median house price - in 5 or more unit structures
$444,589
$288,600
Median house price - mobile homes
$91,039
$76,176
Median house price - Townhouses or other attached units
$350,045
$269,604
Median house price - All housing units
$402,215
$273,493
Median house age
40
70
Renting percentage
55.9%
61.1%
Housing density (houses/condos per square mile)
1,727.6
2,057.5
House value disparities
41.3%
42.9%
Household income disparities
48.2%
51.8%
Median household income for houses/condes with a mortgage
$103,798
$87,346
Median household income for apartments without a mortgage
$61,909
$63,683
Housing units without a mortgage
1,309 (1%)
1,063 (2.8%)
Housing units with both a second mortgage and home equity loan
3,320 (2.6%)
2,466 (6.5%)
Housing units with a mortgage
124,846 (99%)
36,710 (97.2%)
Housing units with a home equity loan
204 (0.2%)
116 (0.3%)
Housing units with a second mortgage
5,351 (4.2%)
3,803 (10.1%)
House/condo owner moved in on average (years ago)
12
11
House/condo renter moved in on average (years ago)
1
1
Housing units lacking complete kitchen facilities
1.2%
2.4%
Housing units lacking complete plumbing facilities
0.9%
1.5%
Housing units in structures
Housing units in structures
Dallas
Cincinnati
One, detached
41.8%
36.6%
One, attached
4.3%
4.9%
Two
1.5%
7.5%
3 or 4
4.9%
12.0%
5 to 9
7.9%
8.8%
10 to 19
12.1%
10.0%
20 to 49
8.1%
6.7%
50 or more
18.4%
13.2%
Mobile homes
1.0%
0.3%
Median real estate property taxes paid for housing units
Self-employed workers in own not incorporated business
43,703
6,809
State government workers
17,325
4,546
Unpaid family workers
754
42
Industries and Occupations
Dallas is known for its energy and telecommunications industries, with growing sectors like technology and healthcare. Cincinnati is home to major industries such as manufacturing, healthcare, and education, with an emerging tech scene.
Dallas hosts world-class healthcare facilities including the UT Southwestern Medical Center. Cincinnati is also known for its health care facilities, especially the Cincinnati Children's Hospital, one of the highest-ranked pediatric hospitals in the nation.
Health (county statistics)
Type
Dallas
Cincinnati
General health status score of residents in this county from 1 (poor) to 5 (excellent)
Both regions have invested in infrastructure. Dallas boasts a sophisticated infrastructure with a mix of modern highways, airports, and rapid transit systems. Cincinnati also has a balance of highways, airports, and public transportation, along with an increasing focus on walkability in many neighborhoods.
Infrastructure
Type
Dallas
Cincinnati
Hospitals
74
46
TV stations
25
16
Arenas or stadiums
2
6
Bank branches located here
394
289
Bank institutions located here
80
35
Main business address for public companies
122
30
Drinking water stations with no reported violations in the past
8
2
Drinking water stations with reported violations in the past
HMDA - Conventional home purchase loans - Applications denied
Year
Dallas
Cincinnati
1999
5,030
1,027
2000
3,390
1,294
2001
2,626
1,046
2002
2,657
978
2003
3,617
1,051
2004
5,460
1,275
2005
7,445
1,694
2006
7,397
1,584
2007
5,056
991
2008
2,200
436
2009
1,121
279
Culture and Food
Dallas is known for its barbeque, authentic Mexican and Tex-Mex foods. The city also hosts many cultural events like arts festivals, rodeos, and music concerts. Cincinnati is famous for its chili and Goetta, a German breakfast sausage. The city hosts a number of well-recognized cultural events such as the Cincinnati Masters tennis tournament and Oktoberfest Zinzinnati, the largest in the US.
Sports Teams
Dallas is a big sports city, with teams like the Dallas Cowboys (NFL), Dallas Mavericks (NBA), and Texas Rangers (MLB). Cincinnati is also passionate about sports, and home to the Cincinnati Bengals (NFL) and the Cincinnati Reds (MLB).


 Dallas, TX
 Cincinnati, OH