Portland, OR and Dallas, TX, two cities with distinct characteristics, provide unique experiences based on weather, cost of living, jobs, culture, and more. Portland is well-known for its nature-friendly mindset, diverse culture, and rainy weather, while Dallas boasts of a more urban environment, stronger economy, wide-ranging job opportunities, and a hotter climate. The comparison extends to the different aspects of life that range from safety, educational opportunities, infrastructure to food. Understanding these differences can greatly aid those looking to relocate or visit either city.
Distance between
Dallas, TX and
Portland, OR : 1,629.1 miles
Dallas's population is larger by 101%. Its population has grown by 99,877 people (8.4%) since 2000. The population of Portland has grown by 112,041 people (21.2%) during that time.
With regard to crime and safety, Portland, OR has a slightly higher property crime rate compared to the national average, primarily because of theft. However, violent crime rates are lower in Portland than in Dallas, TX. Dallas faces higher crime rates in comparison to other cities in Texas and the country at large, primarily driven by property crimes such as burglary and theft. Nevertheless, both cities have numerous safe neighborhoods.
City-data.com crime index counts serious crimes and violent crime more heavily. It adjusts for the number of visitors and daily workers commuting into cities. (higher means more crime, U.S. average = 301.1)
City-data.com crime index counts serious crimes and violent crime more heavily. It adjusts for the number of visitors and daily workers commuting into cities. (higher means more crime, U.S. average = 301.1)
Sex Offenders
According to our data, there are 4,297 registered sex offenders living in Dallas and 374 registered sex offenders living in . The ratio of residents to sex offenders in Dallas is 307 to 1; the ratio in Portland is 1,710 to 1. The number of registered sex offenders compared to the number of residents is much larger in Dallas than that in Portland.
Cost of Living
When it comes to the cost of living, Portland is widely perceived as more expensive than Dallas. This is largely due to the high cost of housing in Portland. Additionally, general expenses such as groceries, healthcare, and utilities tend to run higher in Portland than in Dallas.
Income Tax
Conversely, Texas, including Dallas, has no state income tax. However, Portland residents are subject to both state and city income taxes.
Property Tax
While property taxes in Dallas are higher than the national average, they are somewhat offset by the lack of state income tax. In Portland, property taxes are generally lower, but when combined with state and city income taxes, the overall tax burden is higher.
Sales Tax
Oregon, including Portland, does not have a sales tax, which contrasts sharply with Dallas, where the combined state and city sales tax rate is over 8%.
Income
Type
Dallas
Portland
Estimated median household income
$57,995
$79,057
Estimated per capita income
$38,479
$49,003
Cost of living index (U.S. average is 100)
96.1
106.5
If you make $50,000 in Dallas, you will have to make $55,411 in Portland to maintain the same standard of living.
Geographical Conditions
Dallas resides in the flat Texas plains with a few man-made lakes. Portland, however, has a more diverse geographical profile with the Cascade Range to the east, the Pacific Ocean to the west, and the Columbia and Willamette Rivers running through the city.
Portland boasts excellent educational institutions including some highly rated public and private schools, as well as reputable higher education establishments like Portland State University. Dallas also has a strong education system, with a vast array of public, private and charter schools, as well as reputable universities such as Southern Methodist University and the University of Texas at Dallas.
Dallas has a more robust economy than Portland, largely led by sectors such as technology, financial services, and healthcare. Portland's economy is also vibrant but relies more on the manufacturing sector, specifically in technology. Both offer a range of job opportunities but Dallas has a slightly lower unemployment rate.
Biggest Employers
The biggest employers in Portland include Intel Corporation and Nike. In Dallas, large employers include Texas Health Resources, Dallas ISD, and AT&T. Both cities host a wide range of job opportunities across different sectors.
There were 2,245 building permits issued in Dallas in 2012 (1436 more than in 2011) compared to 474 building permits issued in Portland in 2012 (23 more than in 2011).
In Dallas (Dallas County), 57.3% voted for Democrats and 41.8% for Republicans in 2012 Presidential Election. In Portland (Multnomah County), 75.4% voted for Democrats and 20.6% for Republicans.
Elections
Type
Democrats
Republicans
Other
Year
Dallas
Portland
Dallas
Portland
Dallas
Portland
2020
65.1%
79.2%
33.4%
17.9%
1.4%
2.9%
2016
60.8%
73.3%
34.7%
17.0%
4.5%
9.7%
2012
57.3%
75.4%
41.8%
20.6%
1.0%
4.0%
2008
57.4%
76.7%
42.0%
20.6%
0.6%
2.7%
2004
49.0%
71.6%
50.4%
27.1%
0.5%
1.3%
2000
45.0%
63.8%
52.7%
28.3%
2.4%
7.9%
1996
46.0%
59.2%
46.8%
26.3%
7.2%
14.4%
Breakdown of population affiliated with a religious congregation
Type
Adherents
Congregations
Religion
Dallas
Portland
Dallas
Portland
CATHOLIC CHURCH
18.9%
15.2%
2.4%
6.7%
SOUTHERN BAPTIST CONVENTION
11.0%
0.5%
31.1%
3.8%
MUSLIM ESTIMATE
3.6%
0.3%
1.1%
1.0%
EPISCOPAL CHURCH
1.0%
0.7%
1.5%
2.2%
SEVENTH DAY ADVENTIST CHURCH
0.5%
0.9%
1.7%
3.4%
EVANGELICAL LUTHERAN CHURCH IN AMERICA
0.3%
0.9%
0.9%
4.0%
LUTHERAN CHURCH
0.3%
0.4%
0.7%
2.2%
AMERICAN BAPTIST CHURCHES IN THE USA
0.1%
0.8%
0.2%
2.7%
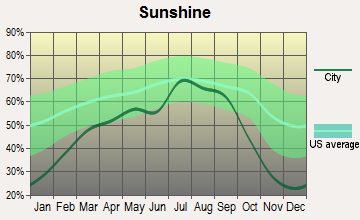
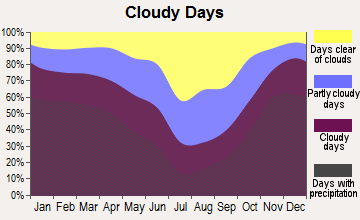
Weather
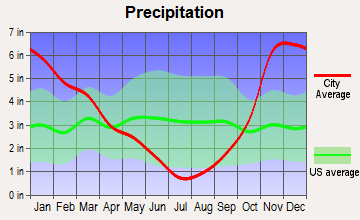
Weather-wise, the two cities offer distinctly different climates. Portland is renowned for its moderate, albeit rainy, climate. It has wet, cool winters and dry, warm summers. On the other hand, Dallas features a subtropical climate with very hot summers and mild winters. Rainfall can occur throughout the year but is most common in the spring.
Weather and climate
Type
Dallas
Portland
Temperature - Average
66.6°F
53.9°F
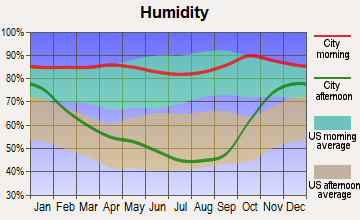
Humidity - Average morning or afternoon humidity
71.3%
76.5%
Humidity - Differences between morning and afternoon humidity
34%
42%
Humidity - Maximum monthly morning or afternoon humidity
82%
86%
Humidity - Minimum monthly morning or afternoon humidity
48%
44%
Precipitation - Yearly average
37.3 in
41.6 in
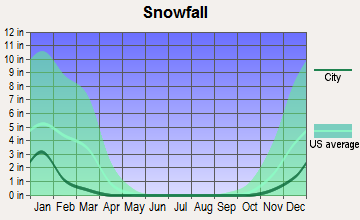
Snowfall - Yearly average
4.2 in
12.8 in
Clouds - Number of days clear of clouds
22.8%
11.3%
Sunshine amount - Average
66.6%
54.7%
Sunshine amount - Differences during a year
20%
52%
Sunshine amount - Maximum monthly
74%
72%
Sunshine amount - Minimum monthly
54%
20%
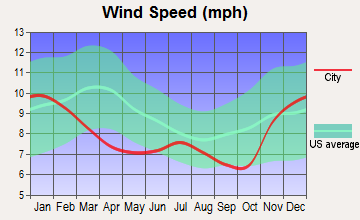
Wind speed - Average
10.3 mph
8.1 mph
Average climate in Dallas, Texas
Average climate in Portland, Oregon
Air pollution
Type
AQI
CO
NO2
OZONE
PB
PM25
SO2
Year
Dallas
Portland
Portland
Dallas
Portland
Dallas
Portland
Dallas
Portland
Dallas
Portland
Dallas
Portland
2018
86
79
0.26
N/A
5.7
8.8
28.7
21.4
N/A
N/A
9.7
7.2
0.4
0.4
2017
84
93
0.26
N/A
5.5
8.7
28.6
22.6
N/A
N/A
9.1
7.1
0.3
0.4
2016
81
72
0.25
N/A
6.1
8.7
27.2
20.8
N/A
N/A
8.4
5.2
0.2
0.2
2015
85
91
0.28
N/A
6.5
9.2
26.7
20.1
N/A
N/A
8.9
7.4
0.3
0.5
2014
83
91
0.24
N/A
6.3
8.5
27.6
21.0
N/A
N/A
9.9
6.3
0.3
0.8
2013
97
85
0.29
N/A
7.3
9.6
28.8
17.9
N/A
N/A
13.0
8.6
0.2
1.1
2012
116
78
0.30
N/A
8.6
9.1
31.0
21.0
N/A
N/A
12.0
7.4
0.3
0.6
2011
98
89
0.34
N/A
9.4
9.4
30.9
18.5
N/A
N/A
11.9
8.1
0.6
0.8
2010
79
80
0.33
N/A
9.4
9.1
28.3
19.4
N/A
N/A
N/A
6.4
0.7
1.4
2009
88
95
0.32
N/A
9.2
10.2
28.8
20.0
N/A
N/A
N/A
8.4
0.5
1.6
2008
88
101
0.34
N/A
9.8
10.9
29.2
19.2
0.121
N/A
N/A
8.8
0.5
1.0
2007
94
101
0.35
N/A
11.0
11.4
25.7
18.1
0.070
N/A
N/A
8.8
0.3
1.3
2006
107
106
N/A
N/A
10.8
N/A
30.6
N/A
0.106
N/A
N/A
7.8
0.7
1.5
2005
108
96
N/A
N/A
13.0
N/A
29.7
N/A
0.142
N/A
11.0
8.9
0.9
1.7
2004
96
92
N/A
N/A
12.3
N/A
26.0
N/A
0.099
N/A
N/A
9.8
0.8
N/A
2003
102
77
N/A
N/A
13.6
N/A
27.1
N/A
0.121
0.008
N/A
8.6
1.0
N/A
2002
100
68
N/A
N/A
14.0
N/A
25.2
N/A
0.080
0.010
N/A
8.4
0.4
N/A
2001
100
73
N/A
N/A
14.3
N/A
26.0
N/A
0.069
0.008
N/A
8.9
1.0
N/A
2000
109
52
N/A
N/A
14.5
N/A
27.0
N/A
0.092
N/A
N/A
N/A
1.1
N/A
Natural disasters
Type
Dallas
Portland
Tornado activity compared to U.S. average
254.7%
8.4%
Earthquake activity compared to U.S. average
567%
1,575.5%
Natural disasters compared to U.S. average
21%
9%
Transportation
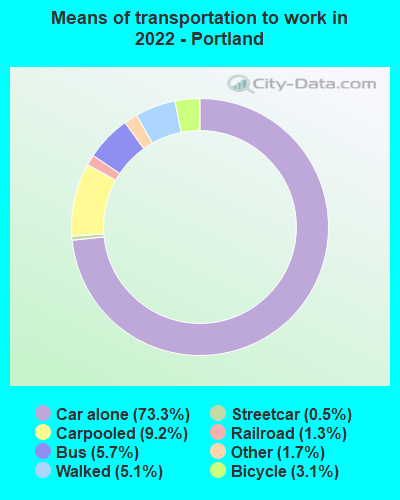
Portland has an excellent public transport system, comprised of buses, light rail, and streetcars. Biking is also popular in Portland. Meanwhile, Dallas relies heavily on cars for transportation, though it also has robust bus and light rail systems through the Dallas Area Rapid Transit (DART) system.
Transport
Type
Dallas
Portland
Amtrak stations
1
1
Amtrak stations nearby
1
3
FAA registered aircraft
2
804
FAA registered aircraft manufacturers and dealers
56
6
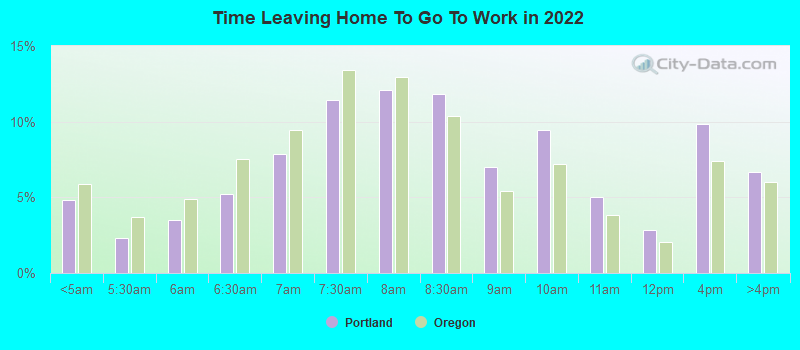
Means of transportation to work
Type
Dallas
Portland
Bicycle
0.3%
3.1%
Bus
1.4%
4.6%
Carpooled
10.9%
9.4%
Car alone
83.9%
76.2%
Motorcycle
0%
0.2%
Railroad
0.2%
0.9%
Streetcar
0.1%
0.3%
Subway
0.2%
0%
Taxicab
0.1%
0.1%
Walked
1.6%
3.8%
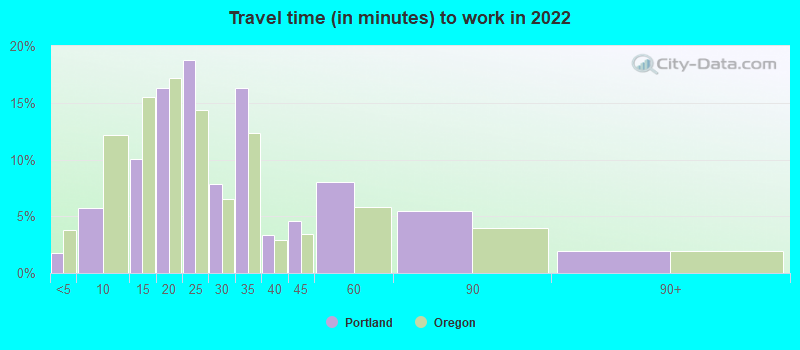
Average travel time to work
Type
Dallas
Portland
Average
31.5 min
28.8 min
Other means
26.5 min
21.8 min
Public transportation
46 min
38.2 min
Private vehicle occupancy
Type
Dallas
Portland
Average
1.2
1.2
Drove alone
86.8%
88.2%
In 2 person carpool
9%
8.4%
In 3 person carpool
2.6%
1.6%
In 4 person carpool
0.9%
0.8%
In 5-6 person carpool
0.5%
0.6%
In 7+ person carpool
0.2%
0.4%
How many people usually rode to work in the car, truck or van.
Real Estate
On the real estate front, Dallas offers more affordable housing options compared to Portland. While both cities are experiencing growth, Portland's limited space and high demand have driven up home prices significantly, making Dallas more inviting for prospective home buyers.
Neighborhoods
Both cities have diverse, culturally rich neighborhoods. Portland is known for districts like Pearl District and Nob Hill, which feature historic buildings and vibrant arts scenes. Meanwhile, Dallas has neighborhoods like Deep Ellum, known for live music, and Highland Park, known for upscale shopping.
Houses and residents
Type
Dallas
Portland
Houses
591,773
303,483
Average household size (people)
2.6
2.3
Median year apartment built
1987
1976
Median year house/condo built
1969
1954
Length of stay in the house since moving in
13.9 years
12.1 years
Houses occupied
536,008 (90.6%)
286,734 (94.5%)
Houses occupied by owners
229,518 (42.8%)
153,121 (53.4%)
Houses occupied by renters
306,490 (57.2%)
133,613 (46.6%)
Median rent asked for vacant for-rent units
$1,403
$1,917
Median monthly housing costs
$1,225
$1,535
Median price asked for vacant for-sale houses and condos
$574,934
$248,225
Estimated median house or condo value
$267,600
$520,200
Median numbers of rooms
4.6
4.8
Median number of rooms in apartments
3.7
3.4
Median number of rooms in houses and condos
6.1
6.2
Median house price - detached houses
$410,272
$568,464
Median house price - in 2-unit structures
$255,160
$576,814
Median house price - in 3-to-4-unit structures
$230,927
$426,181
Median house price - in 5 or more unit structures
$444,589
$466,898
Median house price - mobile homes
$91,039
$136,996
Median house price - Townhouses or other attached units
$350,045
$416,951
Median house price - All housing units
$402,215
$544,799
Median house age
40
56
Renting percentage
55.9%
46.3%
Housing density (houses/condos per square mile)
1,727.6
2,259.4
House value disparities
41.3%
23.1%
Household income disparities
48.2%
44.7%
Median household income for houses/condes with a mortgage
$103,798
$122,948
Median household income for apartments without a mortgage
$61,909
$72,663
Housing units without a mortgage
1,309 (1%)
2,404 (2.2%)
Housing units with both a second mortgage and home equity loan
3,320 (2.6%)
11,239 (10.1%)
Housing units with a mortgage
124,846 (99%)
108,864 (97.8%)
Housing units with a home equity loan
204 (0.2%)
396 (0.4%)
Housing units with a second mortgage
5,351 (4.2%)
12,832 (11.5%)
House/condo owner moved in on average (years ago)
12
9
House/condo renter moved in on average (years ago)
1
1
Housing units lacking complete kitchen facilities
1.2%
1.2%
Housing units lacking complete plumbing facilities
0.9%
0.9%
Housing units in structures
Housing units in structures
Dallas
Portland
One, detached
41.8%
53.3%
One, attached
4.3%
5.7%
Two
1.5%
3.5%
3 or 4
4.9%
4.5%
5 to 9
7.9%
4.0%
10 to 19
12.1%
4.7%
20 to 49
8.1%
6.6%
50 or more
18.4%
16.2%
Mobile homes
1.0%
1.2%
Boats, RVs, vans, etc.
0.0%
0.3%
Median real estate property taxes paid for housing units
Self-employed workers in own not incorporated business
43,703
25,437
State government workers
17,325
15,615
Unpaid family workers
754
688
Industries and Occupations
Both cities have a diverse range of industries and occupations. Dallas is home to many Fortune 500 companies in sectors like technology, healthcare, and telecommunications. Meanwhile, Portland gears more towards technology manufacturing and has a robust creative industry.
Both cities have high-quality healthcare options. Dallas has a larger number of hospitals, including the UT Southwestern Medical Center, ranked among the best hospitals in the country. Portland also offers top-notch healthcare facilities, like Oregon Health & Science University Hospital.
Health (county statistics)
Type
Dallas
Portland
General health status score of residents in this county from 1 (poor) to 5 (excellent)
Dallas is known for its impressive skyline and expansive infrastructure, featuring highways, airports, and expansive public spaces. On the other hand, Portland is recognized for its environmental-friendly approach to infrastructure, with a strong emphasis on public transport and bike-friendly paths.
Infrastructure
Type
Dallas
Portland
Hospitals
74
21
TV stations
25
18
Arenas or stadiums
2
3
Bank branches located here
394
208
Bank institutions located here
80
30
Main business address for public companies
122
32
Drinking water stations with no reported violations in the past
8
2
Drinking water stations with reported violations in the past
HMDA - Conventional home purchase loans - Applications denied
Year
Dallas
Portland
1999
5,030
1,922
2000
3,390
1,651
2001
2,626
1,193
2002
2,657
1,235
2003
3,617
1,844
2004
5,460
2,651
2005
7,445
3,396
2006
7,397
3,510
2007
5,056
3,008
2008
2,200
1,465
2009
1,121
712
Culture and Food
Dallas offers a great mix of cowboy culture with a modern urban twist and a celebrated food scene with BBQ and Tex-Mex. Conversely, Portland is known for its vibrant arts scene, indie music vibe, craft breweries, and a food scene boasting everything from food trucks to high-end dining.
Sports Teams
Sports enthusiasts will find a lot to enjoy in both cities. Dallas is home to well-known teams like the Dallas Cowboys (NFL), Dallas Mavericks (NBA), and Texas Rangers (MLB), among others. In Portland, fans can cheer for the Portland Trail Blazers (NBA) and the Portland Timbers (MLS).


 Dallas, TX
 Portland, OR